-
Paper Information
- Next Paper
- Previous Paper
- Paper Submission
-
Journal Information
- About This Journal
- Editorial Board
- Current Issue
- Archive
- Author Guidelines
- Contact Us
Advances in Analytical Chemistry
p-ISSN: 2163-2839 e-ISSN: 2163-2847
2013; 3(A): 20-27
doi:10.5923/s.aac.201307.04
Sensitive Detection of Mitochondrial DNA A3243G tRNALeu Mutation via an Electrochemical Biosensor Using Meldola’s Blue as a Hybridization Indicator
 Abstract
 Reference
 Full-Text PDF
 Full-text HTML
Yeni Wahyuni Hartati1, Seda Nur Topkaya2, Iman Permana Maksum1, Mehmet Ozsoz3
1Department of Chemistry, Faculty of Mathematics and Natural Sciences, Padjadjaran University, Bandung, 45363, Indonesia
2Department of Analytical Chemistry, Faculty of Pharmacy, Ege University, Izmir, 35100, Turkey
3Department of Biomedical Engineering, Izmir Katip Celebi University, Izmir, 35620, Turkey
Correspondence to: Mehmet Ozsoz, Department of Biomedical Engineering, Izmir Katip Celebi University, Izmir, 35620, Turkey.
| Email: |  |
Copyright © 2012 Scientific & Academic Publishing. All Rights Reserved.
An indicator based electrochemical DNA biosensor for detection of the mitochondrial DNA A3243G tRNALeu point mutation related to maternally inherited diabetes (MID), maternally inherited diabetes and deafness(MIDD) and type 2 diabetes mellitus (DM) is analyzed both with synthetic and real samples for the first time in this study. Meanwhile, MID, MIDD, DM and control samples were verified with agarose gel electrophoresis which is the gold standard methodology for real samples. For this purpose, capture probes were adsorbed onto the disposable pencil graphite electrode (PGE) and the interaction with complementary or non-complementary sequences was carried out by passive adsorption on the surface of the graphite electrodes. The discrimination of probe, probe/complementary target (hybrid), and probe/single base mismatch target was achieved by measuring changes of the peak currents of Meldola’s Blue (MDB) as a hybridization indicator by using 20 base-pair synthetic oligonucleotides and Polymerase Chain Reaction (PCR) amplicons. MDB reduction signal was measured by Differential Pulse Voltammetry (DPV). The sensor was able to clearly distinguish total match from mismatch DNA in a 30 min. detection time. The results obtained DPV experiments for hybridization detection were compared with agarose gel electrophoresis in terms of being alternative as a non-toxic, inexpensive and rapid method. The limit of detection (S/N = 3) was calculated as 2.35% in heteroplasmy which has both wild and mutant type sequences.
Keywords: Mitochondrial DNA, A3243G Mutation, Electrochemical DNA Biosensor, Hybridization Indicator, Meldola’s Blue
Cite this paper: Yeni Wahyuni Hartati, Seda Nur Topkaya, Iman Permana Maksum, Mehmet Ozsoz, Sensitive Detection of Mitochondrial DNA A3243G tRNALeu Mutation via an Electrochemical Biosensor Using Meldola’s Blue as a Hybridization Indicator, Advances in Analytical Chemistry, Vol. 3 No. A, 2013, pp. 20-27. doi: 10.5923/s.aac.201307.04.
Article Outline
1. Introduction
- The A3243G mutation is associated with a number of human diseases which consists of syndromic and non-syndromic mitochondrial disorders. These disorders are due to mitochondrial transfer ribonucleic acid for the leucin gene (tRNA Leu) mutation. This point mutation is associated with mitochondrial encephalopathy, lactic acidosis, and stroke-like episodes syndrome (MELAS), maternally inherited diabetes (MID), maternally inherited diabetes and deafness (MIDD) and type 2- Diabetes Mellitus (type 2-DM) [1-3]. An Adenine to Guanine transversion at nucleotide position 3243 on the tRNA Leu (UUR) gene plays an important role in methylation, amino-acylation, codon recognition and tertiary structure of the molecules structure of the molecules[4, 5]. Myopathy, deafness, cerebellar ataxia or other unusual neurological features associated with diabetes are generally noted as clinical manifestations of mitochondrial diabetes[6]. In a single cell, mitochondria can have a mutation or not in the mtDNA which is called as heteroplasmy. Uniform collection of mtDNA that is either completely normal mtDNA or completely mutant mtDNA is called as homoplasmy. The proportion of mutant mtDNA indicates severity of expression of some diseases[2, 7, 8]. For an observable clinical phenotype a threshold ratio must be reached between the mutant and wild type genomes. The prevalence of the A3243G mutation in DM patients is estimated to be 1–2%[9]. When results of clinical anamnesis indicate the possibility of a mitochondrial DNA point mutation, the diagnosis must be confirmed by a genetic test. There have been several new developments for detecting the mtDNA A3243G mutation. The most common method is PCR amplification of both wild and mutant type alleles, followed by restriction enzyme analysis and ethidium bromide or Gel-star staining[10]. Radio-labelledPCR-restriction fragment length polymorphism (PCR-RFLP)[11], Southern blotting/dot blotting of restriction digestion fragments[12], ligation-mediated PCR[13], amplification refractory mutation system[14][15] and peptide nucleic acid binding assays[16] are all other methods used for analysis of this mutation.Recently, sensitive and selective DNA detection has become increasingly important in diagnosis, gene therapy and other biomedical studies. Electrochemical DNA biosensor systems make analysis of mutations or other genetic alterations possible via detection of the hybridization event between probe and target with voltammetric techniques[17, 18]. Label free methods do not use any external substances whereas labelled electrochemical DNA biosensors use redox-active molecules such as methylene blue[19, 20], echinomycin[21],2-Phthalimido-N-Substitutedphenylethanesulfonamide derivatives[22] and transition metal complexes[23]. These redox-active substances interact with single stranded DNA (ssDNA) and double stranded DNA (dsDNA) in different ways. The changes in the electrochemical response of these labels can be monitored to detect DNA hybridization. Meldola’s Blue(7-dimethylamino-1, 2-benzophenoxazine, MDB) is one of the most extensively studied electrochemical indicators and has been used as an effective electron acceptor for enzyme based biosensor systems[24, 25]. MDB intercalates into the double strand of DNA via its planar penoxazine ring[26]. After the interaction between MDB and dsDNA, a higher MDB signal is observed when compared to the interaction between MDB and ssDNA.In the present study, we have developed an electrochemical DNA biosensor for the detection of the mitochondrial DNA A3243G transversion occurring in less than 50% of the point mutations in heteroplasmy. We used synthetic oligonucleotides and PCR amplicons of DNA extracted from MID, MIDD, type 2-DM, and healthy patients without any need for treatment of mitochondrial DNA. The samples taken from the MID, MIDD and type-2 DM patients were examined for this mutation. This assay is considered to be an alternative to agarose gel electrophoresis which is the gold standard of screening method after PCR. The objective of this study was to design a rapid, selective, and sensitive indicator based electrochemical biosensor that is capable of detecting the mtDNA A3243G mutation within real samples. For this purpose, DNA samples were isolated from peripheral blood lymphocytes of Indonesian type-2 DM patients.To the best of our knowledge, there have been no reports of the electrochemical detection of the mtDNA A3243G mutation having both wild and mutant type sequences in heteroplasmy based on MDB as a hybridization indicator connection with Differential Pulse Voltammetry (DPV). Our future aim will be to produce a kit which can be used in laboratories and allows for a point of care diagnosis of the mtDNA A3243G mutation.
2. Experimental
2.1. Apparatus
- DPV was performed with an µ-Autolab Type III electrochemical analysis system and GPES 4.9 software package (Eco Chemie, The Netherlands). The three electrode system consisted of the pencil graphite electrode (PGE) as the working electrode, the reference electrode (Ag/AgCl) and a platinum wire as the auxiliary electrode. A Rotring T 0.5 pencil was used as the holder for graphite lead (Tombo HB model 0.5 mm). The UV-visible spectrophotometer (Beckman Coulter) was used to measure the concentrations of PCR samples. Techne-512 Thermal Cycler was used for denaturation of the PCR samples.
2.2. Reagents and Solutions
- Synthetic oligonucleotides were purchased from Alpha DNA (Canada) and used without further purification. All oligonucleotides stock solutions (1000 mg/L) were prepared with ultra pure water and kept frozen at - 20℃. More dilute solutions of probes were prepared using 0.5 M acetate buffer (ACB, pH 4.8) containing 20 mM NaCl. More dilute solutions of targets were prepared using 5X sodium chloride sodium citrate buffer (5X SSC) as a hybridization buffer (3 M sodium chloride, 0.3 M sodium citrate, pH 7.0). Meldola’s Blue (MDB) was purchased from Sigma. MDB solutions were prepared daily in Tris-HCl buffer solution (TBS, pH 7.0) containing 20 mM NaCl.
2.3. Synthetic Oligonucleotides and Real Samples Sequences
- 20-mer oligonucleotides identical in sequence with the mitochondrial DNA at the position 3243 of tRNA Leu(UUR) gene was designed as a wild type target (WTT). A mutant target containing a single A-to-G transversion at position 11 from the 5’ end of the oligonucleotides was used as the mutant type target (MTT). Capture probes were perfect complements to WTT or MTT alleles.HPLC purified synthetic oligonucleotides sequences are: Wild type target (WTT):
 Throughout the experiment, the detection of mutation was done not only with synthetic oligonucleotides but also with real samples. In the PCR products as below, the italic parts represent the forward and reverse primers, the boldfaced parts indicate target sequences, and the underlined part shows the nucleotide where the point mutation occurs. In the nucleotide sequences below, an adenine (A) is changed to a guanine (G) in the mitochondrial DNA A3243G tRNALeu point mutation.PCR Product Sequence (from 3130 to 3423): 5’-AGG ACA AGA GAA ATA AGG CCT ACT TCA CAA AGC GCC TTC CCC CGT AAA TGA TAT CAT CTC AAC TTA GTA TTA TAC CCA CAC CCA CCC AAG AAC AGG GTT TGT TAA GAT GGC
  GCC CGG TAA TCG CAT AAA ACT TAA AAC TTT ACA GTC AGA GGT TCA ATT CCT CTT CTT AAC AAC ATA CCC ATG GCC AAC CTC CTA CTC CTC ATT GTA CCC ATT CTA ATC GCA ATG GCA TTC CTA ATG CTT ACC GAA CGA AAA ATT CTA GGC TAT ATA CAA CTA CGC AAA GGC CCC AAC GTT-3’.DNA samples were isolated from peripheral blood lymphocytes of Indonesian type-2 DM patients. The 294 bp region was amplified using two primers by the procedure of Okhubo et al.[27].
2.4. Isolation of mtDNA from Lymphocytes Cells
- Lymphocytes cell obtained by inserting 500 µL of whole blood samples into 1.5 mL Eppendorf tube, washed with TE buffer (tris-HCl 10 mM pH 8.0; EDTA 0.5 mM pH 8.0), centrifuged at 14,000 g for 1 min, at 0℃ and the supernatant was discarded. Washing was done repeatedly until a white pellet obtained. H2O and lysis buffer (consisting of Tris-HCl 50 mM pH 8.5, EDTA 1 mM pH 8.0, Tween-20 0.5%, proteinase K 0.04 mg/mL) were added to white pellets. The reaction mixture was incubated at 56℃ for 1 hour and heated at 95℃ for 5 min. After incubation, the reaction mixture was centrifuged at 12,000 g for 5 min. and then the supernatant was transferred to another tube for PCR reaction.
2.5. PCR-Allele’s Specific Amplification (PASA)
- PASA method is usually used to identify Single Nucleotide Polymorphism (SNP) and also to detect deletions, insertions and other sequence alterations. The basic principal of method relies on designing a primer that matches one of the alleles but mismatches with the 3'-end of the primer and when the one base mismatch exists near the 3' end of the PCR primer, amplification is ineffective for PASA. Eventually, preferential amplification of the perfectly matched allele is obtained. A mismatch between probe and target widely diminish the efficiency of hybridization. In PASA method, the Diabetic Reverse (DR) primer was at nucleotide positions 3300–3319 for the amplification of both wild and mutant type mtDNA. The primers for PASA analysis of the A3243G mutation are listed below. 97 bp PCR fragments were amplified by wild and mutant type forward primers and DR primers were used as internal control. Two forward primers for PCR-Allele’s Specific Amplification[14]:Wild-type sequence (3223-3243):5’- AGG GTT TGT TAA GAT GGC AGA -3’Primer for wild type A3243G (two mismatches):5’- AGG GTT TGT TAA GAT GGC
 -3’Primer for mutant A3243G (two mismatches):5’- AGG GTT TGT TAA GAT GGC
  -3’Reverse primer (3319-3300):5’-TGG CCA TGG GTA TGT TGT TA -3’(The underlined bases indicate the mismatches).PCR Conditions: The amplification conditions were 30 cycles of denaturation at 94℃ for 1 min, annealing at 62℃ for 1 min. and extension at 72℃ for 1 min, with initial denaturation at 94℃ for 5 min and final extension at 72℃ for 4 min. The PCR products were loaded on 2% agarose gel
2.6. Agarose Gel Electrophoresis
- DNA fragments were separated on 0.4 g agarose in 40 mL buffer system by electrophoresis at 75 Volt for 45 min. and detected with UV transilluminator after staining with 2 µL ethidium bromide.
2.7. Electrochemical Approach
2.7.1. Probe Immobilization
- PGEs were pretreated by applying +1.40 V for 1 min. in ACB. The capture probe was immobilized onto the pretreated PGEs for 30 min. by immersion of PGE into the ACB containing 5 µg/mL probe. After immobilization of probe to the electrodes, the probe modified PGEs were rinsed with blank ACB to remove residues.
2.7.2. Hybridization
- Hybridization with synthetic target: The probe modified PGEs were immersed in 5x SSC hybridization buffer containing 7 µg/mL synthetic WTT and MTT sequences. The hybridization was allowed for 30 min. Nonspecific adsorption was eliminated by washing the PGEs in 2x SSC for 1min. with mixing.Hybridization with PCR amplicons: The samples obtained from the PCR amplifications were diluted with 5xSSC, denatured by heating in a thermal cycler at 95℃ for 5 min and subsequent cooled in an ice bath for 1 min. The probe modified PGEs were immersed rapidly into the denaturated PCR samples. The hybridization was allowed for 30 min at room temperature. Then the electrodes were rinsed for 1 min. in hybridization buffer.The same protocol as above was also applied to probe modified PGEs for hybridization reaction with mismatch sequence, which was used instead of the target sequence.
2.7.3. Meldola’s Blue Accumulation
- After hybridization, the electrodes were immersed in TBS containing 20 µM MDB for 5 min. with stirring. Then the electrodes were rinsed with blank TBS for 10 s with mixing.
2.7.4. Voltammetric transduction
- The signal of MDB was measured by using DPV in blank TBS by scanning from + 0.20 to – 0.35 V, at modulation amplitude of 50 mV, step potential of 8 mV, step width of 80 ms, and pulse width of 50 ms. The raw data were treated using the Savitzky and Golay filter (level 2) of the General Purpose Electrochemical Software (GPES) of Eco Chemie with moving average baseline correction, using a ‘‘peak width’’ of 0.01 V.
3. Results and Discussion
- In this study, we aim to detect single point mutation at the position 3243 of tRNA leucine UUR gene. The detection involves monitoring the reduction signal of MDB, which increases in the presence of hybrid at the PGE surface due to intercalation. To obtain an efficient discrimination between full complementary target and single base mutation containing target (mismatch), hybridization conditions were properly optimized.
3.1. Assay Design
- The procedure uses a combination of electrochemical methods and PCR: (i) efficient amplification to generate sufficient wild and mutant type DNA for hybridization; (ii) hybridization with specific and sensitive probe; (iii) interaction with hybridization indicator;(iv) sensitive signal measurement for readout.The detection of interaction between MDB and DNA by using electrochemical assay and agarose gel electrophoresis techniques is illustrated in Scheme 1.
3.2. Analytical Performance of the Sensor
- The experimental parameters such as probe and target concentrations; immobilization, hybridization, accumulation, and rinsing times were explored for optimum analytical performance. The effects of probe and target concentrations on the detection of hybridization were studied at first step. For the probe concentration study, concentrations of wild and mutant type target were kept constant, and the mutant type probe concentration was increased from 1 to 10 µg/mL. After probe immobilization, the electrode surface was rinsed once with PBS to remove the unbound DNA. MDB signal increased linearly until 5 µg/mL, and then levelled off. The saturation point was taken into consideration for optimum probe concentration. It was chosen as 5 µg/mL for further experiments. The best discrimination was also obtained at the probe concentration of 5 µg/mL. The effect of target concentration on hybridization was investigated with the same way. Concentration of probe was kept constant at 5 µg/mL and the concentration of target varied from 3 to15 µg/mL. The best differentiation of the MDB signals with probe, complementary target, and single-mismatch target was observed at 7 µg/mL target concentration. After 7 µg/mL of target concentration, the MDB signal was remained almost constant. Probe immobilization and hybridization times were varied from 10 to 60 min, and the best differentiation of the MDB signals was observed with 20 min probe immobilization and 30 min hybridization time respectively. The effect of rinsing duration after hybridization was tested to see if it affects the detection of mtDNA mutations or not. The duration of the rinsing was changed from 10 to 60 s. 1 min. was chosen as the optimum time in order to obtain better discrimination between target and mismatch oligonucleotides. According to our previous studies[28], the MDB concentration was chosen as 20 µM and the interaction time was set to 5 min. for further experiments. Our data showed that the optimization of experiment influenced the selectivity of the designed biosensor.
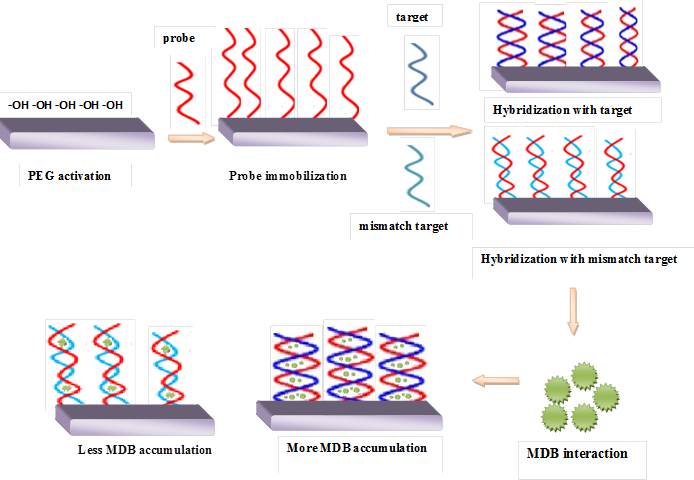 | Scheme 1. Schematic steps for the detection of DNA A3243G tRNALeu mutation by using Meldola’s Blue as a hybridization indicator |
3.3. Hybridization Detection with Synthetic Oligonucleotides
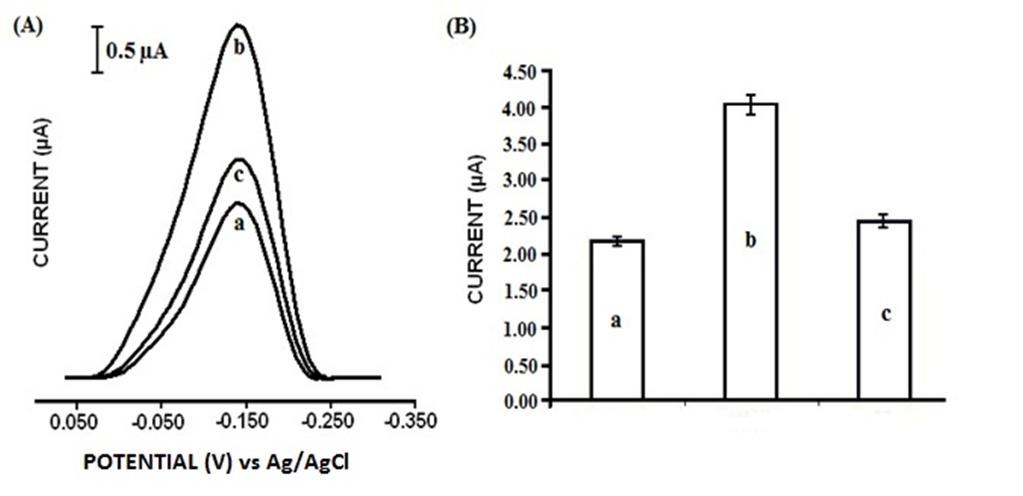 | Figure 1. Differential pulse voltammograms (A) and histograms with error bars (B) of MDB with synthetic oligonucleotides on PGEs with MTP (a), after hybridization with complementary target (MTT) (b), and after hybridization with single-mismatch target (WTT) (c). Experimental conditions were as follows: PGE pretreatment, at +1.4 V in ACB for 1 min; Probe immobilization,5 µg/mL MTP in ACB for 30 min; Hybridization, 7 µg/mL MTT and WTT in 5X SSC for 30 min; MDB binding, 20 µM MDB in TBS for 5 min; Measurement, + 0.20 V to – 0.35 V in TBS using DPV. The curve of I (µA) vs. E (V) |
 | Figure 2. Differential pulse voltammograms for the MDB signals of MTP modified PGEs (a), after hybridization with the synthetic 100% WTT (b), after hybridization with the synthetic 5% (c) 10% (d), 50% (e) and 100% (f) MTT sequences. Experimental conditions were the same as those described in Fig.1 |
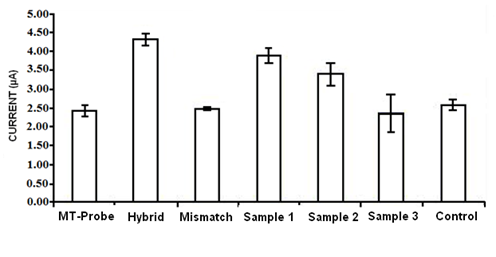 | Figure 3. Histograms with error bars of the DPV signals of MDB. The working electrode was modified with mutant type probe (MTP), hybrid (MTP-MTT), mismatch (MTP-WTT), Sample 1, 2, 3 (MTP-PCR amplicons) and control (negative PCR amplicon) |
3.4. Hybridization Detection with Real Samples
- An aliquot of the amplified amplicon was simply diluted in the hybridization buffer and then introduced onto the mutant type probe immobilized electrode. Histograms were based on five repetitive measurements on MDB signals using DNA modified PGEs. Control samples were negative PCR amplicons which belonged to the non-diabetes mellitus test subjects. The current values for mutant type probe, hybrid and mismatch were 2.48 µA, 4.42 µA and 2. 43 µA respectively. The voltammetric signal of mismatch (mutant type probe and wild type target) was approximately half of the hybrid (mutant type probe and mutant type target) and it was nearly same with the mutant type probe. The response of mismatch proved that there was no interaction between mutant type probe and wild type target. The higher signals were obtained from samples 1 and 2 than mismatch referred to there was interaction between mutant type probe and these amplicons. It is possible that these samples belonged to patients who had A to G transversion. The signal obtained from sample 3 was the same as the probe and mismatch signals, demonstrating that there was no interaction between mutant type probes and this amplicon. This data referred to sample 3 belongs to the person who doesn't have this mutation. Our analysis leads to the following results; sample 1 belongs to a patient who is MIDD, sample 2 is MID, and sample 3 is type 2 DM. In order to investigate the detection efficiency of the designed DNA biosensor, the probe was hybridized with a non-complementary oligonucleotide to assess whether the suggested DNA sensor responds selectively to the complementary DNA (control; as a negative amplicon). As depicted in Fig. 3, the current of the accumulated MDB signal obtained from control amplicon was nearly the same with the probe as a proof of no hybridization. According to the results in Fig.3, mismatch and sample 3 signals were nearly the same with mutant type probe which means no hybridization occurred. This shows that the assay is specific to the mutation of interest and is an easy way to determine the associated mutation in clinical trials.Relative standard deviation values ofprobe-complementary target, probe-mismatch target, probe-Sample 3 and probe-control were 6.1 %, 1.6 % 16.7 % 8.2% respectively. The minimum detection limit of mtDNA A3243G mutation was found 0.75 µg/ml corresponds to 2.35 % heteroplasmic mutation at PGE.
3.5. Electrophoresis of Real Samples
- The electrochemical detection system in combination with Autolab device has several advantages such as portability and rapidity. The most important features of electrochemical sensing, electrochemical reactions give fast and direct electronic output, which makes the transducer particularly compact and relatively inexpensive. We compared the electrochemical biosensor results with agarose gel electrophoresis. Agarose gel electrophoresis is a standard method that separates DNA fragments according to their molecular sizes. In this method the intensity of UV-induced fluorescence emission causing ethidium bromide (EtBr) as an intercalating dye is quantified. Traditionally, PCR amplicons are detected by agarose gel electrophoresis which takes minimum 30 min to 1 h, utilizes toxic (ethidium bromide) and expensive agents (SYBR green dye, TaqMan, or molecular beacons). Therefore, our aim was to eliminate agarose gel electrophoresis step. In this respect, designed electrochemical biosensor results were compared with agarose gel results. For this purpose, the samples were loaded onto agarose wells and then electrophoresis was performed. The forward primers for PASA analysis of the A3243G mutation are 5’- AGG GTT TGT TAA GAT GGC AGA -3’ and 5’- AGG GTT TGT TAA GAT GGC TCG -3’. A mismatch at the penultimate nucleotide position of the mutation site was introduced in the forward primers to increase the specificity of the PASA reaction. Nevertheless, the specificity was not sufficient, and there were background signals at 0% mutant. Three mismatches at 5’ site were then introduced (5’- AGG GTT TGT TAA GAT GGC TCG -3’), which greatly improved the specificity. At the mutation site, the wild-type primer containing an “A” would perfectly match with the wild type amplicon. Similarly, the mutant primer containing a “G” would be a perfect match with the mutant type amplicon but would be a weak “GT” mismatch with the wild-type. The detection sensitivity has increased as a consequence of having “CC” mismatch at the penultimate nucleotide[14]. The PASA products amplified by wild-type, mutant forward and reverse primers were 97 bp in length. Fig. 4 in lane 2 and 4 shows that MIDD and MID samples contained A3243G mutation respectively. Whereas, type-2 DM and control samples did not include A3243G mutation based on the negative results in lane 6 and 8. These data indicated that MIDD and MID patients posses A3243G mutation, which contain both mutant and wild type mtDNA together in their cells. It supported the biosensor results that shown in Fig. 3. Sample 1 was maternally inherited diabetes and deafness (MIDD), sample 2 was maternally inherited diabetes (MID), sample 3 was type-2 diabetes mellitus in Fig. 3. The results obtained from the gel electrophoresis were in good agreement with the ones obtained from the electrochemical DNA biosensor.
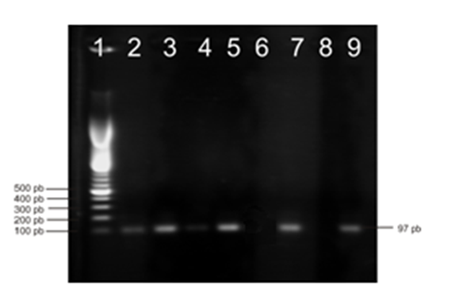 | Figure 4. Agarose gel electrophoresis of MIDD (lane 2 and 3), MID (lane 4 and 5), type-2 DM (lane 6 and 7), and non-DM samples (lane 8 and 9) using PASA method. For lanes 2, 4, 6, and 8 mutant type, and lanes 3, 5, 7, and 9 wild type primers were used. Lane 1 indicates the DNA size marker (100 base pair) |
4. Conclusions
- This procedure could be used for quantitative analysis of heteroplasmy mutation on mtDNA and also eliminates the agarose gel electrophoresis step. The reduction signal of MDB on graphite electrode could even be observed in the presence of microgram level of target DNA. The constructed biosensor assay has several advantages such as being accurate, reproducible and user-friendly when compared to agarose gel electrophoresis. The preparation step of the samples was the same as the agarose gel electrophoresis approach. The agarose gel electrophoresis measurement step typically takes about 30 minutes. However, in comparison our measurement step takes less than 1 minute. Additionally, in our designed system, toxic agents were not used while agarose gel needs ethidium bromide. The duration of the whole procedure is about 1 h, which is promising in comparison with conventional methods to detect this mutation. The reliable measurement of heteroplasmy level of mtDNA mutations in different tissues and organs may pull through individuals who are at risk of developing complications. Even with the biosensor system, prenatal and postnatal genetic testing may be possible due to the monitoring the mutation in heteroplasmy. Future work in this laboratory will focus on the design of electrochemical microarray systems for detection of target sequences directly from plasma samples without any prior PCR amplification step.
ACKNOWLEDGEMENTS
- Authors acknowledge the financial support from the IMHERE Project Padjadjaran University (IBRD No.4789-IND & IDA No. 4077-IND) and Research Grant from Hibah Bersaing DIKTI Indonesia. We are also grateful to Malalayang Hospital Manado and Cipto Mangunkusumo Hospital Jakarta.