-
Paper Information
- Next Paper
- Previous Paper
- Paper Submission
-
Journal Information
- About This Journal
- Editorial Board
- Current Issue
- Archive
- Author Guidelines
- Contact Us
Advances in Analytical Chemistry
p-ISSN: 2163-2839 e-ISSN: 2163-2847
2013; 3(A): 14-19
doi:10.5923/s.aac.201307.03
Synthesis and Preliminary Studies of Poly(2-vinyl-4,6-diamino -1,3,5-triazine) Nanoparticles: Application in Whole Blood Glucose Biosensors
 Abstract
 Reference
 Full-Text PDF
 Full-text HTML
Zuifang Liu1, Louise Simpson2, Marco F Cardosi2
1School of Chemical and Environmental Engineering, Hubei University of Technology, Wuhan, P R China
2LifeScan Scotland Limited, a Johnson and Johnson company, Beachwood Business Park North, Inverness, IV2 3ED, UK
Correspondence to: Marco F Cardosi, LifeScan Scotland Limited, a Johnson and Johnson company, Beachwood Business Park North, Inverness, IV2 3ED, UK.
| Email: |  |
Copyright © 2012 Scientific & Academic Publishing. All Rights Reserved.
Poly(2-vinyl-4,6-diamino-1,3,5-triazine) (polyVDAT) nanoparticles were synthesized by semi-batch emulsifier-free emulsion polymerization using 2,2'-azobis(2-methylpropionamidine) di-hydrochloride (V-50)as an ionic initiator. The synthesized nanoparticles had dual size populations of around 100 nm and 250 nm in diameter, respectively. A purified dispersion of the nanoparticles in water was stable at room temperature due to the high surface charge (zeta potential 61.1 mV) of the particles. The synthesized polyVDAT nanoparticles demonstrated rapid adsorption of uric acid in PBS (pH 7.4). The nanoparticles could be incorporated into an enzyme ink and fabricated into screen-printed glucose biosensors. When tested with whole blood spiked with increasing levels of uric acid, the sensors which had nanoparticles incorporated into the enzyme ink layer showed less interference from uric acid than the control sensors.
Keywords: Uric Acid, Glucose Sensor, SMBG, Nanoparticle, PolyVDAT
Cite this paper: Zuifang Liu, Louise Simpson, Marco F Cardosi, Synthesis and Preliminary Studies of Poly(2-vinyl-4,6-diamino -1,3,5-triazine) Nanoparticles: Application in Whole Blood Glucose Biosensors, Advances in Analytical Chemistry, Vol. 3 No. A, 2013, pp. 14-19. doi: 10.5923/s.aac.201307.03.
Article Outline
1. Introduction
- Glucose biosensors have been an avenue of important electrochemical research, since the development of the first glucose sensor by Clark and Lyons in 1962[1]. Subsequently, much emphasis has been on miniaturising the sensors, introducing electron transfer mediators, and removing electrochemical interferents such as ascorbic acid, uric acid (UA) and paracetamol[2]. Because of increasing legislation aimed at improving the accuracy of devices used for self monitoring of blood glucose (SMBG) by diabetic patients (e.g. ISO 15197:2003 standard guidelines which state that the minimum acceptable system accuracy for SMBG devices requires that ≥ 95% of the individual glucose results must fall within ± 15 mg/dL of the results of the reference method at glucose concentration < 75 mg/dL and within ± 20% at glucose concentrations ≥ 75 mg/dL[3]). A new standard with more stringent criteria (ISO 15197:2011) is being discussed and planned requirements are that ≥ 95% of the glucose meter (GM) results must fall within ± 15 mg/dL of the results of the reference method at glucose concentration < 100 mg/dL and within ± 15% at glucose concentrations ≥ 100 mg/dL[4,5]. Consequently, the need to produce systems which are not sensitive to common endogenous and exogenous interfering substances found in blood continues to be important.There are two primary methods used in commercial sensors for eliminating these interferents; i) the use of an electron transfer mediator which is active at a potential lower than the oxidation potential of the antioxidants, e.g. ruthenium(III) hexamine[6,7] and ii) the use of a “dummy or naked electrode” together with a suitable algorithm that subtracts the effect of the interferent from the analytical signal resulting in an accurate estimate of the glucose concentration in the blood sample[8]. A particularly troublesome interferent in this context is UA. UA is the sole end product of purine degradation in the human body, arising from metabolic abnormalities that lead to overproduction of purine nucleotides. UA is symptomatic of various diseases including gout, Lesch-Nylan syndrome, hyperuricemia and hyperuriceria, leukaemia and pre - eclampsia. It also occurs from the destruction of tumour cells in cancer patients producing degraded nucleic acids, which are then further metabolised to urate[9]. It is present in human plasma as the mono-anion urate and at levels of 200 – 500
 . UA can interfere with glucose measurements through its direct oxidation at the electrode surface[9,10,11] and by interacting with the ferricyanide mediator[12] which is a common component present in many commercially available glucose biosensors.In recent years, poly (2-vinyl-4,6-diamino-1,3,5-triazine) has attracted increasing attention due to its capability of selective adsorption of nucleic acid bases, nucleotides and nucleosides through formation of strong hydrogen bonding between the 4,6-diamino-1,3,5-triazine functionality and the target molecules in aqueous solutions[13,14] thus making it a potentially useful molecule to reduce uric acid interference in electrochemical biosensors. This is shown schematically in Figure 1.
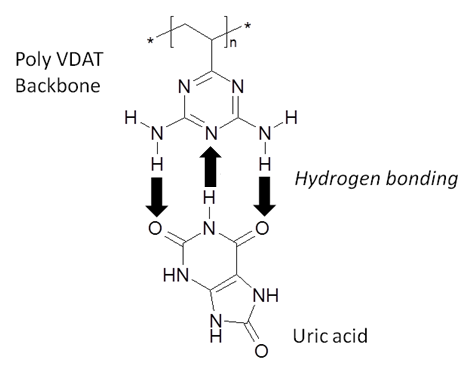 | Figure 1. Schematic representation showing UA bound to the PolyVDAT backbone via 3 hydrogen bonds |
2. Experimental
- All materials used were of the highest grade available and used without further purification. All solutions and subsequent dilutions were prepared using doubly distilled deionised (DDI) water. All buffered solutions and electrochemical measurement solutions were prepared in phosphate buffered saline solution (PBS) buffered to pH 7.4. Prior to use, the glassy carbon electrode was polished using alumina slurry and polishing cloth (BASi, West Lafayette, IN 47906 USA) and then cleaned by ultrasonication in distilled water. Electrochemical measurements were conducted using a
 -Autolab type-II potentiostat (EcoChemie, Utrecht, Netherlands). Measurements were generally carried out using an initial cell volume of 10 mL at a temperature of 20 ± 2°C. For general measurements a glassy carbon working electrode (3mm diameter, BAS Technicol, UK), a Pt wire counter electrode and a silver-silver chloride reference electrode (3 M KCl, BAS Technicol, UK) were used.
2.1. Synthesis and Characterisation of PolyVDAT Poly(2-vinyl-4,6-diamino-1,3,5-triazine) Nano Particles
- The synthesis was conducted in a 1.0 litre round-bottom glass reactor equipped with a mechanical U-shape glass stirrer driven by an overhead (Heidolph RZR2041), nitrogen inlet and outlet, a condenser, two liquid feed inlets which were connected via a multi-channel peristaltic pump (Ismatec) to two 250 mL round bottom flasks which were both equipped with nitrogen inlets and outlets. The reactor sat in a thermostatically controlled heating mantle (Electromantle MC810, Electrothermal) of which a temperature probe was fixed to the reactor in a way that the probe was subsurface of the reaction mixture throughout the course of reaction. For a typical synthesis, 10.0 g VDAT (TCI America) and 0.1 g 2,2'-azobis(2-methylpropionamidine) di-hydrochloride, V-50, (Acros Organics) were dissolved in 120 mL dimethylsulfoxide (DMSO) and 120 mL DDI water, respectively in the two flasks, and 400 mL DDI water was charged to the reactor under mechanical agitation of around 200 rpm. The temperature controller of the heating mantle was set to 70C and the electronic power was switched on to start heating. At the same time, nitrogen flow was applied to the reactor and the two flasks for about one hour. After that, the peristaltic pump was switched on to continuously feed the VDAT solution and V-50 aqueous solution from the two flasks at a feeding rate about 0.35 mL/min, and reaction time recording was started. Samples of about 1.0 mL each were drawn from the reactor at varied reaction time intervals by using a 5.0 mL glass syringe and immediately added to individual 5.0 mL tubes (Eppendorf) which were closed, shaken and then stored in a fridge at about 4C before characterization. After the feedings were completed, the reaction continued for about a further 16 hours. Finally, the crude product was collected and purified by dialysis in dialysis tubing (Sigma-Aldrich, D9777) against DDI water for one week with daily change of water.Laser diffraction measurements (Malvern, Matersizer 2000) were conducted for particle characterization. Volume size distribution profiles of the polyVDAT nanoparticle samples at varied polymerization time are shown in Figure 2 and the corresponding mean particle sizes and span values are listed in Table 1.
|
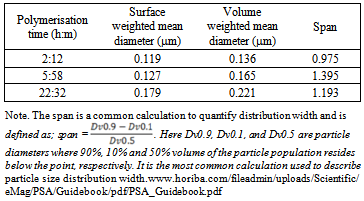
 | Figure 2. Volume size distribution profiles of polyVDAT nanoparticle at polymerization time of A. 2h12m, B. 5h58m, C. 22h32m |
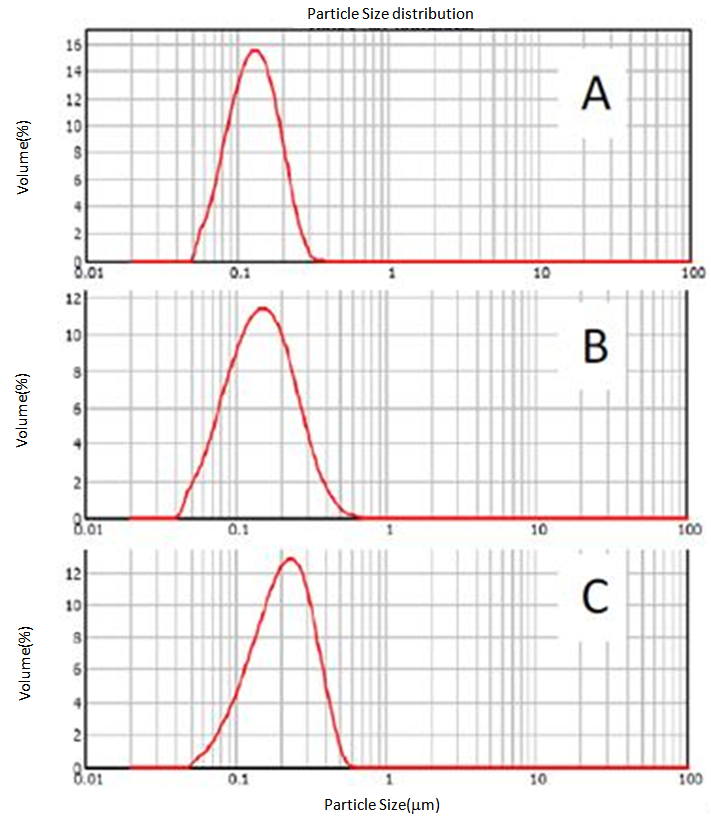
 | Figure 3. SEM images of the polyVDAT nanoparticles at polymerization time of A. 2h12m, B. 5h58m, C. 22h32m, and D. purified sample |
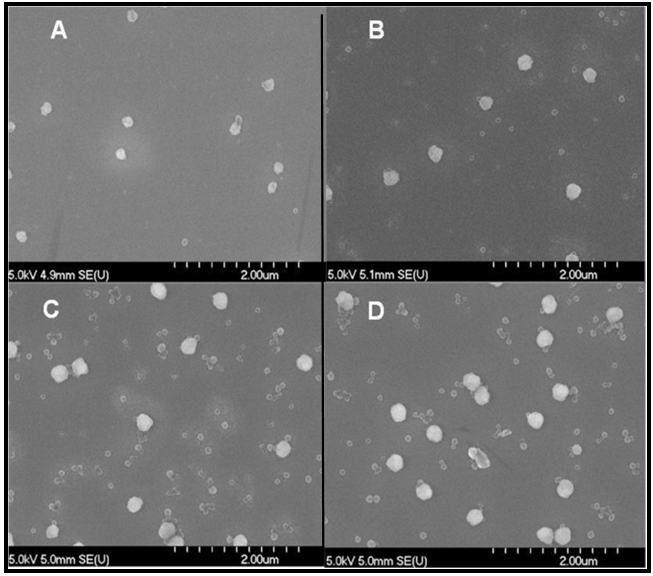
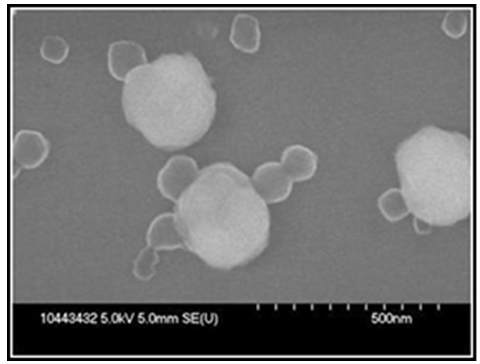 | Figure 4. SEM image of the purified polyVDAT nanoparticles corresponding to panel D, Figure 2 above |
2.2. Electrochemical Characterisation of UA Binding to the Synthesised Nanoparticles
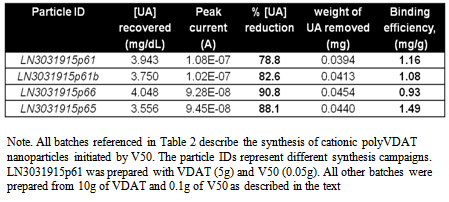
- The binding properties of the nanoparticles were tested in PBS (pH 7.4). A UA calibration was first established by adding aliquots of UA to the PBS and performing a linear scan from 0 to 0.65 V vs. Ag/AgCl at a scan rate of 0.02 V/s. Linear calibration curves were obtained over the range 0 – 10 mg/dL UA with a slope of 3.3 x 10⁻⁸ A.dL/mg. The oxidation peak was recorded at approximately 0.38V vs. Ag/AgCl (see Figure 5). To establish the scavenging efficiency a 2 mL dispersion sample was first centrifuged in a pre-weighed safe-lock tube and the upper clear layer of water removed. A 1mL sample of PBS was then added as a wash to the remaining suspension and mixed thoroughly. The upper clear layer of PBS was then removed after centrifugation leaving the nanoparticles and residual PBS. (The PBS wash step ensures that any residual liquid in the particles post-centrifugation is PBS and not water.) The sample, including the safe-lock tube, particles and residual PBS, were then weighed and recorded. Next a 1 mL aliquot of the UA stock solution, 10 mg/dL (used in the calibration) was added to the nanoparticles and mixed thoroughly for 30 seconds and immediately followed by centrifugation. A 0.5 mL aliquot of the UA solution from the upper clear layer was added to 9.5 mL PBS and kept under agitation for ~10 seconds prior to the linear scan. A linear scan was performed at the same settings and conditions as the UA calibration, discussed previously. The sample was then dried in the opened safe-lock tube at 70ºC until a constant weight as observed and recorded.
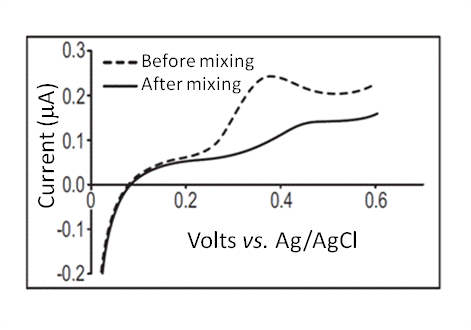 | Figure 5. Linear sweep voltammograms showing the effect on the UA oxidation peak in PBS to the addition of PolyVDAT nanoparticles. The dashed voltammogram shows the LSV for 0.5 mg/dL UA in PBS. The solid line shows the resultant voltammogram following the addition of nanoparticles |
|
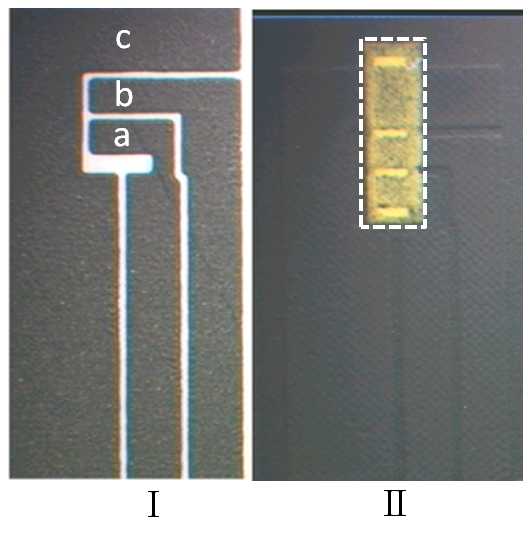 | Figure 6. Examples of commercially manufactured screen printed carbon electrodes (I). These sensors have two glucose detecting electrodes (a and b) and a carbon pseudo-reference electrode (c). II shows the electrode elements after they have been modified by the screen printed glucose sensitive reagent (yellow area highlighted by the white dotted rectangle) and overprinted with a non-conductive insulation layer. The polyVDAT nano particles are then applied directly to the enzyme pad as described in the text |
2.3. Manufacture of Glucose Enzyme Electrodes Incorporating PolyVDAT Nanoparticles
- For the manufacture of the prototype glucose sensors, mass production screen printed base carbon electrodes[16] were used as the transducers (Figure 6).A propriety glucose specific ink (glucose oxidase/ potassium ferricyanide)[17] was then applied to the carbon base electrodes by screen printing and subsequently air dried using an air force high temperature conveyor drier (Natgraph Ltd., Nottingham NG6 8WA). Once the reagent layer had dried, polyVDAT nanoparticles were applied by spray coating a solution of polyVDAT suspension (in DDI water) containing 0.5% w/w Pluronic P-130 surfactant using the Biodot AD3050 liquid dispenser (Biodot, Irvine, CA 92606). The glucose response of the sensors was assessed using blood from a healthy volunteer (normal haematocrit: 39-42%) which had been “spiked” with standard glucose solution to an upper value of 25 mM (450 mg/dL). The 5 second current response (the normal measurement time for the OneTouch Ultra® family of test meters[18]) resulted in a linear calibration (R² = 0.997) with the following regression parameters: current (
 A) = 0.011x + 0.57, N = 3 glucose levels, 8 repeat measurements per level (not shown). The plasma glucose concentration in the blood samples was verified using a Yellow Springs Instrument 2300 blood glucose analyser, Yellow Springs, OH45387.
3. Results and Discussion
- In order to assess the UA interference on test strips containing polyVDAT nanoparticles and control strips, blood from a healthy volunteer (45% haematocrit, 72 mg/dL basal plasma glucose, 5.4 mg/dL basal UA) was “spiked” with varying levels of UA (final UA plasma concentrations were verified using the ILab Aries – Clinical Chemistry System, Instrumentation Laboratory, Warrington, Cheshire WA3 7PB. The blood samples were then tested using the glucose test strips (8 repetitions for each UA level) and the resulting 5 second current output from the meter interpolated as a glucose reading value using the calibration equation described in 2.3. The effect of the interference, the difference between the meter glucose value and the “true glucose value” (measured on the YSI 2300) is calculated and expressed as a percentage (% Bias to reference).Prior to testing in whole blood, the sensitivity of the two strip types (control and polyVDAT modified) was assessed using PBS pH 7.4 solution containing 50 mg/dL glucose. This is shown below in Figure 7.
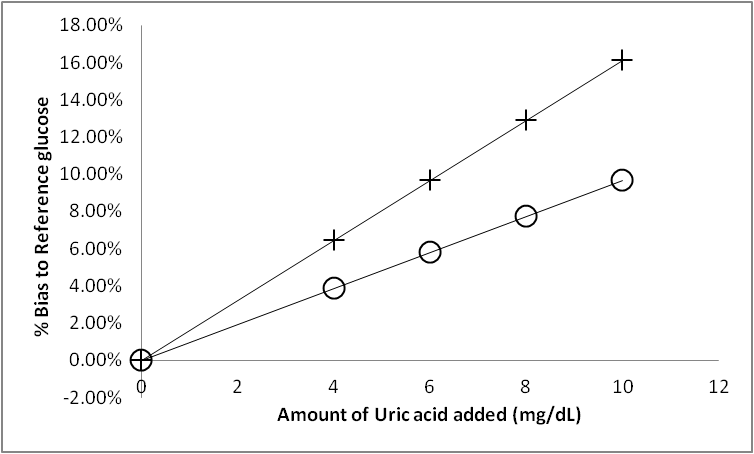 | Figure 7. Sensitivity of the glucose test strips to UA expressed in terms of %Bias to the reference glucose value. The crosses represent the control strips (no polyVDAT nanoparticles) and the open circles, strips with nanoparticles. Data obtained in PBS pH 7.4 solution containing 120 mg/dL  -D-glucose -D-glucose |
References
| [1] | Clark Jr, L. and C. Lyons, Electrode systems for continuous monitoring in cardiovascular surgery. Ann N Y Acad Sci, 1962, 102, 29-45. |
| [2] | Wang, J., Glucose biosensors: 40 years of advances and challenges. Electroanalysis, 2001, 13(12), 983-988. |
| [3] | DIN EN ISO 15197: In vitro diagnostic test systems - Requirements for blood-glucose monitoring systems for self-testing in managing diabetes mellitus (ISO 15197:2003). European Committee for Standardization, Brussels, 2003 |
| [4] | In vitro diagnostic test systems - Requirements for blood-glucose monitoring systems for self-testing in managing diabetes mellitus (draft). DIN EN ISO 15197:2011. |
| [5] | Klonoff DC. The food and drug administration is now preparing to establish tighter performance requirements for blood glucose monitors. J Diabetes Sci Technol 2010, 4, 499-504. |
| [6] | Morris N.A., Cardosi, M.F., Birch, B.J. & Turner, A. P. F. An electrochemical capillary fill device for the analysis of glucose incorporating glucose oxidase and ruthenium (III) hexamine as mediator, Electroanalysis, 1992, 4(1), 1-9 |
| [7] | Cardosi, M.F., Mills, L and Leach, C.P. A Reagent Formulation using Ruthenium Hexamine as a Mediator for Electrochemical Test Strips, European patent EP2084292 B1. |
| [8] | Bailey T, Chang A, Rosenblit PD, Jones L, Teft G, Setford S, Mahoney J. A comprehensive evaluation of the performance of the test strip technology for OneTouch Verio glucose meter systems, Diabetes Technol. Ther., 2012, 14(8), 701-9 |
| [9] | Dutt, J.S.N., Livingstone, C., Cardosi, M.F., Wilkins, S.J. & Davis, J.A. Clinical Assessment of Direct Electrochemical Urate Measurement, Talanta, 2006, 68, 1463-1468 |
| [10] | Phair, J., Newton, L., McCormac, C., Cardosi, M.F., Leslieb, R. & Davis, J. A disposable sensor for point of care wound pH monitoring, Analyst, 2011, 136, 4692-95 |
| [11] | Dutt, J.S.N., Cardosi, M.F., Wilkins, S., Livingstone, C., & Davis, J., Characterisation of Carbon Fibre Composites for Decentralised Biomedical Testing, Mat. Chem. Phys., 2006, 97, 267-272 |
| [12] | Agrawal, A., Sharma, N., Mishra, S.K., & Sharma, P.D. Kinetics and Mechanism for the oxidation of Uric acid by hexacyanoferrate (III) in acetate buffers, Transition Met. Chem., 1992, 17, 547-551 |
| [13] | Asanuma, H., Gotoh, S., Takeshi B., & Makoto K., Absorption of Uric Acid Derivatives in Water by Poly(vinyldiaminotriazine) through Hydrogen Bonding, Chem. Lett., 1996, 25(8), 681-682 |
| [14] | Asanuma, H., Ban, T., Gotoh, S., Hishiya, T. Komiyama, M. Precise Recognition of Nucleotides and their Derivatives through Hydrogen Bonding in Water by Poly (vinyldiaminotriazine), Supramolecular Sci., 1998, 5, 405-410 |
| [15] | Liu, Z., Xiao, H., Soap-free emulsion copolymerisation of styrene with cationic monomer: effect of ethanol as a co-solvent, Polymer, 2000, 41 7023–7031 |
| [16] | Davies, O. W.H., Leach, C.P. & Alvarez-Icaza, M. Measurement of Substances in Liquids US Patent 7,250, 105 B1 |
| [17] | McAleer, J.F., Alvarez-Icaza, M., Hall, G., Plotkin, E.V., Scott, D., & Davies, O.W.H., Disposable Test Strips with Integrated Reagent/Blood Separation Layer, US Patent 7,807,031 B2 |
| [18] | Liu, Z., & Cardosi, M.F., Electrochemical Measurement of Blood Glucose for Diabetic Patients, In: “Advances in Medicine and Biology, Volume 25, (2011) Editor; Leon V. Berhardt, pp 1- 39 |
| [19] | Walsh J, Roberts R, Vigersky R, et al. New Criteria for Assessing the Accuracy of Blood Glucose Monitors Meeting, October 28, 2011. J Diabetes Sci Technol (2012) 6, 466-74. |