-
Paper Information
- Next Paper
- Previous Paper
- Paper Submission
-
Journal Information
- About This Journal
- Editorial Board
- Current Issue
- Archive
- Author Guidelines
- Contact Us
Advances in Analytical Chemistry
p-ISSN: 2163-2839 e-ISSN: 2163-2847
2013; 3(A): 9-13
doi:10.5923/s.aac.201307.02
Theory of Square-Wave Voltammetry for a Dissolved Redox Couple
 Abstract
 Reference
 Full-Text PDF
 Full-text HTML
Šebojka Komorsky-Lovrić, Milivoj Lovrić
Department of Marine and Environmental Research, “Rudjer Bošković” Institute, P.O. Box 180, HR-10002 Zagreb, Hrvatska (Croatia)
Correspondence to: Milivoj Lovrić, Department of Marine and Environmental Research, “Rudjer Bošković” Institute, P.O. Box 180, HR-10002 Zagreb, Hrvatska (Croatia).
| Email: |  |
Copyright © 2012 Scientific & Academic Publishing. All Rights Reserved.
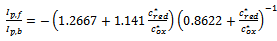
A determination of the composition of dissolved mixture of reduced and oxidized forms of an electroactive compound by square-wave voltammetry is investigated theoretically. If electrode reaction is reversible, the sum of concentrations of these species can be measured by the standard addition method, while the ratio of their concentrations can be calculated from the ratio of the peak currents of the components of the response. If the transfer of electrons is kinetically controlled and the reduction and oxidation appear totally irreversible at the highest frequency, the concentrations of reactant and product may be measured separately.
Keywords: Square-wave Voltammetry, Theory, Redox Couple
Cite this paper: Šebojka Komorsky-Lovrić, Milivoj Lovrić, Theory of Square-Wave Voltammetry for a Dissolved Redox Couple, Advances in Analytical Chemistry, Vol. 3 No. A, 2013, pp. 9-13. doi: 10.5923/s.aac.201307.02.
1. Introduction
- In the analytical application of square-wave voltammetry it is usual that only the reactant of a certain electrode reaction is present in the solution initially[1 - 6]. However, in some cases both oxidized and reduced forms of the analyte may exist in the sample[7 - 10]. Some examples are solutions of anions and dianions of polysulfide[11], arsenite, arsenate[12, 13], iodide[14] and iodate ions[15, 16], compounds containing quinone and hydroquinone moieties[17, 18], various iron-based redox species[19, 20], peroxone[21], oxidized and reduced glutathione[22] and NADH/NAD+ redox couple[23]. In the theory of square-wave voltammetry the presence of the product of electrode reaction was considered in the instances of reverse scan direction[24] and the use of equilibrium potential as the starting one[25]. In this paper the problem of speciation is addressed.
2. The Model
- A simple electrode reaction is considered:
 | (1) |
 | (2) |
 | (3) |
 | (4) |
 | (5) |
 | (6) |
 | (7) |
 | (8) |
 | (9) |
 | (10) |
 is square-wave frequency. The solution is a dimensionless current: Φ = I(nFSc*ox)1(Df)½. A positive net response is defined as: -ΔΦ = -(Φf – Φb), where Φf and Φb are forward and backward components of the response. Square-wave voltammetric excitation signal is defined by the pulse amplitude (ESW), the scan increment (dE) and the starting potential (Est)[1-3]. The influences of low supporting electrolyte concentration, such as IR drop, migration and double layer effect on the charge transfer rate, are not considered. The calculations were performed by the Microsoft Quick Basic program.
3. Results and Discussion
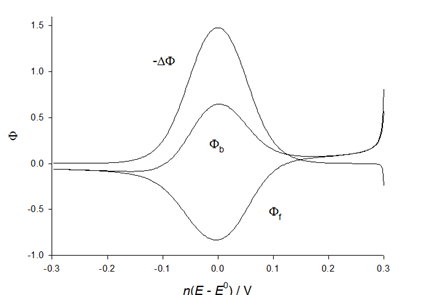 | Figure 1. Theoretical square-wave voltammogram of reversible electrode reaction (1); c*ox = c*red , ESW = (50/n) mV, dE = -(2/n) mV and Est = (0.3/n) V vs. E0. The dimensionless net response (-ΔΦ) and its forward (Φf) and backward (Φb) components are shown |
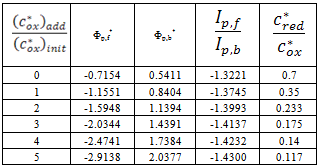
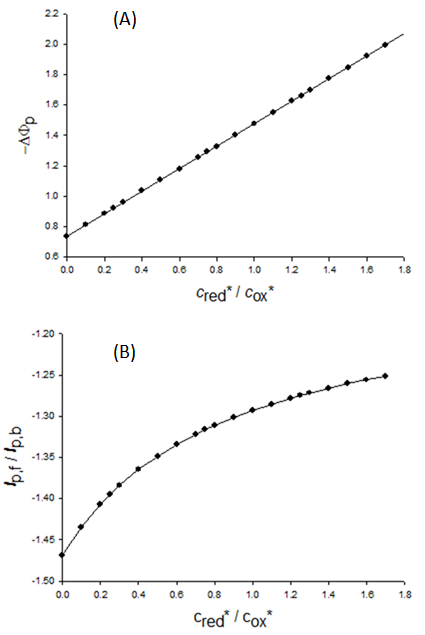 | Figure 2. The dependence of dimensionless net peak current (A) and the ratio of peak currents of the forward and backward components (B) on the ratio of bulk concentrations of the product and the reactant. All data are as in Fig. 1 |
 | (11) |
 | (12) |
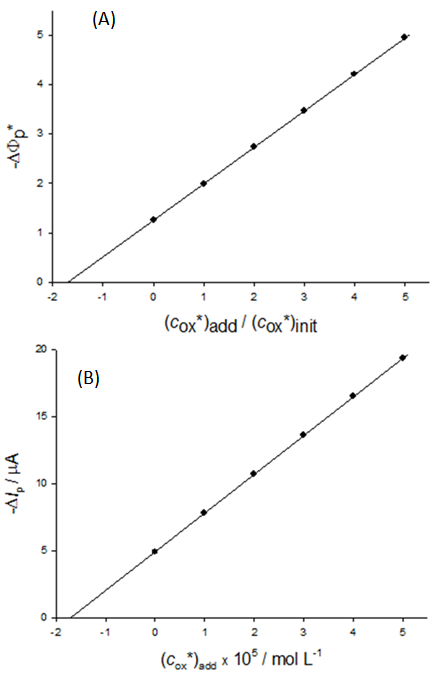 | Figure 3. A simulation of the standard addition method. The dependence of dimensionless (A) and real (B) net peak current on the dimensionless (A) and real (B) concentration of reactant that is added to the sample. (c*ox)init = 1×10⁻⁵ mol L-1, (c*red)init = 7×10⁻⁶ mol L-1, n = 1, F = 96485 C mol-1, S = 0.1 cm2, D = 9×10⁻⁶ cm2 s-1, f = 100 s-1, ESW = 50 mV, dE = -2 mV and Est = 0.3 V vs. E0 |
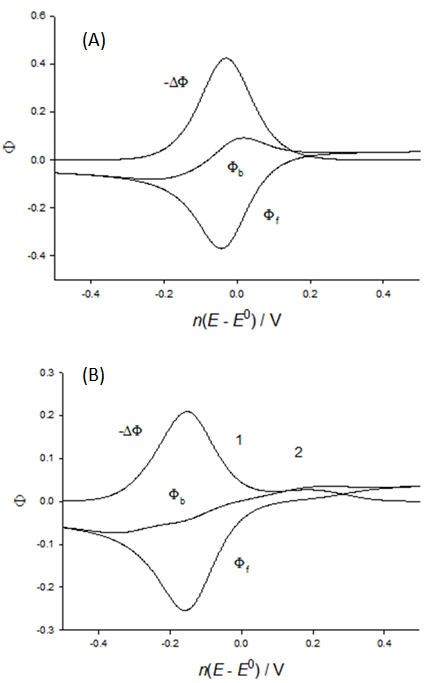 | Figure 4. Theoretical square-wave voltammograms of electrode reaction (1) that is controlled by the charge transfer kinetics; κ = 0.1 (A) and 0.01 (B), α = 0.5, c*ox = c*red, nESW = 50 mV, ndE = -2 mV and nEst = 1 V vs. E0 |
4. Conclusions
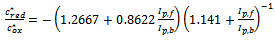
- The linear relationship between the net peak current and the sum of concentrations of the reactant and product of reversible electrode reaction enables the determination of total content of an analyte in the sample. The ratio of concentrations of reduced and oxidized forms of this substance can be calculated from the ratio of peak currents of the forward and backward components of the response. If electrode reaction is controlled by the charge transfer kinetics, the reduction and oxidation processes may appear totally irreversible at the highest frequency. The net peak current of irreversible reduction depends only on the concentration of the reactant, which means that the redox composition of the analyte can be determined by separate measurements of the reactant and product concentrations.
References
| [1] | V. Mirčeski, Š. Komorsky-Lovrić, M. Lovrić, Square-wave voltammetry, Springer, Berlin, 2007. |
| [2] | J. Osteryoung, J. O'Dea, Square-wave voltammetry, in: A.J. Bard (Ed.), Electroanalytical Chemistry, Vol. 14, Marcel Dekker, New York, 1986, p. 209. |
| [3] | J.J. O'Dea, J. Osteryoung, R.A. Osteryoung, Theory of square-wave voltammetry for kinetic systems, Anal. Chem. 53 (1981) 695. |
| [4] | G.N. Eccles, Recent advances in pulse, cyclic and square-wave voltammetric analysis, Crit. Rev. Anal. Chem. 22 (1991) 345. |
| [5] | R.A. Brookes, R.G. Compton, Simulation of square-wave voltammetry: quasi-reversible electrode processes, J. Phys. Chem. B 103 (1999) 9020. |
| [6] | D. de Souza, L. Codognoto, A.R. Malagutti, R.A. Toledo, V.A. Pedroso, T.R.S. Oliverira, L.H. Mazo, L.A. Avaca, S.A.S. Machado, Square-wave voltammetry. Second part: applications, Quim. Nova 27 (2004) 790. |
| [7] | A. Demortier, C. Jehoulet, Digital simulation of cyclic voltammetric curves when the oxidized and the reduced form of a redox couple are present in solution, J. Electroanal. Chem. 283 (1990) 15. |
| [8] | J.W. Weidner, P.S. Fedkiw, Reversible linear-sweep voltammetry of a soluble redox couple: effect of initial concentrations, Anal. Chem. 62 (1990) 875. |
| [9] | A.M. Keitghtley, J.C. Myland, K.B. Oldham, P.G. Symons, Reversible cyclic voltammetry in the presence of product, J. Electroanal. Chem. 322 (1992) 25. |
| [10] | C. Serna, A. Molina, General solutions for the I-t response for reversible processes in the presence of product in a multipotential step experiment at planar and spherical electrode whose areas increase with any power of time, J. Electroanal. Chem. 466 (1999) 8. |
| [11] | E. Levillain, F. Gaillard, J.P. Lelieur, Polysulfides in dimethylformamide: only the redox couples Sn-/Sn2- are involved, J. Electroanal. Chem. 440 (1997) 243. |
| [12] | U. Yogeswaran, M.S. Chen, S.H. Li, Electroanalytical responses of arsenic oxide, methanol and oxygen at the ruthenium oxide hexachloroiridate with platinum hybrid film, Electroanalysis 20 (2008) 2324. |
| [13] | R. van Lis, W. Nitschke, S. Duval, B. Schoepp-Cothenet, Arsenics as bioenergetic substrates, Biochim. Biophys. Acta – Bioenerg. 1827 (2013) 176. |
| [14] | S. Fierro, C. Comninellis, Y. Einaga, Simultaneous detection of iodine and iodide on boron doped diamond electrodes, Talanta 103 (2013) 33. |
| [15] | V. Žic, V.W. Truesdale, N. Cukrov, The distribution of iodide and iodate in anchialine cave waters. Evidence for sustained localized oxidation of iodide to iodate in marine water, Marine Chem. 112 (2008) 168. |
| [16] | K. Bluhm, P. Croot, K. Wuttig, K. Lochte, Transformation of iodate to iodide in marine phytoplankton driven by cell senescence, Aquat. Biol. 11 (2010) 1. |
| [17] | P.S. Guin, S. Das, P.C. Mandal, Electrochemical reduction of quinones in different media: a review, Int. J. Electrochem. (2011) Ms ID 816202. |
| [18] | M.A. Bhat, Mechanistic, kinetic and electroanalytical aspects of quinone-hydroquinone redox system inN-alkylimidazolium based room temperature ionic liquids, Electrochim. Acta 81 (2012) 275. |
| [19] | G. Battistuzzi, M. Bellei, C.A. Bortolotti, M. Sola, Redox properties of heme peroxidases, Arch. Biochem. Biophys. 500 (2010) 21. |
| [20] | O. Scialdone, C. Guarisco, S. Crispo, A. D'Angelo, A. Galia, Investigation of electrode material. Redox couple systems for reverse electrodialysis processes. Part I: iron redox couples, J. Electroanal. Chem. 681 (2012) 66. |
| [21] | M.I. Awad, T. Ohsaka, Electroanalysis of peroxone, Electrochem. Commun. 6 (2004) 1135. |
| [22] | R. Kizek, J. Vacek, L. Trnkova, F. Jelen, Cyclic voltammetric study of the redox system of glutathione using the disulfide bond reductant tris(2-carboxyethyl)phosphine,Bioelectrochem. 63 (2004) 19. |
| [23] | F.S. Saleh, M.R. Rahman, T. Okajima, L. Mao, T. Ohsaka, Determination of formal potential of NADH/NAD+ redox couple and catalytic oxidation of NADH usingpoly(phenosafranin)-modified carbon electrodes, Bioelectrochem. 80 (2011) 121. |
| [24] | Š. Komorsky-Lovrić, M. Lovrić, Square-wave voltammetry of dissolved redox couple, Russ. J. Electrochem. 46 (2010) 1373. |
| [25] | D. Jadreško, Theory of square-wave voltammogram starting at the equilibrium potential, J. Electroanal. Chem. 693 (2013) 56. |
| [26] | S.W. Feldberg, Digital simulation: a general method for solving electrochemical diffusion – kinetic problems, in: A.J. Bard (Ed.), Electroanalytical Chemistry, Vol. 3, Marcel Dekker, New York, 1969, p. 199. |
| [27] | B. Speiser, Numerical simulation of electroanalytical experiments: recent advances in methodology, in A.J. Bard (Ed.), Electroanalytical Chemistry, Vol 19, Marcel Dekker, New York, 1996, p. 2. |