-
Paper Information
- Next Paper
- Paper Submission
-
Journal Information
- About This Journal
- Editorial Board
- Current Issue
- Archive
- Author Guidelines
- Contact Us
Research in Zoology
p-ISSN: 2325-002X e-ISSN: 2325-0038
2013; 3(1): 1-9
doi:10.5923/j.zoology.20130301.01
Genetic Diversity and Distances of Three Egyptian Local Sheep Breeds using Microsatellite Markers
 Abstract
 Reference
 Full-Text PDF
 Full-text HTML
Abdullah Ghazy1, Samir Mokhtar1, Manal Eid1, Ashraf Amin1, Mohamd Elzarei1, Keiichiro Kizaki2, Kazuyoshi Hashizume2
1Faculty of Agriculture, Suez Canal University, Ismailia 41522, Egypt
2Department of Veterinary Medicine, Faculty of Agriculture, Iwate University, Ueda 3-18-8, Morioka 020-8550, Japan
Correspondence to: Abdullah Ghazy, Faculty of Agriculture, Suez Canal University, Ismailia 41522, Egypt.
| Email: |  |
Copyright © 2012 Scientific & Academic Publishing. All Rights Reserved.
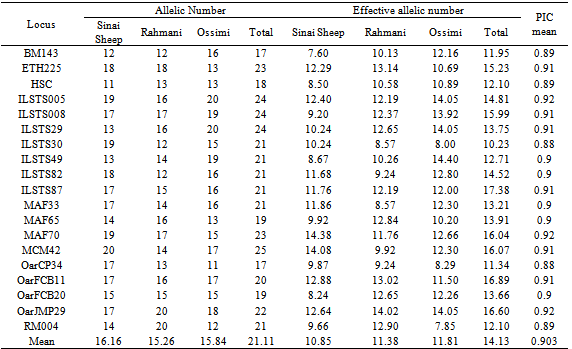
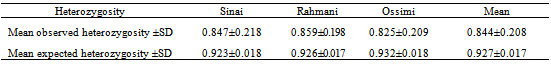
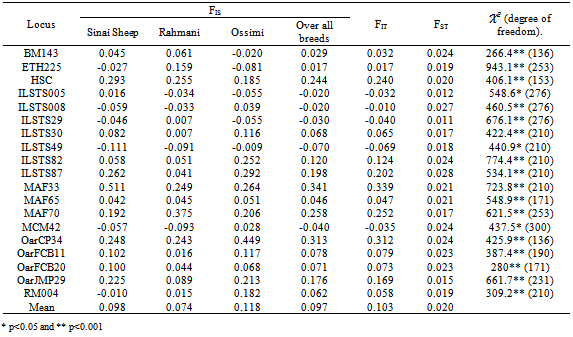
An analysis of nineteen microsatellite loci in 79 unrelated individuals was performed to define the genetic structure and variability of three local sheep breeds: “Sinai, Rahmani and Ossimi”. Allele diversity, observed heterozygosity, expected heterozygosity and genetic distance were calculated. Wright F-statistics, (FIS, FIT and FST) values were estimated. The average number of alleles per locus was 21.1 . Within breeds, the mean number of alleles ranged from 15.26 in Rahmani to 16.15 in Sinai. Mean expected heterozygosity (He) ranged from 0.923 in Sinai to 0.932 in Ossimi. Inbreeding coefficient for all populations is rather low FIS = 0.097 ranging from -0.079 in Rahmani to 0.118 in Ossimi. The mean genetic differentiation FST was 0.02 and demonstrated that 98% of total genetic variation is due to genetic differentiation within each population. In the neighbor–joining tree based on genetic distance (DS) Rahmani and Ossimi were grouped together, than Sinai. This study on sheep genetic diversity in Egypt provides valuable information on Sinai, Rahmani and Ossimi sheep genetic resources, and can assist in developing a national plan for the genetic improvement of indigenous sheep breeds in Egypt.
Keywords: Genetic Distance, Genetic Diversity, Local Breeds, Microsatellite, Sheep
Cite this paper: Abdullah Ghazy, Samir Mokhtar, Manal Eid, Ashraf Amin, Mohamd Elzarei, Keiichiro Kizaki, Kazuyoshi Hashizume, Genetic Diversity and Distances of Three Egyptian Local Sheep Breeds using Microsatellite Markers, Research in Zoology, Vol. 3 No. 1, 2013, pp. 1-9. doi: 10.5923/j.zoology.20130301.01.
Article Outline
1. Introduction
- Sheep play an important role in maintenance of rural populations and also has a particular cultural importance due to its traditional use in rites and celebrations. In Egypt, there are about 4 million sheep heads contribute 6% of the total red meet produced. Rahmani and Ossimi are the main sheep breeds in Egypt with a population of 990,000 and 514,000 heads, respectively[11]. Sinai sheep breed (Bedouin sheep) is about 135,649 heads[18]. Sinai sheep breed live under desert condition that characterized by a long hot summer with high solar radiation, along with poor and sparsely distributed pastures. Throughout their distribution area water is scarce and the pasture is meager and mostly of low quality-high in fiber and low in protein. An assessment of genetic variability in domestic sheep is a first step towards conservation of genetic resources for maintaining breeding options. Genetic characterization and determination of genetic differences between sheep breeds help in the genetic improvement programs. Molecular methods used molecular markers, such as RAPD, RFLP and microsatellites, are useful tools to study the genetic variations. Microsatellites have often been used for genetic diversity studies, because of their distribution throughout the genome, high level of polymorphism, co-dominant inheritance and easy to analyze[7]. Several studies had investigated the genetic diversity in sheep using microsatellites[1],[8-10],[13],[14]. In the present study, a set of nineteen microsatellite markers were used to evaluate the genetic diversity within and between three Egyptian sheep breeds (Sinai, Rahmani and Ossimi) and to measure the distance among these breeds.
2. Materials and Methods
2.1. Animals and Samples Collection
- In this study, 79 randomly blood samples were collected from different individuals of three Egyptian sheep breeds (Sinai, 26; Rahmani, 29; and Ossimi, 24). 10 ml of blood was collected via the jugular vein in K3EDTA containing tubes for prevention of coagulation. DNA was extracted from blood using the Genomic DNA Purification Kit of (Fermentas Co.). DNA concentration was determined using NanoDrop (Spectrophotometer ND-1000).
2.2. Microsatellite Analysis
- In this study, nineteen microsatellite markers across the ovine genome were used. Grading PCR thermal cycle was used to detect the suitable annealing temperature for each marker. The PCR products were tested in agrose gel to estimate the best annealing temperature for each primer. Studied microsatellite markers, their primer sequences, detected annealing temperature and their allele size ranges are showed in Table1. The selected microsatellites were amplified with polymorphism chain reaction (PCR) using genomic DNA extracted from individual animals. The PCR was performed for each locus in 10μl reactions consisted of 2μl of Genomic DNA (20ng), 5μl 2X PCR AmpliTag gold PCR Master mix (applied biosystems), 0.4 μl primer mix (50 pmoles) and 2.6 μl DNase free water. The PCR program was carried out at95oC for 10 min, followed by 35 cycles of 95℃ for 30 sec., annealing temperature which was determined for each primer (Table1) for 30 sec. and 72℃ for 30 sec., and final extension at 72℃ for 10 min. Following the completion of the PCR cycles, 3μl of the reaction products was mixed with 1μl 6X gel loading dye and then loaded into each well of vertical 8% polyacrylamide gel mad with 1X TBE buffer at 100 V for 60 to 90 min and stained with Ethidium bromide (1%). A 50bp DNA ladder was used to estimate allele sizes in base pairs (bp).
2.3. Statistical Analysis
- Genotypes were assigned for each animal based on allele size data. Frequencies and number of alleles for each locus, observed and expected heterozygosity and F-statistics (FIS is the inbreeding coefficient of an individual relative to the subpopulation, FIT is the inbreeding coefficient of an individual relative to the total population and FST is the effect of subpopulation compared to the total population) were estimated using FSTAT (version 2.9.3.2)[12]. FST (measure of differentiation among populations) were also calculated between all pairs of the tested breeds. The polymorphic information content (PIC) value was calculated according to[5]. Nei’s[19] standard genetic distances (DS) among populations were computed by POPGENE (version 1.31)[21]. The same program was used to construct the dendogram of un-weighted pair group with arithmetic mean (UPGMA).
|
3. Results and Discussions
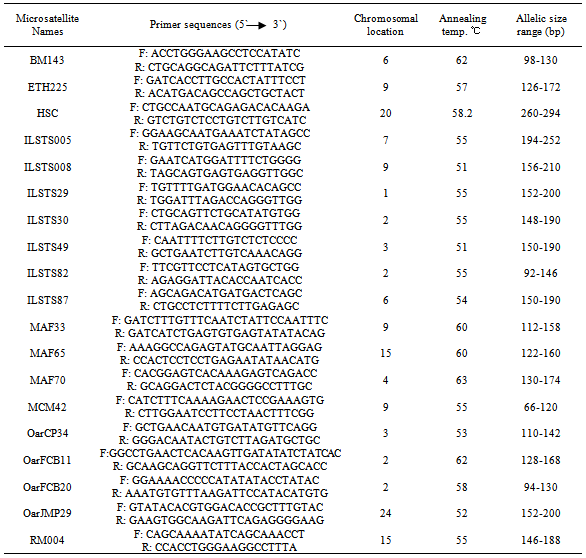
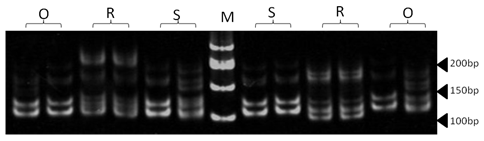
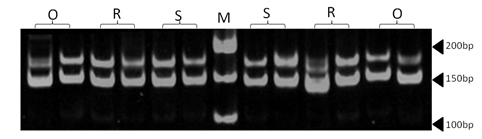
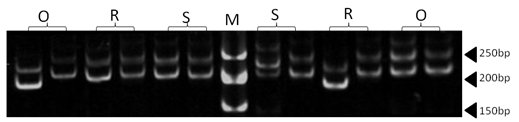
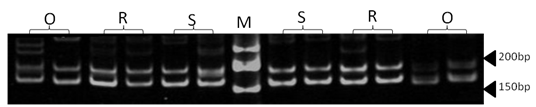
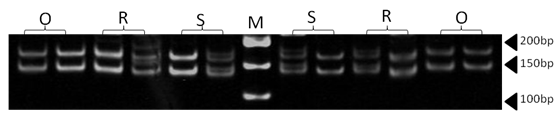
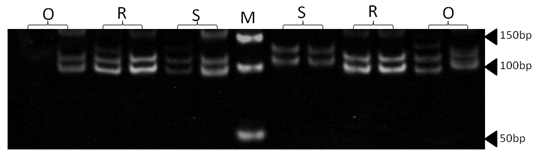
- Figures 1 to figure 19 represent an example of the results of nineteen microsatellite markers PCR products on polyacrylamide gels (8%) (PAGE).
 | Figure 1. Polyacrylamide gel (8%) showing alleles concerning BM143 marker. DNA ladder is on well M, Sinai sheep (S), Rahmani (R), and Ossimi (O) |
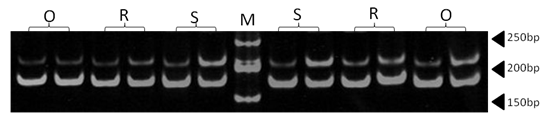
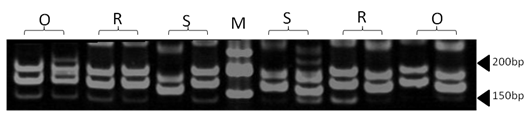
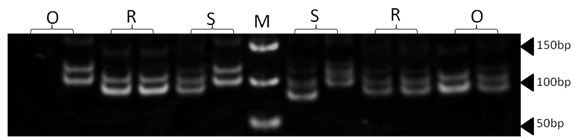
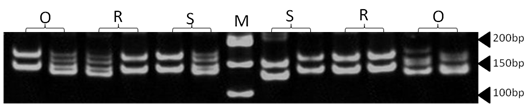
 | Figure 2. Polyacrylamide gel (8%) showing alleles concerning ETH225 marker. DNA ladder is on well M, Sinai sheep (S), Rahmani (R), and Ossimi (O) |
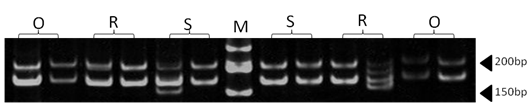
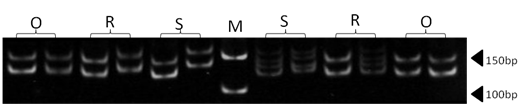
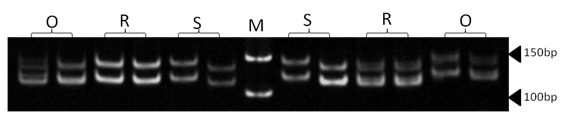
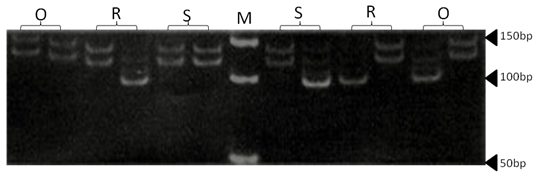
 | Figure 3. Polyacrylamide gel (8%) showing alleles concerning HSC marker. DNA ladder is on well M, Sinai sheep (S) and Rahmani (R) |
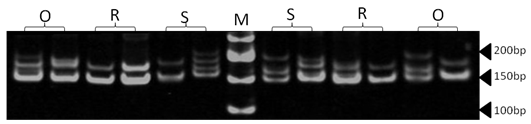
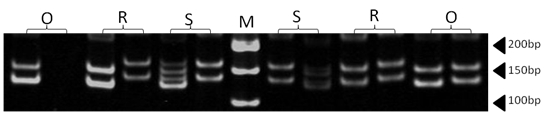
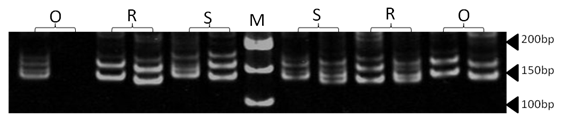
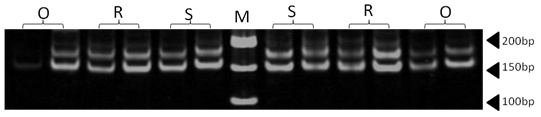
 | Figure 4. Polyacrylamide gel (8%) showing alleles concerning ILSTS005 marker. DNA ladder is on well M, Sinai sheep (S), Rahmani (R), and Ossimi (O) |
 | Figure 5. Polyacrylamide gel (8%) showing alleles concerning ILSTS008 marker. DNA ladder is on well M, Sinai sheep (S), Rahmani (R), and Ossimi (O) |
 | Figure 6. Polyacrylamide gel (8%) showing alleles concerning ILSTS29 marker. DNA ladder is on well M, Sinai sheep (S), Rahmani (R), and Ossimi (O) |
 | Figure 7. Polyacrylamide gel (8%) showing alleles concerning ILSTS30 marker. DNA ladder is on well M, Sinai sheep (S), Rahmani (R), and Ossimi (O) |
 | Figure 8. Polyacrylamide gel (8%) showing alleles concerning ILSTS49 marker. DNA ladder is on well M, Sinai sheep (S), Rahmani (R), and Ossimi (O) |
 | Figure 9. Polyacrylamide gel (8%) showing alleles concerning ILSTS87 marker. DNA ladder is on well M, Sinai sheep (S), Rahmani (R), and Ossimi (O) |
 | Figure 10. Polyacrylamide gel (8%) showing alleles concerning MAF33 marker. DNA ladder is on well M, Sinai sheep (S), Rahmani (R), and Ossimi (O) |
 | Figure 11. Polyacrylamide gel (8%) showing alleles concerning MAF65 marker. DNA ladder is on well M, Sinai sheep (S), Rahmani (R), and Ossimi (O) |
 | Figure 12. Polyacrylamide gel (8%) showing alleles concerning MAF70 marker. DNA ladder is on well M, Sinai sheep (S), Rahmani (R), and Ossimi (O) |
 | Figure 13. Polyacrylamide gel (8%) showing alleles concerning MCM42 marker. DNA ladder is on well M, Sinai sheep (S), Rahmani (R), and Ossimi (O) |
 | Figure 14. Polyacrylamide gel (8%) showing alleles concerning OarCP34 marker. DNA ladder is on well M, Sinai sheep (S), Rahmani (R), and Ossimi (O) |
 | Figure 15. Polyacrylamide gel (8%) showing alleles concerning OarFCB11 marker. DNA ladder is on well M, Sinai sheep (S), Rahmani (R), and Ossimi (O) |
 | Figure 16. Polyacrylamide gel (8%) showing alleles concerning OarFCB20 marker. DNA ladder is on well M, Sinai sheep (S), Rahmani (R), and Ossimi (O) |
 | Figure 17. Polyacrylamide gel (8%) showing alleles concerning OarJMP29 marker. DNA ladder is on well M, Sinai sheep (S), Rahmani (R), and Ossimi (O) |
 | Figure 18. Polyacrylamide gel (8%) showing alleles concerning ILSTS82marker. DNA ladder is on well M, Sinai sheep (S), Rahmani (R), and Ossimi (O) |
 | Figure 19. Polyacrylamide gel (8%) showing alleles concerning RM004 marker. DNA ladder is on well M, Sinai sheep (S), Rahmani (R), and Ossimi (O) |
|
|
|
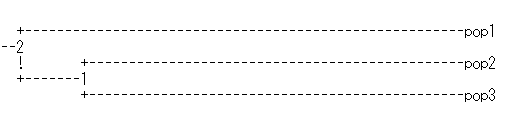 | Figure 20. UPGMA dendogram generated from Nei’s genetic distances of the three sheep breeds. (Pop1: Sinai, Pop2: Rahmani and Pop3: Ossimi) |
4. Conclusions
- This study presents an initial step in investigation of variability at the DNA level within and between some Egyptian sheep breeds. The results indicated that all studied breeds exhibited considerable genetic variation, based on their high mean number of alleles and gene diversity. The results also suggest that the three breeds (Sinai, Rahmani and Ossimi) are slightly heading towards inbreeding. Sinai breed distributed far away than the other Egyptian sheep breeds. The results indicated also that genetic differentiation between Sinai and the other two breeds is larger than between both breeds. This study represents one of the preliminary studies designed to characterize the molecular genetic variability of the Egyptian sheep breeds. There is really a need to more thorough analysis of the genetic diversity of local sheep breeds from other regions to include more breeds, large sample sizes and additional molecular markers. The evaluation of genetic variations within and between Egyptian sheep breeds may be used as basis for the development of a national breeding strategy.
ACKNOWLEDGEMENTS
- The practical work of this study was prepared through a scholarship from Egyptian government and conducted at the Laboratory of Physiology; Department of Veterinary of Faculty of Agriculture, Iwate University- Japan.
References
| [1] | Arora R. and Bhatia S., Genetic structure of Muzzafarnagri sheep based on microsatellite analysis. Small Ruminant Research, vol. 54, no. 3, pp. 227-230, 2004. |
| [2] | Arora R. and Bhatia S., Genetic diversity of Magra sheep from India using microsatellite analysis. Asian Australasian Journal of Animal Sciences, vol. 19, no. 7, pp. 938-942, 2006. |
| [3] | Barker JSF., Tan SG., Moore SS., Mukherjee Tk., Matheson JL. and Selvaraj OS., Genetic variation within and relationship among populations of Asian goats (Capra hircus). Journal of Animal Breeding and Genetics, Vol. 118, no. 4, pp. 213-233, 2001. |
| [4] | Bhatia S. and Arora R., Genetic diversity in Kheri-A pastoralists developed Indian sheep using microsatellite markers. Indian Journal of Biotechnology, vol. 7, pp.108-112, 2008. |
| [5] | Botstein D., White R.L., Skolnick M. and Davis R.W., Construction of a genetic linkage map in man using restriction fragment length polymorphism. The American Journal of Human Genetics, vol. 32, no. 3, pp. 314–331, 1980. |
| [6] | Carmen Maria, Genetic characterization of indigenous goat populations of Mozambique, Master thesis, Department of Production Animal Studies in Faculty of Veterinary Science, University of Pretoria, South Africa, 2007. |
| [7] | Cañon J., Garćıa D., Garćıa-Atance M.A., Obexer-Ruff G., Lenstra J.A., Ajmone-Marsan P., Dunner S., the Econogene Consortium, Geographical partitioning of goat diversity in Europe and the Middle East, Animal Genetics, vol. 37, no. 4, pp. 327–334, 2006. |
| [8] | Diez-Tascon C., Littlejohn RP., Almeida PAR. and Crawford AM., Genetic variation within the Merino sheep breed: Analiysis of closely related populations using microsatellites, Animal Genetics, vol. 31, no. 4, pp. 243-251, 2000. |
| [9] | El-Nahas Soheir M., Hassan Amal A., Abou Mossallam Ahlam A., Mahfouz Eman R., Bibars Mona A., Oraby Hanaa A. S. and de Hondt H. A., Analysis of genetic variation in different sheep breeds using microsatellites, African Journal of Biotechnology, vol. 7, no. 8, pp. 1060-1068, 2008. |
| [10] | El-fawal M. A., Molecular genetic diversity in characteristics of some Egyptian sheep breeds. Master thesis. Animal Production Department, Faculty of Agriculture, Ain Shams University, Cairo, Egypt, 2006. |
| [11] | Galal S., Abdel-Rasoul F., Anous M.R. and Shaat I., On-station characterization of small ruminant breeds in Egypt. In: L. Iñiguez (ed.), Characterization of Small Ruminant Breeds in West Asia and North Africa, vol. 2, ICARDA, Aleppo, Syria, pp. 141–193, 2005. |
| [12] | Goudet J. (2002) FSTAT (version 2.9.3.2): a program to Estimate and Test gene Diversities and Fixation Indices. Available from http://www.unil.ch/izea/software/fstat.html. Updated from Goudet (1995). |
| [13] | Gutiérrez-Gil B., Uzun M., Arranz J., Primitivo FS., Yildiz S., Cenesiz M. and Bayon Y., Genetic diversity in Turkish sheep, Acta. Agriculturae Scandinavica, Section A- Animal Science, vol. 56, no. 1, pp. 1-7, 2006. |
| [14] | Hassan A.A., AbouMosallam H.A., Oraby H.A., de Hondt and El-Nahas S.M., Genetic Diversity of Three Sheep Breeds in Egypt Based on Microsatellites Analysis. Journal of genetic Engineering and Biotechnology, (NRC) vol. 1, no. 1, pp. 141-150, 2003. |
| [15] | Kalinwski ST., How many alleles per locus should be used to estimate genetic distances, Heredity, vol. 88, no. 1, pp. 62-65, 2002. |
| [16] | Laval G., Iannuccelli N., Legault C., Milan D., Groenen MAM., Giuffra E., Andersson L., Nissen PH., Jorgensen CB., Beeckmann P., Geldermann H., Foulley JL., Chevalet C. and Ollivier L., Genetic diversity of eleven European pig breeds. Genetic Selection and Evolution, vol. 32, no. 2, pp.187-203, 2000. |
| [17] | Luikart G., Biju-Duval MP., Ertugral O., Zagdsuren Y., Maudet C. and Taberlet P., Power of 22 microsatellite markers in fluorescent multiplexes for parentage testing in goats (Capra hircus). Animal Genetics, vol. 30, no. 6, pp. 431- 438, 1999. |
| [18] | MALR, Livestock Census. Ministry of Agriculture and Land Reclamation, Animal Production Sector, Cairo, Egypt, 1997. |
| [19] | Nei M., Molecular Evolutionary Genetics. Columbia University Press, New York, USA, 1987. |
| [20] | Peter C., Bruford M., Perez T., Dalamitra S., Hewitt G. and Erhardt G., ECONOGENE Consortium. Genetic diversity and subdivision of 57 European and Middle-Eastern sheep breeds. Animal Genetics, vol. 38, no. 1, pp. 37-44, 2007. |
| [21] | Yeh F.C., Yang R.C. and Boyle T., POPGENE (version1.31): A Microsoft Windows-based Freeware for Population Genetic Analysis. University of Alberta and the Centre for International Forestry Research, Edmonton, Canada, 1999. |
| [22] | Yu X., Huang X.X., Liu W.J., Fang Y., Shi L., Xing W.T., Tang C.W. and Brown M.A., Analysis of Genetic Diversity on 15 Sheep Breeds in Xinjiang of China. Journal of Animal and Veterinary Advances. Vol. 10, no. 2, pp. 144-150, 2011. |