Eugène C. Ezin, Aurince J. Akakpo
Unité de Recherche en Informatique et Sciences Appliquées, URISA, Institut de Mathématiques et de Sciences Physiques, IMSP, University of Abomey-Calavi, Benin, BP 613 Porto-Novo, Republic of Benin
Correspondence to: Eugène C. Ezin, Unité de Recherche en Informatique et Sciences Appliquées, URISA, Institut de Mathématiques et de Sciences Physiques, IMSP, University of Abomey-Calavi, Benin, BP 613 Porto-Novo, Republic of Benin.
| Email: |  |
Copyright © 2012 Scientific & Academic Publishing. All Rights Reserved.
Abstract
Mapping on the Internet is a growing field with many applications using cartographic data. Available technologies differ markedly in their complexity, cost and openness. This work addresses a three-component Web mapping solution for area management in a town council in Benin. The implementation has been done thanks to a geographic database PostgreSQL/PostGIS that handles spatial and attributes data. The geographic server uses these spatial data to produce map layers thanks to the requirements of the Web application. The latter is based on the java server pages and servlets technologies to manage the dynamic side of the system. The proposed system allows users to interact with it using Web browser or short message services from mobile phone. The full description of the system is presented in this paper.
Keywords:
Geographic Information System, Web Technologies, Spatial Database Management Systems
Cite this paper: Eugène C. Ezin, Aurince J. Akakpo, Web Mapping System for Public Area Management in Developing Countries, International Journal of Web Engineering, Vol. 2 No. 1, 2013, pp. 9-20. doi: 10.5923/j.web.20130201.02.
1. Introduction
As widely recognized, cartography is a means by which men represent geographic information in the form of symbols and graphics. It appears as the first step toward creating geographic information systems that widespread nowadays with many applications in the fields of health, demography, climatology, and topography. The Open Geospatial Consortium normalization has applications in the field of Web mapping where most of them are restricted to printing or diffusing information in a static mode. With a collection of tools, geographic information system GIS for short, is able to bridge the gap between curiosity-driven science and practical problem solving. GIS is a complex beast with many distinct appearances. To some, it is a way to automate the product of maps while to others this application seems far too mundane compared to the complexity associated with solving geographic problems and supporting spatial decisions according to Longley in[5].One effective way to make map information available to a group of nontechnical end users is to make it available through a Web page. Web mapping appears as GIS for Web developers[6]. There are two broad kinds of Web mapping applications: static and interactive. Static maps are displayed as an image on a Web page. Interactive maps are accessed through Web pages and are called Web-based maps or simply Web maps. These maps can be very powerful, but as mentioned, they can also be difficult to set up due to the technical skills required for maintaining a Web server, a mapping server/program and management of the underlying map data according to Longley in[2]. Maps are an effective medium which can be used for development projects as mentioned in[7].Unfortunately in developing countries, large scale maps are not always available; data are often so outdated such that free digital maps offer an alternative. In Benin, located in West Africa, area localization based-upon Web mapping application is not available. The goal of this work is to propose a Web mapping application for areas and shops localization to fill this observed gap in our town council. The case study in concern is Dogbo city.The paper is organized as follows: Section 2 presents the motivation under this study. Section 3 gives an overview on existing technologies in Web mapping. Section 4 highlights required tools to develop Web mapping applications where as section 5presents the solution we have developed to handle the Web mapping system as a tool for decision-making at the town council Dogbo, Benin Republic. Section 6 presents the physical system architecture while section 7 is about the deployment diagram. Section 8 presents the security concern whereas Section 9 shows the simulation results through interfaces. Finally the conclusion and perspectives are given in Section 10.
2. Motivation
In developing countries especially in Benin, public area management by authorities is subject to polemic. Despite the strong willing shown by authorities in town council, citizens often do not trust the results of area or shop attribution. There is no monitoring system to help citizens to know which public areas or shops are available. In Benin, there is no municipality with modern IT tools for monitoring areas or shops under the control of town council. Mayors with their councilors have a broad discretion and independent powers to manage human and financial resources of their community. The heart of this is the management of public spaces which is often a source of disagreement between administration and citizens. The causes of these conflicts are of various origins including:• the lack of geographic delimitation and areas' identification. Taxpayers attempted to use more space than required. This situation often creates conflicts between taxpayers and town council administration.• the absence of a digital directory associating each occupant with allocated area. Such data are manual in many cases. • the delivered authorization permit to allow citizen to exploit a public does not mention geographic references about the considered area.• etc.Based on such analyses, the development of geographic information systems using the Internet and Web technologies could be useful for town councils for area and shop management. This system will improve the town councils performance in areas and shops management. Moreover, citizens are able to connect to the platform to monitor areas or shops available.
3. Overview on Web Mapping Technologies
Web mapping involves two main technologies which are Web technology and database management systems. Some of them are free or proprietary tools. There are two broad kinds of Web mapping applications which are static and interactive[1]. Static maps display an image on a Web page. Interactive maps aren't commonly seen because they require specialized skills to keep such sites up and running. Interactive maps that are accessed through Web pages are referred to Web-based maps. These Web-based maps are powerful and may be difficult to set up due to the technical skills required for maintaining a Web server, mapping server/program and management of the underlying map data. The term interactive implies that the user can somehow interact with the map. This means the user can select different map data layers to view or zooming into a particular part of the map of interest. All this is done interacting with the Web page and a map image that is repeatedly updated.
3.1. Web Scripting Languages
Web scripting languages are means to program dynamic Web pages. Their functionalities can be extended to database access, e-commerce transaction, Web mapping, etc. The commonly-used scripting languages are PHP, ASP, servlets, JSP, etc. • The personal preprocessor hypertext PHP for short was created in 1994 by Rasmus Ledorf. It is an interpreted scripting language mainly used to produce dynamic Web pages via HTTP server. For more details, the reader may refer to[8].• The Active Server Pages ASP for short, is a standard developed by Microsoft in 1996. It allows the development of interactive Web pages. ASP is a structure consisting of objects accessible through VBScript and Jscript languages. For more details, the reader may refer to[9].• A servlet is a program that runs on the server side and allows functions' extension. It receives a request from clients, processes it and returns the result. The connection between the servlet and the client can be direct or through an intermediary such as a HTTP server. For more details, the reader may refer to[11, 12].• The Java Server Pages JSP for short, are a Java technology which allows the generation of dynamic Web pages. JSP technology separates the presentation as XHTML and treatments in the form of Java class. JSP allows to introduce Java code in predefined tags within XHTML page. For more details, the reader may refer to[11, 12].
3.2. Web Servers and Web Applications
Web servers and application servers are tools at the server side that execute Web applications. Even though they are different from each other, they are complementary. The Web server is on charge of queries through the hypertext transfer protocol from the client. Application servers execute applications on server side. The Web servers and the application servers are usually combined. It is the case of Tomcat server, JBoss server, Jetty server, Glassfish server which are from Java technology.
3.3. Presentation of Tomcat Application Server
Apache Tomcat container is a free application written in Java that implements the specifications about servlets and JSP. It includes by default Apache Web server and can be used independently with the Web server or in collaboration with other servers such as Internet Information Server[3].
3.4. Presentation of Jetty Application Server
Jetty is a HTTP server and servlet engine written entirely in Java. Because of its small size, it is ideal for defining Web services once embedded in a Java application[3].
3.5. Presentation of Glassfish Application Server
GlassFish is the first open source that fully implements the Java Enterprise Edition. It allows developers to create and deploy Web applications. At standard levels, GlassFish covers JSP and servlets to do dependency injection in the Web container.
3.6. Spatial Database Management Systems
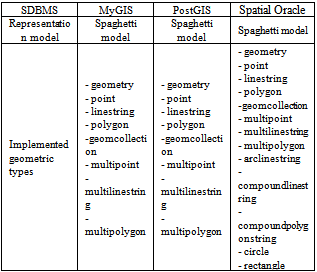
A spatial database is an optimized database that stores and queries data related to objects in space, including points, lines and polygons. While typical databases can understand various numerical and character data types, additional functionalities needs to be added for spatial databases to process spatial data types called geometry.There exist many spatial database management systems, SDBMS among which Oracle spatial of Oracle, PostGIS of PostgresSQL, MyGIS of MySQL with features to manage object geometry, spatial index, spatial predicate, spatial function, spatial reference system. We will present these three SDBMS through these characteristics based upon the Open Geospatial Consortium, OGC.
3.6.1. Geometry
The three spatial DBMS use a vector mode to represent geographic objects based on the spaghetti model. Spaghetti data are vector data composed of simple lines with no topology and usually no attributes according to GIS dictionary[4]. Spaghetti lines may cross, but no intersections are created at those crossings. According to this model, the representation of spatial data is the one where the geometry of an object is described independently of another.They all implement the OGC defined object model. Only Oracle allows the arc storage as part of a geometry, but it does not respect the naming rules[12]. Table 1 summarizes the representation model and geometric types used by three spatial DBMS to represent objects. Table 1. Comparison of spatial DBMS based on geometry features
 |
| |
|
3.6.2. Spatial Index
According to GIS dictionary[4], a spatial index is a mechanism for optimizing access to data based upon the spatial column of the business table. A spatial index is used by spatial database to optimize spatial queries. The spatial database management systems have a spatial indexing system and recommend the use of indexes for columns that contain geographic objects. Indeed, the spatial data are often large and therefore require significant processing time. It is important to classify these columns in the space using a system of indexing to optimize treatment. The reader may refer to[4] to obtain more details.
3.6.3. Spatial Predicate
A primary function of a geographic information system is to determine the spatial relationships between features. Spatial predicates combine functions and operators to test the spatial relations between objects. Predicates are Boolean functions that return TRUE if a test passes and FALSE, otherwise, to determine if a specific relationship exists between a pair of geometries. These predicates often use the notion of rectangle-encompassing objects to realize tests to do quick calculations. For more details, we refer the reader to[4].
3.6.4. Spatial Reference Function
Since the geographic data are represented on a nearly spherical surface, it is necessary to represent them on flat surfaces. This is done thanks to mathematical formulas[16]. The data are then transformed into a new system of spatial reference. Therefore spatial database management systems offer various functionalities.
4. Requirements of Web Mapping Applications
The basic requirements of a Web mapping application are a computer, an Internet connection, a Web server, a Web mapping server and mapping data that we may describe as follows.• A computer. Its characteristics depend on how intensive the Web mapping application is. One should also take care about the operating system. In general, Windows and Linux operating systems are best supported whereas Mac OS X and other Unix-based systems are less so[1]. • An Internet connection. Since the idea is to share the Web mapping application with others, its performance depends on the bandwidth of the Internet connection. • A Web server. A Web server is needed to handle the high-level communications between the end-user and the underlying mapping services. The Web server presents a Web page containing maps and map-related tools to the end user. Apache HTTP server and Microsoft Internet Information Services are the most used[1].• A Web mapping server. The Web mapping server is the engine behind the maps through which one can see on the Web page. The Web mapping server needs to be configured to allow communication with the Web server and to assemble data layers into an appropriate image.• Mapping data. Mapping data is often referred to as spatial or geospatial data and can be used in an array of desktop mapping programs or Web mapping servers. Mapping information to display can be satellite imagery, database connections, GIS software files, text files, etc.
4.1. Data Acquisition
The data for the production of the geographic database can be obtain from various sources namely:• satellite images; • aerial photographs;• existing maps;• data collected with a Global Positioning System GPS receiver.The last option is the one we used for data acquisition for the proposed system. The GPS is a satellite positioning system capable of giving a position within a few meters anywhere on the globe. Originally, GPS was designed to provide the U.S. military system global tracking of high accuracy[15].
5. Description of the Proposed System
It has become much more convenient from the user needs to design an application that best meets its requirements. In the case of the Web mapping under consideration, users are citizens whose objective is to interact with the platform for a request about available areas in a town council. The functional requirements of the proposed system are the following:• any user can view, locate or ask for a particular area;• an occupant of an area may send complaints through the system;• a staff member in charge of complaint management may reply;• the Mayor may connect to the system to validate a request, to generate authorization document; • a requester may be either informed by email or SMS about notification or approval on his request;The non-functional specifications are the following:• the only need required to use the application is a Web browser;• all necessary tools and libraries for the implementation of the Web mapping platform should be free and open-source;• the application should be extensible in the way that other functionalities can be embedded to improve its performance.• Data management should be centralized and facilitated by a dedicated application; • The mapping server should be accessible via a home page; • The interface should be simple and ergonomic.
5.1. Methodology
It is usually necessary to use approved methods for modeling and planning any process. The used approach in this project is inspired by the one proposed by Roques in[13]. The analysis is structured around three key areas:• the functional analysis through which we describe the different use-cases; • the dynamic analysis that allows us to describe the life cycle of the object diagram sequence;• the static analysis that allows the description of the object structure through class diagram.Let us describe each one.
5.2. Functional Analysis
By functional analysis, we present the different actors, their roles and functions in the system.
5.2.1. Actors
An actor is the abstraction of a role played by external entities (user, device hardware or other systems) that interact directly with the system studied[13]. We identified the following actors who interact with the system:• Citizen: a user whose functions are limited to monitoring or asking for an area; • An occupant: He is a citizen who has received an occupation authorization from the mayor. He can complain if something is wrong on the platform; • A staff member: He is any agent of the municipal administration authorized to use the system to respond to user requests.• The Mayor: He is a chief of a town council with the special role of generating authorization automatically when all requirements are satisfied; • Conflict manager officer: He is also a staff member able to propose a solution to a complaint request from occupants. • System administrator: He is the one in charge of the system management. He updates the spatial database and manages the different users.
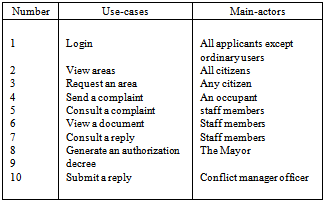
5.2.2. Use-cases
Table 2. Different actors in the proposed system
 |
| |
|
A use-case represents a set of actions performed by the system and produces an observable and interesting result for a particular actor. Furthermore, a use-case models a service provided by the system. It allows describing what the future system should do without specifying how it will do it. All use-cases should describe comprehensively the functional requirements of the system according to Roques in[13]. Table 2 presents different use-cases we identified about the proposed system.The use-case diagram shows the functional interactions between actors and the system. Figure 1 shows the use-case diagram about a citizen.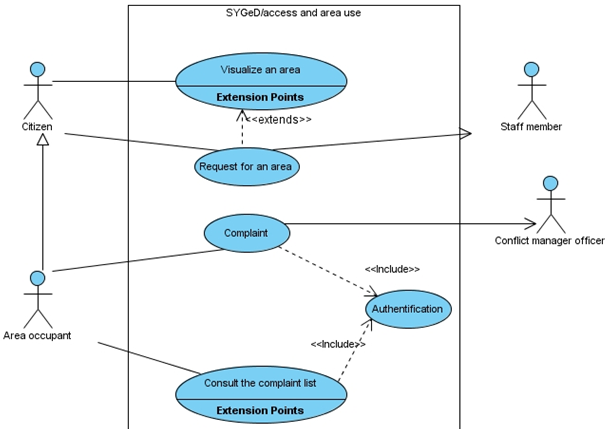 | Figure 1. Use-case diagram which concern a citizen |
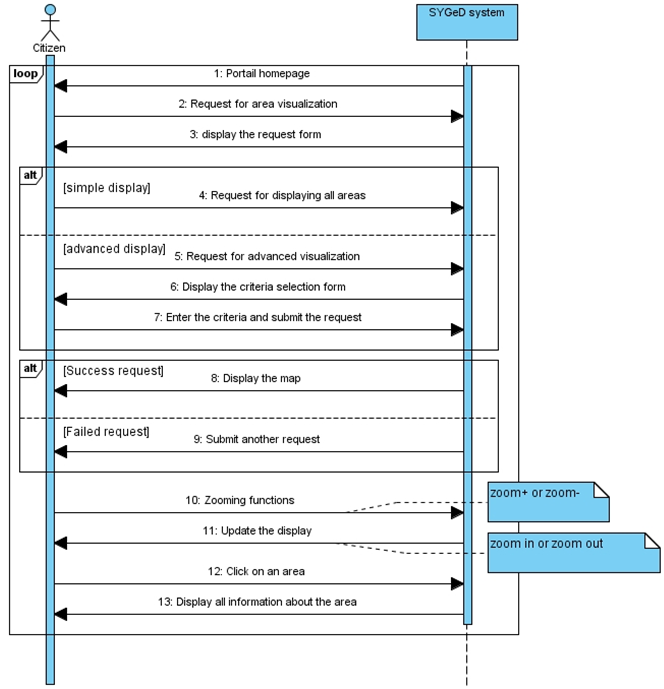 | Figure 2. Sequence diagram about monitoring an area |
5.2.3. Dynamic Analysis
The dynamic analysis is used to monitor the evolution of objects and to understand their operations in the system. It is based on several charts including the sequence diagram. Many sequence diagrams can be drawn according to identified use-cases. Figure 2 presents the sequence diagram about monitoring an area.
5.2.4. Static Model and Relational Model
Static analysis is responsible for the structural description of system components. We describe the different classes through the class diagram and their relationship. Taking into account that there may be interactions between the different classes, we can rearrange them into the package diagram. Figure 3 shows the class diagram of the proposed system.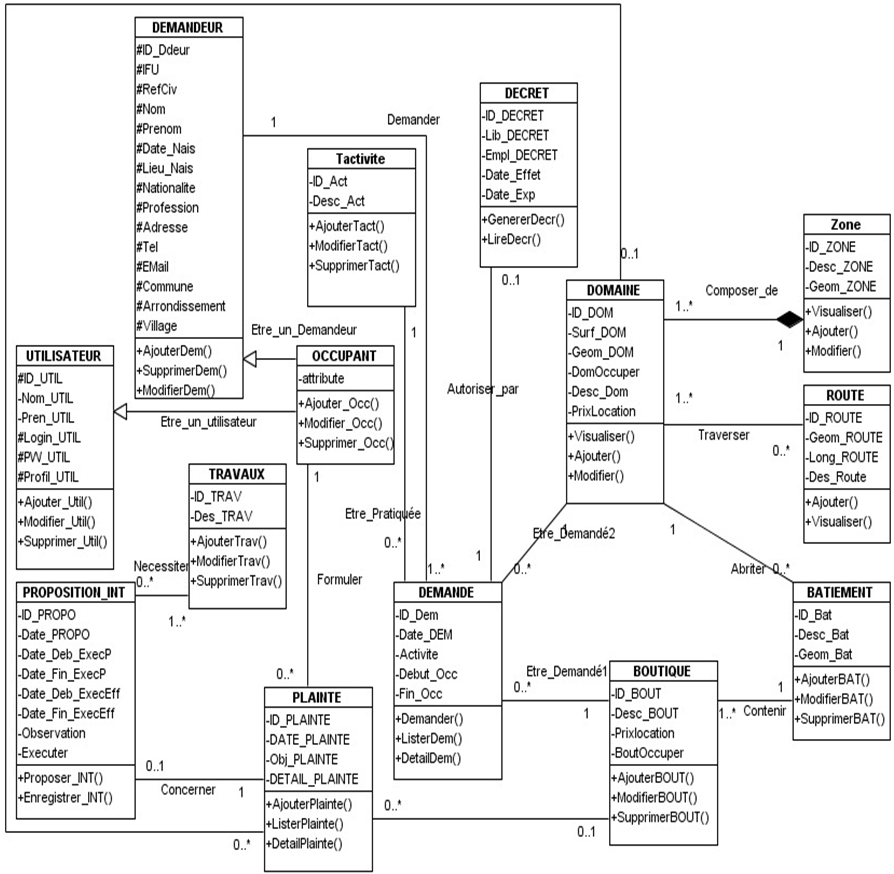 | Figure 3. Class diagram of the proposed system |
From the class diagram in Figure 2, the following relational model can be proposed: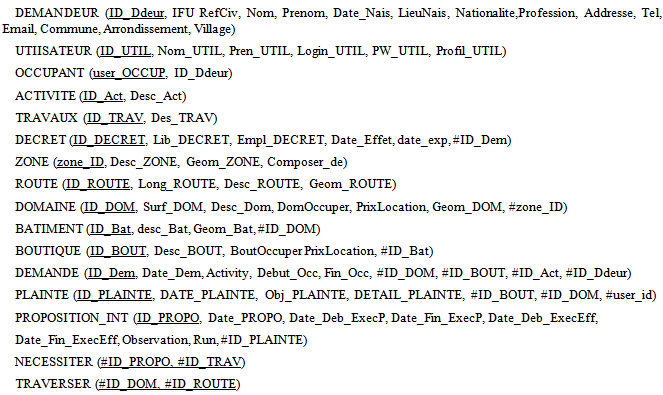
6. Physical System Architecture
We propose a physical architecture which is based on the communication protocol TCP/IP. At the application level, the exchange of data between the server application server (also Web) and the DBMS is through JDBC (Java Database Connectivity). JDBC is a Java API very used to access databases. Similarly, between the data server and the server geographical, the JDBC API is used for data exchange. In addition, different customers request services to the application server by issue queries based on the http protocol.HTTP request is received by the Web server. This request may require a static resource or a dynamic resource. When it is a static resource, it is directly provided by the Web server. An application that requires dynamic resource (map image for example) is redirected by the Web server to the application server which is capable of treating java server pages and servlet codes. This request may require the consultation of the data source space. Once the map is produced, it is returned to the application server which, in its turn, has to run on the Web server as an HTML page. Thus, the Web server is able to interpret java server pages, and finally presents the response to the client as a static page. Figure 4 presents the physical system architecture we proposed.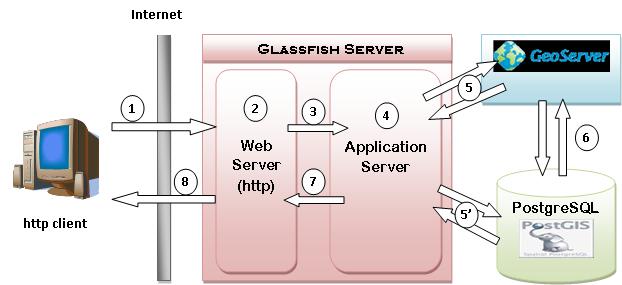 | Figure 4. Physical system architecture |
7. Deployment Diagram
Figure 5 presents the deployment diagram of the proposed system. It presents the location of the different servers involved in the system. At the application level, data exchange mechanism between the application and Web server and the database management system is done through JDBC which is a Java application programming interface[14]. Similarly, between the data server and the server geographical, the JDBC API is used for data exchange. 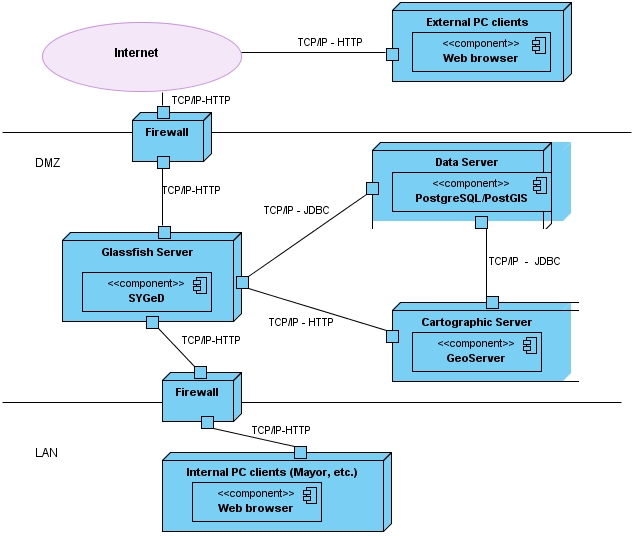 | Figure 5. Deployment diagram of the system |
8. Security Policy
It should be noted at the deployment diagram a DMZ DeMilitarized Zone 1 in Figure 5 comprising the application, geographic server and the data server. It is an area to which access is regulated by the security policy defined as follows:• traffic from an external network to the DMZ is allowed if it is a request to the application server (http request); • traffic from the external network to the internal network (LAN) is prohibited; • traffic from the internal network to the DMZ is allowed only for http requests sent to the application server; • internal network traffic to the external network is also allowed.
9. Simulation Results
The simulation consists of testing the platform on the different requirements we defined. The following subsections explain step by step the different functionalities of the implemented Web mapping application.
9.1. Homepage of the Platform
The platform home page has mainly three parts the banner, the navigation bar, and the body. The menu Accueil helps userss to reach the home page any time it is clicked. The menu Visualiser is used to show areas to the users. The menu Connexion is designed to connect users with existing account on the platform. In this case, the connected user has more options. The menu Demander is a means for the user to request an area. Figure 6 shows the home page of the Web mapping platform we developed. 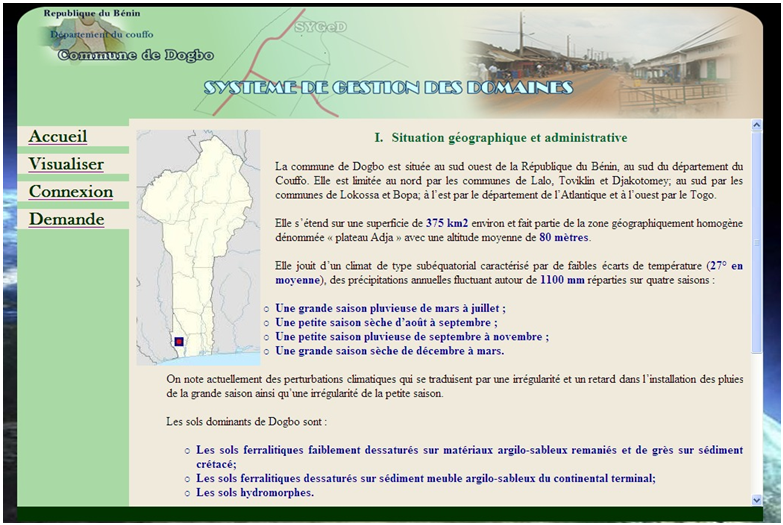 | Figure 6. Home page of the Web mapping system |
The interface shown in Figure 7 is the one obtained Once the user is logged in.
9.2. Areas’ visualization
The visualization page is composed of two parts. On the left, we have advanced layout options and at the right the layout of the map. Figure 7 shows the interface of area visualization.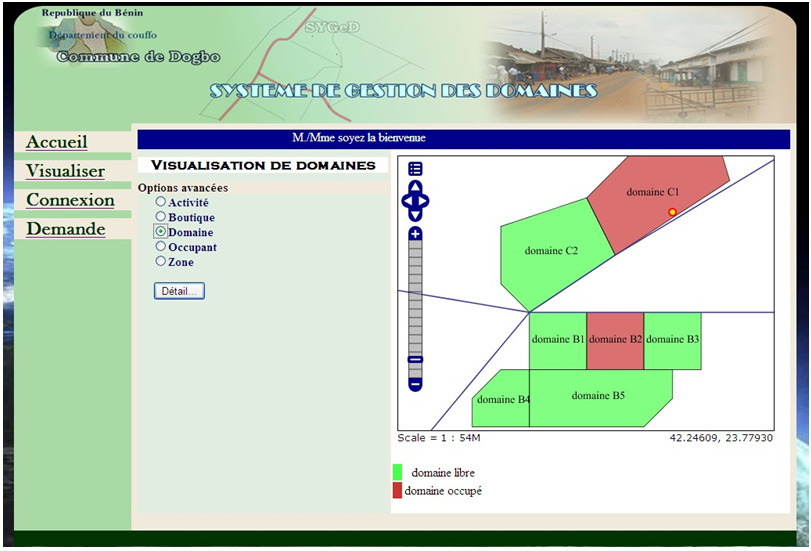 | Figure 7. Interface one the user is logged |
9.3. Request about an Area or a Shop
Two steps characterize a request about an area or a shop. During the first step, the user clicks on the menu Demande and the platform replies only with available areas and shops. Figure 8 shows the interface after a click on such a menu.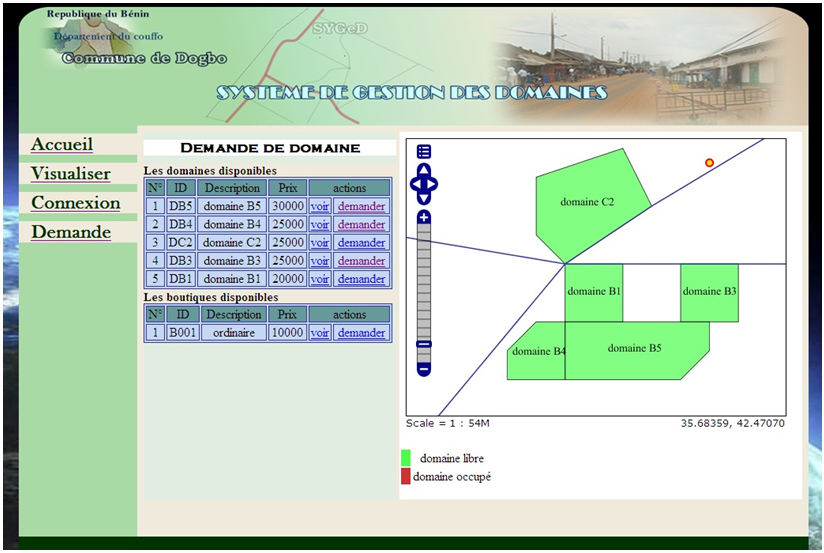 | Figure 8. Available areas or shops shown by the platform |
During the second step, once the user has a look on available areas or shops, he can ask for these areas or domain by clicking on the menu Demande. He then has access to the following form as shown in Figure 9.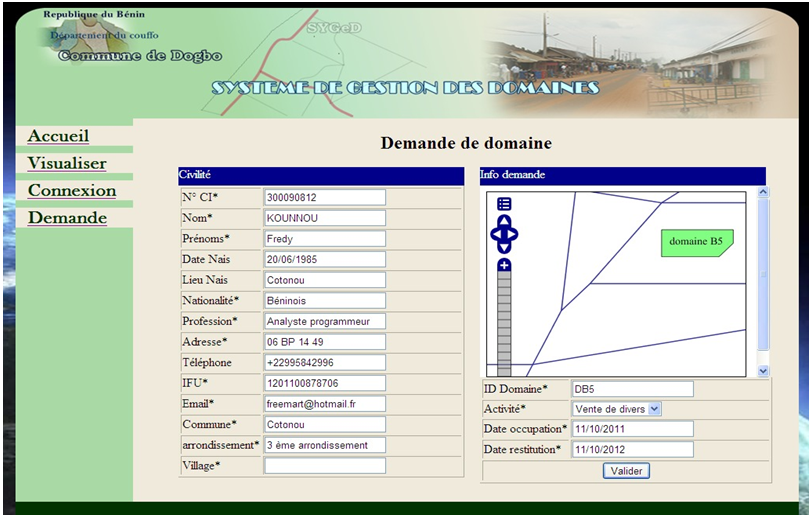 | Figure 9. Form to fill when asking for an area or shop available |
9.4. The Mayor Homepage once Logged
The mayor of a town council has some specific functions once logged with login and password. He has the possibility to generate an authorization decree or reject the request. Figure 10 shows the interface that allows such functionalities.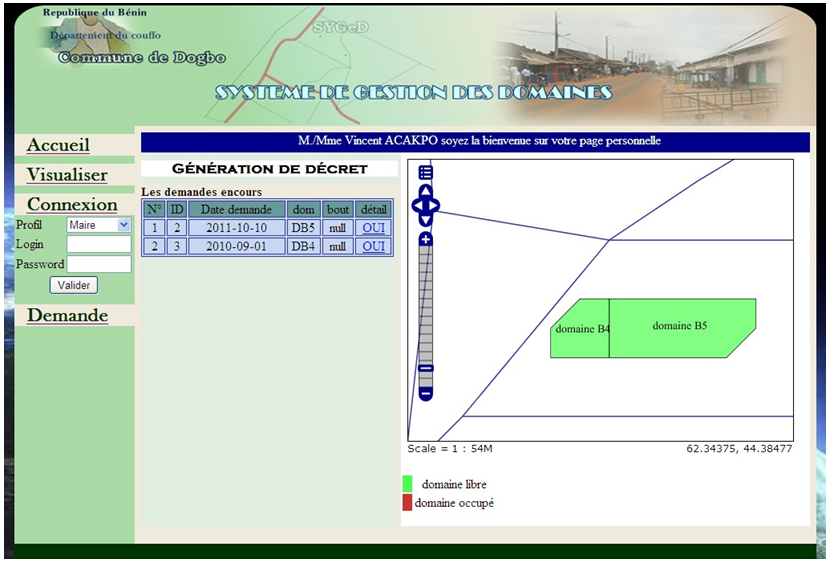 | Figure 10. Functionalities defined for the mayor once logged |
The mayor can obtain details about requested areas or shops if he clicks on the menu Details. He can also have the list of the requested areas in the queue. Figure 11 shows the interface about the list of requested areas in the queue. | Figure 11. Interface that shows the list of requested areas in the queue |
10. Conclusions
In this paper, we adopted a methodology with the main objective to design a useful Web mapping application to town councils for area and shop management. In this project, we used JSP and servlets technologies, and Java libraries to implement the prototype. The proposed system can display maps and users can interact with it. It has a high extension possibility. Through various tests, we may conclude this tool is very useful for a town council. However, one should note that the proposed system does not take into account 3D monitoring aspects. To go further in this work, we may consider some perspectives: • introduce geographic analysis to manage conflicts of proximity; • implement a 3D monitoring function.
ACKNOWLEDGMENTS
We much appreciate Mr Etienne Doyigbe for spending time to check English writing. We also thank anonymous reviewers for their review efforts to make this paper as best as possible through their comments and suggestions. This work is partially supported by the Laboratoire d’Informatique Signal et Image LISIC of the Université du Littoral et de la Cote d’Opale, ULCO in France.
References
| [1] | St L. Simon, Web mapping, O'Reilly Editor, 2005. |
| [2] | T. Mitchell, Web mapping illustrated, O'Reilly publisher, June 2005. |
| [3] | M. Tranchant, Veille technologique: UE NFE107 Architecture et Urbanisation de Systèmes d'Information, Rapport Technique, Décembre 2008. |
| [4] | GIS dictionary http://support.esri.com/en/knowledge based /Gisdictionary |
| [5] | A. P. Longley, Geographic information systems and sciences, edition Wiley, 2004. |
| [6] | S. Davis, GIS for Web developers, Adding where to your Web applications, The Pragmatic BookShelf, 2007. |
| [7] | C. Kreutz, G. Rambaldi, Online Mapping for development: Opportunities and Challenges}, available at the url http://www.Web2fordev.net/component/content/article/1-latest-news/76-mapping |
| [8] | T. Converse, J. Park, PHP Bible, second edition, Wiley publishing, 2002. |
| [9] | K. Weissinger, ASP in a Nutshell, second edition, O'Reilly, 2000. |
| [10] | B. Kurniawam, JSP and Servlets: a tutorial, 2012. |
| [11] | J. Murach, A. Steelman, Java Servlets and JSP, Murach publishing, 2008. |
| [12] | Centre National d’Etudes Spatiales France : Rapport de l'étude des bases de données spatialisées, available at rapport_etude_spatiale_final?, 2007. |
| [13] | Roques P., UML2 Modéliser une application Web, Editions Eyrolles, Fourth Edition, 2008. |
| [14] | Doudoux J.M., Développons en Java version 1.6 available at http://www.www.jmdoudoux.fr-/java/dej/indexavecframes.htm. |
| [15] | Bakary A., Conception et mise en œuvre d’un SIG pour le suivi des investissements publics au Cameroun, Mémoire Ingénieur de conception en informatique, Ecole Nationale Supérieure Polytechnique de Yaoundé, 2009. |
| [16] | W. Kainz, The Mathematics of GIS, available at The_Mathematics_of_GIS_Draft.pdf, 2010. |
 Abstract
 Reference
 Full-Text PDF
 Full-text HTML