-
Paper Information
- Paper Submission
-
Journal Information
- About This Journal
- Editorial Board
- Current Issue
- Archive
- Author Guidelines
- Contact Us
American Journal of Tourism Management
p-ISSN: 2326-0637 e-ISSN: 2326-0645
2015; 4(3): 61-76
doi:10.5923/j.tourism.20150403.03
Influence of Marketing Strategies on Tourists’ Choice of Destination Area in Cross River State, Nigeria
 Abstract
 Reference
 Full-Text PDF
 Full-text HTML
Anim O. Ajake
Department of Geography & Environmental Science, University of Calabar, Calabar, Nigeria
Correspondence to: Anim O. Ajake, Department of Geography & Environmental Science, University of Calabar, Calabar, Nigeria.
| Email: |  |
Copyright © 2015 Scientific & Academic Publishing. All Rights Reserved.
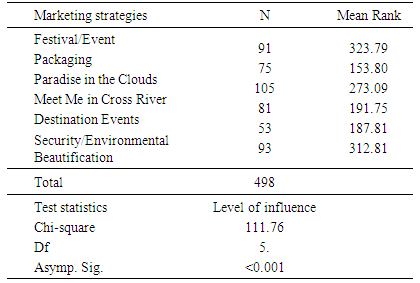
Development of tourism destination areas all over the world has increased the international arrivals. The study evaluated tourism destination attractions and the influence of marketing strategies and communication tools on tourists’ choice of destination area in Cross River State, Nigeria. The study relied on secondary data from government tourism organizations (GTOs) and private tourism service providers (PTSPs) who are involved in marketing and promotion of tourism products. Also, data was collected through questionnaire survey, interviews, observation and content analysis of tourism brochures. A total of 215 respondents consisting of tourists and staff of GOTs and PTSPs were used for the study. Data generated was analyzed using descriptive and quantitative statistics. The findings revealed that, from the six natures of activities participated by tourists in the destination area, 64 percent of them were involved in leisure/recreational park and historical site/museum activities. The one-way analysis of variance (ANOVA) of the level of attractiveness of tourism attractions and events produced F-ratio of 14.245 which was significant at 0.05 level, this established statistical significant difference in the level of attractiveness of tourism products in the destination area. The findings showed that the higher the responses on the level of attractiveness of a product, the higher the population of tourists on that attraction site. It was further discovered that Obudu Ranch Resort was the most attractive site accounting for 91 percent of the responses, while Obubra Crocodile Lake and Akatcha festival were considered not attractive by the tourists based on the nature of marketing strategies and communication tools. Furthermore, the Kruskal-Wallis test (H) for several independent samples was significant at x2 (df=5) = 111.76, with p<0.05 establishing significant difference in the level of influence of tourism marketing strategies on tourists’ choice of destination area. The study observed that all the marketing strategies were influential on aggregate representing 39 percent, however festivals/events and security/environmental beautification were rated very high as the most influential marketing strategies on tourists’ choice of destination attraction. They accounted for 66 percent and 63 percent respectively. The high rating was dependent on the quality of packaging of the programmes in marketing communication methods such as radio and television, internet, magazines/newspapers etc about the destination attractions. Based on the above findings, the study recommended more persuasive and appealing marketing strategies that will have great influence on tourists’ choice of destination in Cross River State, Nigeria.
Keywords: Attractions, Development, Persuasive, Destination, Marketing Strategies, Events, Attractiveness
Cite this paper: Anim O. Ajake, Influence of Marketing Strategies on Tourists’ Choice of Destination Area in Cross River State, Nigeria, American Journal of Tourism Management, Vol. 4 No. 3, 2015, pp. 61-76. doi: 10.5923/j.tourism.20150403.03.
Article Outline
1. Introduction
- The importance of tourism marketing as emphasized by Hannam (2004) was in recognition of the emerging challenges posed by the growing number of tourists’ destinations which have placed at the disposal of a tourist a variety of attractions in abundant quantity from a large number of competing nations. The increasing competitive tourism market has made the products marketing a very important factor in order to gain better destination patronage and to attract more consumption of services and generate repeat businesses and loyalty (Yuju-Wang, 2007).The development of tourism destination areas all over the world has increased the international tourist arrivals. The review of tourist arrivals over the past ten years indicated clearly that in 2005, an estimated 800 million tourists were documented, a 5.5 percent increase following the 10 percent surge registered in the preceding year. By 2007, the figure appreciated to 940 million, with a growth of 6.6 percent as compared to 2005, while in 2014, over 1.1 billion tourists travelled across the globe for tourism purposes (World Tourism Organization, 2014). Furthermore, the reasons why tourism has been variously advocated as a valued tool for driving development includes, a means of advancing wider international integration within areas such as the European Union (EU), or as a catalyst for modernization, economic development and prosperity in emerging nations especially in developing countries.Theoretically, marketing strategy is useful in targeting and developing new market segments and also helps to improve poor public relations which occurred as a result of several unfortunate events (Dore and Crouch, 2003). Thus, for a destination to gain from the global tourism share, as evident in the present age, the conscious creation and marketing of place products must be held sacrosanct. In effect, these products in other words known as tourism products are important for destination marketing as they influence people’s perception of the place and can affect their choice and behaviour towards the place.However, Bhaita (2006) observed that tourism product is not the tourism destination, but it is about the experience of that place and what happens there. The peculiarity of a tourism product is that, it cannot usually be sampled prior to purchase, it is not like a car or a cooking range of gas burner, refrigerator, or bookshelf which can be inspected before purchase (Seth, 2006). It requires purchase decisions to be made on the basis of available information and the projected and perceived images/brand of the destination. This attribute has made marketing and promotion in tourism clearly an essential factor for sustainable tourism development.Cross River State has a rich storehouse of resources which can sustain a viable tourism industry. The major tourism drivers of the destination are the cultural and natural endowments. In a bid to develop and promote tourism, government has embarked on massive rehabilitation and development of world-class tourism facilities that can compete favourably with what is obtainable in other parts of the world, as well as making it a preferred destination. The construction of the cable car is Obudu Mountain Resort, building of the Tinapa Leisure and Business Resort, the Marina Resort, National Park, investment in urban beautification through green capping; modern local transport systems are some of the pragmatic steps by Government to improve the destination in order to present different choices to tourists. Other attractions include: the canopy walkway in the rainforest of Boki, Afi mountain wildlife sanctuary, waterfalls in Agbokim, Akamkpa and Esori; and socio-cultural activities such as New Yam festivals, boat regatta, Nkarasi monoliths among others and all these present opportunities to tourists on their choice of the destination. The State also has evolved several marketing purposes of promoting the attractions and destination for tourists from all parts of the world. But this effort is yet to yield meaningful benefits.Although several studies have been carried in the study area, however, most them are focused on factors affecting ecotourism marketing (Esu, 2006), promoting an emerging tourism destination (Esu and Ebitu, 2010), tourism development (Egboyi, 2007) and tourism and employment structure (Amalu and Ajake, 2012). These studies have not critically considered the influence of marketing strategies on tourists’ choice of their destination.In a service industry such as tourism, Cooper, Fletcher, Flyall, Gilbert and Wanhill (2008), observed that marketing managers are also driving products toward choosing destinations. Eccles (1995) also noted that marketing mix helps destination management organisation to understand where marketing actions can be initiated in order to improve the acceptability of tourism product and stimulate demand. There is need to intermittently evaluate the tourism marketing strategies of Cross River State in order to determine the level of impacts in promoting the numerous tourism resources that can influence tourists’ choice of destination. It is with this background that this study seeks to examine which tourism marketing communication strategies influenced tourists’ choice of selecting the destination.
2. Literature Review
- Tourism marketing dates back to Pattinson’s (1993) work on place promotion by Tourism Board; “The Beautiful Berkshire”, during which stakeholders in the tourism industry collaborated and hired by the services of marketing officer to market and promote tourism attractions in the region. Another scenario of tourism product marketing was provided by Bierman (2000) in his publication; “Destination Marketing: The Marketing of Israel and Australia and the South-west Pacific” in which case, the Israel Ministry of Tourism developed a number of tactical promotional materials in their bid to penetrate the religious pilgrimage market.According to Bhaita (2002) proposed structure, tourism product for any country or region is marketed at two different levels. The national or regional tourism organization will first of all be engaged in marketing campaign to persuade potential tourists to visit the country or region for which it is responsible. In view of the complementarities of tourism services, the predominance of many small and medium-sized enterprises and above all, the benefits of tourism to an economy, the official tourism organizations have important role to play in marketing (Okpoko, 2006). The major objective of these organizations include: seeking to create knowledge of its country’s tourism market and persuade visitors in these markets to visit the country. Also, seek to create an image of its country in tourism attractions in the best possible manner so that potential tourists are attracted. The second level emphasized that, various individual firms providing tourism services can market their own components of the total tourism product after the national tourism organizations have launched marketing campaigns to persuade the potential tourists to visit the country or region for which it is responsible.Similarly, tourism flourishes heavily on customer demand, which if created could generate a heavy traffic flow to a particular destination. This demand can be created depending on marketing strategies that could place the area or region ahead by other competing destinations. According to Okpoko (2006), marketing strategy or “mix” has been viewed by tourism researchers as a package of offerings which are intended to attract and serve the tourist or visitor. Based on this premise, tourism businesses or organizations are enjoined to evolve or develop marketing strategies or “mixes” for different target markets to enable the destination gain a substantial market share.Furthermore, there are some specific promotional strategies that are commonly used by successful emerging tourism destinations to publicize attractions. Esu and Ebitu (2010) observed that promotion of tourism destinations can be through small scale businesses. In their opinion, small scale businesses, like the large scale ones, are part of the product offered by destinations. This is because the overall tourist experience is composed of numerous small encounters with a variety of tourism service providers. The promotion of quality and international best practices in service quality delivery in an emerging tourism destination has the potential of enhancing the destination’s image and increase tourists traffic to the place. In other words, tourism enterprises will operate profitably in destination where tourists visiting the area will receive higher quality service which can be leveraged for destination positioning, and small scale businesses operating will breed services and broaden target market. About two decades ago, Gray (1989) considered that promoting destinations requires a collective and collaborative effort of all the stakeholders in the destination. He referred to the collaborative process as shared decision making among all key stakeholders in a destination. This process is meant to promote destination through collective and collaborative marketing. Whereas, Hudson and Ritche (2006) argue that destination marketing organizations would be more successful if they were proactive enough in promoting film production in their locations.The purpose of marketing and communication in the opinion of Bhaita (2006), is to inform, persuade, encourage, or more specifically, to influence the potential customer or trade intermediaries (travel agents, tour operators, reservation services, hotel and charter broker) through communications, to think and act in a certain manner. Communication may be undertaken in a variety of ways, including advertising, direct marketing, sales promotion, personal selling and publicity, and public relation. On the other hand, advertising is an activity designed to spread information with a view to promoting the sales of marketable goods and services. It operates in two ways; first by spreading information amongst consumers about the possibilities of consumption, and second, by seeking to influence their judgment in favour of the particular goods or services which are subject of the advertisement (Bhaita, 2006). Marketing involves all promotional activities designed to transmit to the public specific and detail information on aspects of tourism destination such as accommodation, transportation, attractions, prices of services, and other logistics for tourists to make their choices.Opperman (1999) observed that the success of individual destinations depends on their ability to develop and project a unique and recognizable brand, which is one of the most important developments in marketing in the 20th century. For instance, brands such as Sheraton, Hilton, McDonalds and Nike have strong international recognition and are associated with professionalism and quality. A few years ago, Tinapa Business Resort and Obudu Mountain Resort were branded and received world attention. This has gradually diminished, and of no consequence in the study are anymore. Therefore, development of an effective brand is not likely to be a characteristic of a destination, but where the major stakeholders are in competition with each other. In summary, Esu and Ebitu (2010) emphasized that destination promotion has the potentials of producing benefits such as:(i) Creation of awareness and interest in the destination and the attractions;(ii) Differentiate the destination and its product offerings from competing destinations;(iii) Communicate the physical and psychological benefits of products packaged by the destination to the market;(iv) Build and maintain the overall image and reputation of the destination;(v) Persuade tourists to visit the destination and increase length of stay in the destination; and(vi) Assist the destination management to level out peaks and valleys result from seasonality of demand.From the literature reviewed so far, adequate attention appears to have been given to studies of tourism destination promotion (Pattison, 1993; Okpoko, 2002), development of attraction (Okpoko, 2006), tourism attractions marketing strategies (Bhaiti, 2006; Esu, 2006; Esu and Ebitu, 2010; Ajake and Amalu, 2012b); purpose of marketing and communication tools (Crouch and Dore, 2002) distribution channels of tourism products (Cooper et al., 2008) among others. In Nigeria and Cross River State, very little or no work has been done to assess the influence of tourism marketing strategies on tourists’ choice of any destination area. Several marketing strategies/programmes and large volumes of advertising messages about the tourism potentials of the study areas are made available to persuade tourists to make their choice and which destination to visit. These include festivals/events; packaging souvenirs/gift items; paradise in the cloud; meet me in Cross River; Destination events and security/environmental beautification. In addition, tourism marketing communication tools such as television, radio, internet, handbills, billboards, flyers, family and friends’ recommendation, travel agency desk information etc. were considered. These marketing strategies and marketing communication tools requires intermittent evaluation to determine their level of influence on tourists’ decision to choose a specific destination for visit. It is at this background that this study will go a long way to fill the gap.
3. Study Area
- The study area is Cross River State, Nigeria. The state is located between longitudes 7°40” and 9°50” East of the Greenwich meridian, and latitude 4°40” and 7°00” North of the Equator (Figure 1). The area occupies a landmass of approximately 23,074.43km2 with a population of over 2,888,988 people (National Population Commission, 2006). Within Cross River State, the study captured two major tourism hotspots of Calabar and Obudu Mountain Resort. Calabar, the capital city of Cross River State, is located in the Southern part and comprises of the Calabar Municipality and Calabar South Local Government Area. On the other hand, the Obudu Mountain Resort in Obanliku Local Government Area lies at the extreme northern fringes of the state. It is at an elevation of about 5,700ft (1,576meters) above sea level. This area is Nigeria’s premier tourism destination, beautifully developed and structured for business, leisure, travelers and tourists. The Obudu Mountain Resort is about 388 kilometers from Calabar and is awash with expansive beauty, excellent quality services and awesome facilities which one need to experience at least once in a lifetime.
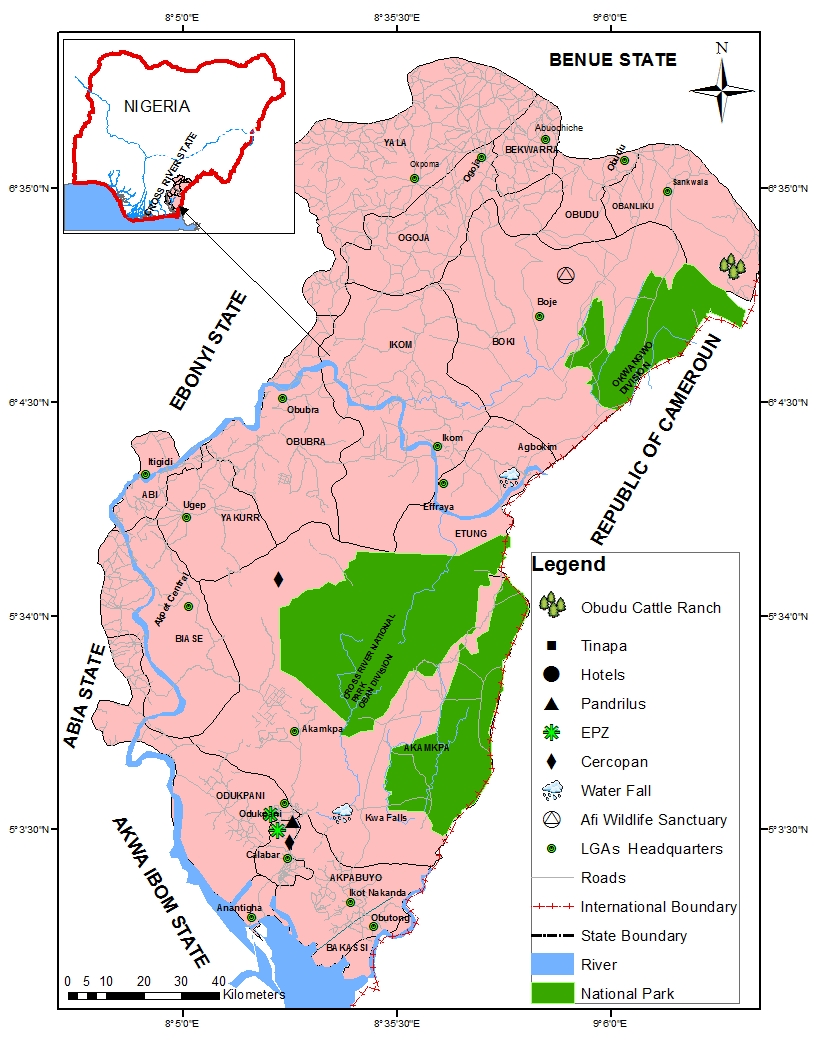 | Figure 1. Map of Cross River State, Nigeria showing major tourists’ attractions |
4. Materials and Methods
- The survey design was adopted for this study. According to Decrop (1999), the survey design permits the examination of the independent variables and their possible relationship with the dependent variable. The study is aimed at assessing the influence of marketing strategies on tourists’ choice of destination. The study relied mainly on secondary information on tourists’ arrivals from Cross River State Tourism Bureau (CRSTB), Cross River State Tourism Development Commission; private tourism services practitioners such as Remlords Tours and Car Line Services, Executive Travels Nigeria, Transcorp Metropolitan Hotel, African Sun Hotel and Ponet Cable Car and Water Park at the Obudu Ranch Resort. Other data was derived through questionnaire survey, interviews, content analysis of tourism brochures and direct field observation. Two sets of questionnaires were administered; one set was administered to tourists in the sampled areas. The questionnaire also captured certain questions that were presented in likert scale format which were used to assess the influence of marketing strategies on tourists’ choice of destination in the area. The scale ranges from one to five, where five = very influential, 4 = influential, 3 = moderately influential, 2 = least influential and 1 = not influential. The other set of the questionnaire was administered to Tourism administrators such as staff of Government Tourism Organisations (GTOs) and Private Tourism Services Provider (PTSPs) who are involved in marketing and promotions.Interviews were conducted with top executives and heads of marketing departments of GTOs and PTSPs in the study area. Content analysis was also used to analyse brochures of tour operators with the aim of examining the nature of attractions and influence of marketing strategies. The sampled population was basically tourists and staff of government tourism organisations (GTOs) and private tourism service providers (PTSPs) who are involved in marketing communication tourism attractions of the study area. The respondents were sampled in Calabar and Obudu Mountain Resort which constitute the tourism hotspots of the study area. A total of 215 respondents representing tourists and staff of GTOs and PTSPs in the area were sampled. This sample population is made up of 160 tourists who were found as at the time of this study and 55 staff of GTOs and PTSPs in the study area.Data collected were analysed and presented using descriptive and inferential statistics. The descriptive techniques include the use of tables, graphs, charts, means, standard deviation and simple percentages. The inferential statistics such as one way Analysis of Variance (ANOVA) was used to determine the differences in the level of attractiveness of tourism sites and events in the destination area, while the Kruskal-Wallis Test (H) was applied to compare the mean difference in the level of influence of tourism marketing strategies on tourists’ choice of destination.This variation was determined based on the responses by the individual tourists on the likert scale who indicated to have either been influenced by one or more strategies to visit the destination.
5. Result and Discussions
- Based on the focus of this study, the result and discussion of findings were presented accordingly.
5.1. Socio-demographic Characteristics of Tourists’ Population
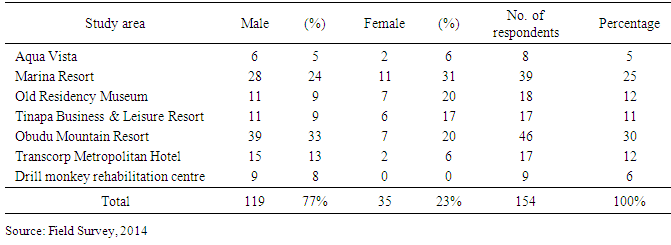
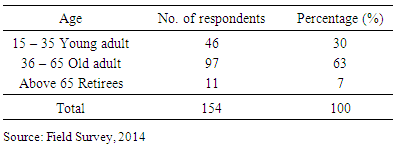
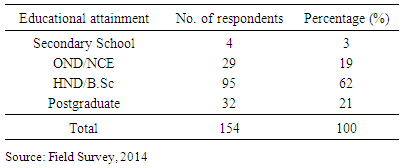
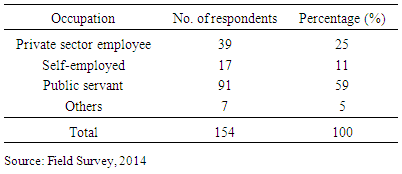
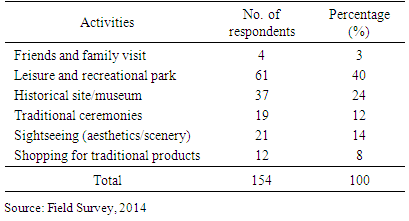
- The study examined the socio-demographic characteristics of the tourists’ population in terms of sex differential(s), age, educational level and nature of employment. The intention was to understand the attributes of tourist who is at liberty for adventure and taking opportunities through marketing strategies in selecting or choosing tourism destinations in the destination.The result in Table 1 shows that out of 154 sampled tourists, 119 were males representing 77 percent and 35 were females representing 23 percent. This result indicated that more male tourists visited the destination area than females. There are variations in the various destination locations visited by the tourists. For instance, there were more male visitors in Obudu Mountain Resort (33 percent) than those who were in Aqua Vista (5 percent). Furthermore, a total of 11 female tourists representing 31 percent were in Marina Resort than those who went to Transcorp Metropolitan Hotel and Aqua Vista which recorded 2 each, representing 6 percent respectively.
|
|
|
|
|
5.2. Attractiveness of Various Tourism Destinations in the Study Area
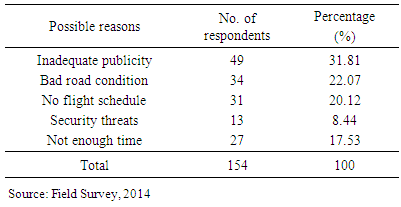
- The attractiveness of various tourism destinations on visitors in the study area in terms of tourists’ awareness level of attractions, nature of activities participated by tourists, destination attractions visited by tourists, and level of attractiveness of tourism destination areas were examined. Others include commonly used local transport by tourists, type of accommodation used during their stay and possible reasons for not visiting other attractions/events in the study area. The results are presented accordingly.In Figure 2, the finding shows that 128 respondents representing 83 percent of the total sampled confirmed by indicating that they were fully aware of tourism destination attractions in study area, while 26 respondents representing 17 percent said they had no previous awareness before the period of this study. The confirmation of the destination attractions by a significant population of tourists is an indication of the level of publicity through tourism marketing strategies and communication tools. It was observed that the 17 percent of tourists who did not acquire information about the destination attractions before visits were mainly those who participated in conferences held in Cross River State and a few indigenes from within Nigeria who are conversant with the development of tourism sector and destination attractions in the study area.
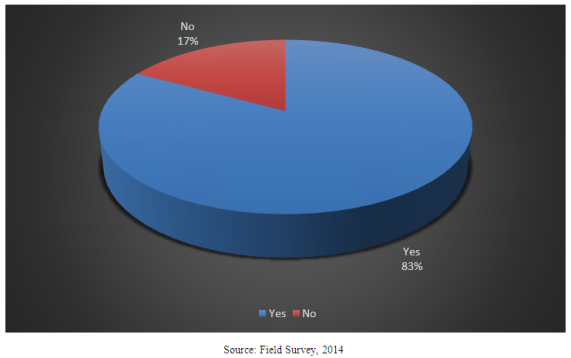 | Figure 2. Awareness of tourism destination attractions in the study area |
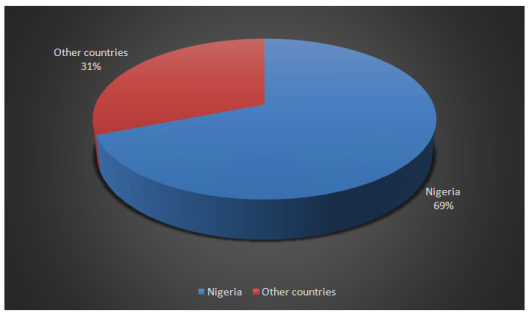 | Figure 3. Where tourists acquired information about destination attraction |
|
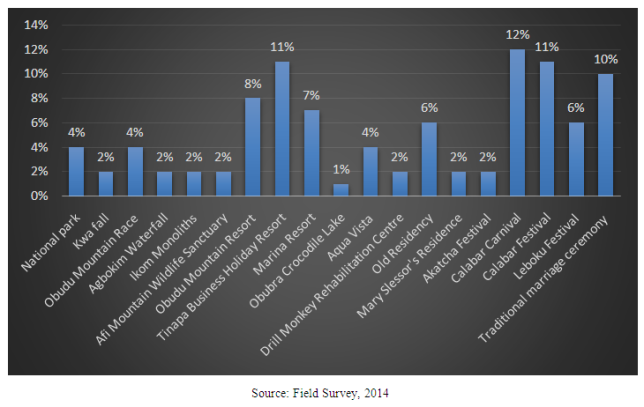 | Figure 4. Attractions and Events visited by Tourists |
5.3. Level of Attractiveness of Tourism Destination Attractions in the Area
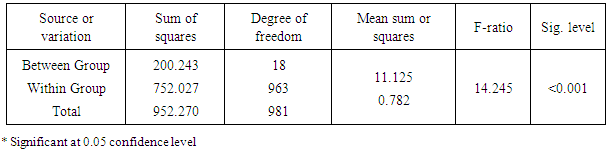
- The study using the likert scale questionnaire assessed the level of attractiveness of tourism destination attractions. The scale was 1-5, where 5 = very attractive, 4 = attractive, 3 = moderately attractive, 2 = least attractive and 1 = not attractive. Based on scoring responses, the values were summed up and result presented accordingly. The analysis from 19 tourism attractions sampled which generated 978 multiple responses from tourists. Table 7 shows that on aggregate all tourism attractions and events are very attractive to the tourists. This accounted for 528 responses representing 54 percent. Details of the analysis reveals that Obudu Ranch Resort, Marina Resort, Obudu Mountain race event, Calabar Carnival and Calabar Festivals are first order very attractive products in the destination. They accounted for from 65 percent to 91 percent of the tourist responses to the level of attractiveness. Also, the tourists considered Tinapa Business and Holiday Resort (56%), Leboku New Yam festival (56%) and traditional ceremonies (51%) as the second order very attractive products in the destination area. However, the study observed that few attractions in the area are not attractive and therefore received low responses from the tourists. It was noted that, the non-attractiveness of some sites was based on inadequate publicity, while the most attractive sites are products that are covered sufficiently by different tourism marketing, communication tools in the area. Also, it was indicated that all the tourists sampled acknowledged the availability of the attractions and events in the destination area. This implies that, no attraction site identified in the study area that has no national or international recognition. Therefore, encouraging the promotion of these attractions in the destination area will eventually increase the population of tourists utilizing them vis-à-vis ensuring development and economic growth of these areas.The study further determined the differences in the level of attractiveness of tourism attractions and events in the destination area, using one-way analysis of variance (ANOVA). The data in Table 7 was used for the analysis and result in Table 8 was produced.
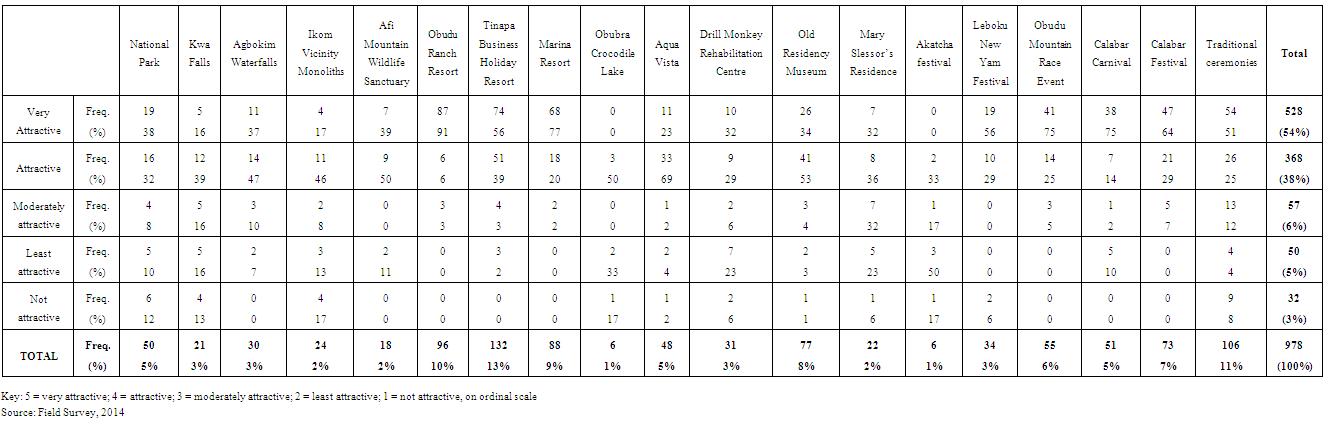 | Table 7. Level of attractiveness of tourism sites and events on tourists |
|
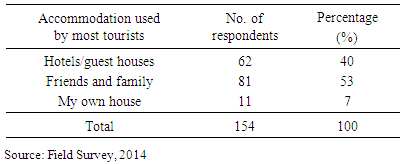
5.4. Tourism Destination Services in the Area
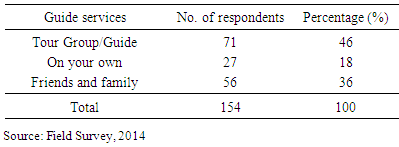
- The level of attractiveness of tourism products in a given destination is also attributed to certain services that ease and provide comfort to the tourist. The movement of tourists to specific attractions in a destination site was aided by various persons within the vicinity. Table 8 shows that 71 tourists representing 46 percent engaged the services of Tour Group/Guide, 27 of them representing 18 percent were moving on their own, while 56 tourists representing 36 percent were aided by friends and family.
|
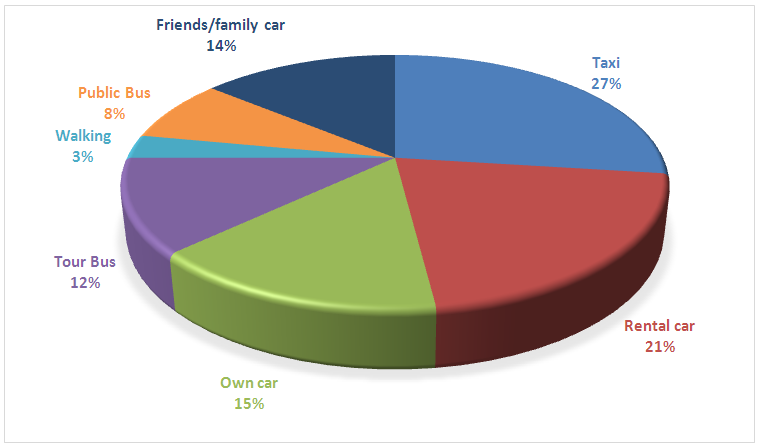 | Figure 5. Commonly used local transport by tourists |
|
|
5.5. Tourism Marketing Strategies that Influences Tourists’ Choice Destination
- The study evaluated the tourism marketing strategies that have been employed in the study area by Government Tourism Organisations (GTOs) and Private Tourism Services Providers (PTSPs) in their bid to publicize tourism attractions in Cross River State and also influence tourists’ choice of the destination. Tourists’ opinion on possible tourism marketing strategies that influence their choice of visiting the area were identified for the tourists to assess and confirm which of these strategies is more influential. The strategies were packages used by various tourism marketing communication methods to showcase the destination.The result in Figure 6 shows that 105 tourists representing 21 percent said they were influenced by Paradise in the Clouds, 93 tourists representing 19 percent affirmed that they were influenced by Security/Safe destination. The Paradise in the Cloud is a programme that is used to showcase the beautiful attributes of Calabar as a destination. It has appealing component that attracts tourists into the study area. Similarly, tourists need security and safe environment for leisure and recreation. This explains why significant variation was observed in tourists visit to attraction sites. Furthermore, 91 tourists representing 18 percent indicated that they were influenced by festivals/events. This was followed by 81 tourists representing 16 percent for Meet Me in Cross River (Meeting Incentives-MICE). Also, 75 tourists representing 15 percent said they were influenced by Packaging (souvenirs/gift items), while 53 visitors representing 11 percent upheld the opinion that Destination events influenced their choice of the study area. The packaging of these programmes influenced the tourists’ decision of choosing a destination based on their understanding, activities involved, clarity and the appealing nature of the strategies.
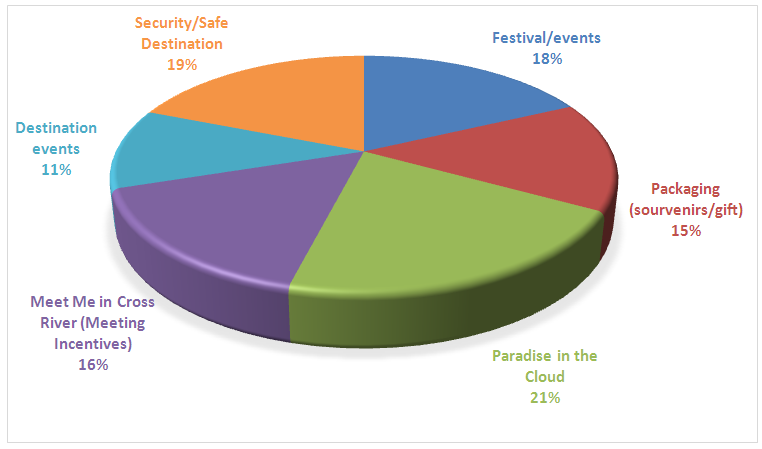 | Figure 6. Tourists' opinion on tourism marketing strategies that influenced their choice of visiting attraction sites |
5.6. Assessing the Level of Influence of Tourism Marketing Strategies on Tourists’ Choice to Visit the Study Area
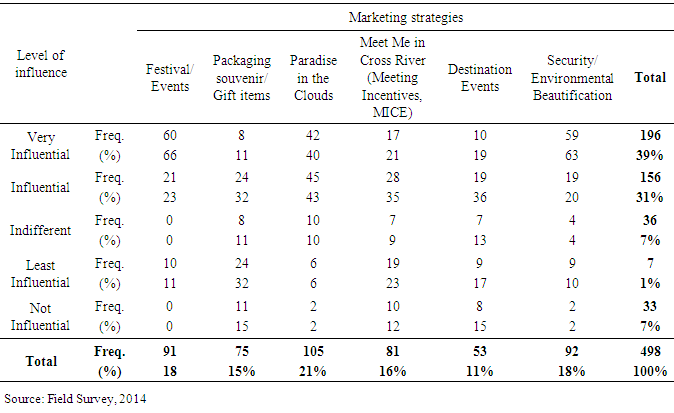
- The study also assessed the opinion of the tourists on the levels of influence of tourism marketing strategies on their decision to visit an attraction using likert scale questionnaire, where 5 = very influential, 4 = influential, 3 = moderately influential, 2 = least influential and 1 = not influential. The result of analysis from six marketing strategies influencing tourists’ choice of destination shows that on aggregate all the marketing strategies are very influential to tourists. This accounted for 196 responses representing 39 percent. Detail analysis reveals that festivals/events and security/ environment beautification were rated very high accounting for 66 percent and 63 percent respectively (Table 12). This was followed up by Paradise in the Clouds. The high rating of these marketing strategies is dependent on the quality of packaging of the programmes in marketing communication methods such as radio and television, internet, magazine/newspapers, billboards, handbills, banners, posters etc. about the destination attractions.
|
|
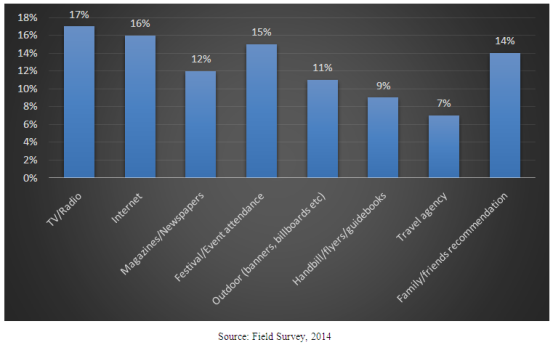 | Figure 7. Distribution of tourists by available sources of information to them about tourism attractions/events in the study area |
6. Conclusions
- As an emerging economic activity in the face of dwindling oil prices in Nigeria, tourism has become a driving force of development especially in Cross River State. The awareness of the natural and cultural tourists’ resources of the destination area is necessary to increase the population of tourists. Tourism marketing strategies are therefore essential tools to present or advertise the attraction sites of the study area to people outside Cross River State and Nigeria. The level of attractiveness of the tourism attraction sites in the study area was dependent on the effectiveness and quality of marketing strategies. Also, from the findings, the study discovered that the level of influence of tourism marketing strategies affect the tourists’ choice of destination to visit. Therefore, since the increase of tourists’ population has multiplier effect on the economic benefits, infrastructural development and livelihood improvement, more tourists’ activities needs to be encouraged and promoted. Although, the study had confirmed that there were some marketing and promotional strategies already in place, it was pertinent to note that more needs to be done to ensure more awareness of the attractiveness and uniqueness of the destination. Consequently, the tourism industry was acknowledged to play a major role in the development of the State based on the increasing number of tourists’ and tourists’ activities observed in the area as most tourists’ visited the destination to spend their leisure and holiday periods in recreational parks and historic sites within the State.
7. Recommendations
- Based on the study findings, the study recommended that more persuasive and appealing marketing strategies that will have great influence on the tourists’ choice of destination be put in place by making people within the State, Country and even outside Nigeria see reasons why they should visit the destination to be part of the tourism experience it offers and this can be made very effective through the print, electronic and social media. Also, government should reinforce its commitment towards tourism marketing by emphasizing more of the festivals and events as effective communication medium for marketing attractions in Cross River State.