Ummay Kulsum1, Tariqul Islam1, Abu Sayed2, Md Shahin1, Md Naimul Islam1
1Department of Wet Process Engineering, Textile Engineering College, Zorargonj, Chittagong, Bangladesh
2Department of Wet Process Engineering, Textile Engineering College, Noakhali, Bangladesh
Correspondence to: Ummay Kulsum, Department of Wet Process Engineering, Textile Engineering College, Zorargonj, Chittagong, Bangladesh.
| Email: |  |
Copyright © 2024 The Author(s). Published by Scientific & Academic Publishing.
This work is licensed under the Creative Commons Attribution International License (CC BY).
http://creativecommons.org/licenses/by/4.0/

Abstract
When judging the usefulness and attractiveness of many items, color plays a significant role, particularly in the textile sector. By overcoming the shortcomings of spectrophotometers, the DigiEye color measuring device improves the accuracy of textile color determination. Although it has been used to test textile color, this device is mostly used to analyze foodstuffs and polymers. This research aims to quantify and examine the color characteristics of dyed knit materials using DigiEye technology. The properties of knit fabrics were measured using a DataColor spectrophotometer and a DigiEye colorimeter, enabling a comparison of the data obtained from these two instruments. Subsequently, the collected data were used to establish a correlation coefficient between the CIE and CMC values obtained from the spectrophotometer and the DigiEye. Correlation analysis is used to determine the degree of association between various variables. The study showed that the DigiEye and spectrophotometer results were significantly correlated. Furthermore, the values of all color characteristics acquired by using a spectrophotometer and DigiEye demonstrate a significant level of resemblance. Nevertheless, it is crucial to acknowledge that this research, in isolation, could not provide enough substantiation. Additional investigation is required to determine the color discrepancy between the spectrophotometer and DigiEye.
Keywords:
Spectrophotometer, DigiEye, Color, CIE, CMC, Knit fabric
Cite this paper: Ummay Kulsum, Tariqul Islam, Abu Sayed, Md Shahin, Md Naimul Islam, Analyzing the Differences Between Spectrophotometer and DigiEye Assessments of Knit Fabric, International Journal of Textile Science, Vol. 13 No. 2, 2024, pp. 11-21. doi: 10.5923/j.textile.20241302.01.
1. Introduction
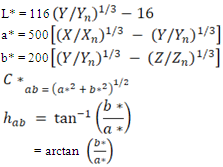
Color plays a crucial role in assessing the visual appeal and practicality of many items, particularly those in the textile sector [1]. The bulk of woven and knit fabrics, particularly those used for apparel and ornamental purposes, are dyed or printed with different colors [2]. Moreover, it plays a crucial role in material manufacturing and often determines the commercial success of a product. Fabric quality is less important than color and design in textile sales [3]. Most of the time, colors in the clothing business are judged by how they look. Understanding color measurement is crucial for the textile business to specify communicative quantities, minimize metameric recipes, quantify color differences, and establish pass/fail criteria [4]. In the textile sector, colors are often assessed by visual means. Researchers constructed viewing cabinets and light rooms using conventional illuminants to circumvent the problem that daylight often changes. In that manner, samples could be examined under uniform illumination and their colors could be compared to a reference [5]. Nevertheless, visual color evaluations are hindered by the significant variability in outcomes caused by subjectivity. The HVI (High Volume Instrument) technique is widely used worldwide for measuring the color of cotton [6]. When it comes to other textile goods, spectrophotometers are widely recognized as the primary and widely used instrument. By comparing the samples to a standard, spectrophotometers determine the samples' spectral reflectance and spectral transmittance in the visible light spectrum [7]. The apparent color is significantly influenced by the viewing angle and illumination circumstances [8]. The design of color-measurement equipment is significantly influenced by its geometric properties [9]. Spectrophotometers are often constructed using two different geometries: d/8 and 45/0. According to the CIE specifications, the first number represents the arrangement of the light source, while the second number reflects the arrangement of the observer [10]. Spectrophotometers provide color data in the L*a*b* color space, which was created by the CIE (Commission Internationale de l'Éclairage). Based on the CIE XYZ color space, the most popular standardized color scheme is created by a mathematical adjustment. The following color coordinates may be obtained using the spectrophotometer [2]:• Lightness (L*) • Chromaticity coordinates: a* (green/red), b* (blue/yellow),• The degree to which a color differs from a grayscale of equivalent luminance is measured by chroma, which is abbreviated as C* [11].• The H-Hue angle is a visual characteristic that causes an area to seem either green, blue, red, or a mix of neighboring pairings of these hues in a circular pattern [11].Spectrophotometer used for measuring the color of flat samples such as plain fabric samples. However, the tension arises when users try to measure many textured or patterned substrates as they cannot get accurate repeatable results.Several reports discuss the application of DigiEye technology in identifying textile color. The DigiEye digital color measurement system, produced by VeriVide Ltd. in the United Kingdom, employs the Adobe RGB (1998) color space [12]. DigiEye is applicable across several industries, including sectors such as food and beverage, textiles, polymers, and composite materials [13]. It is a computerized digital camera system designed for precise color measurement and the capture of high-quality, consistent pictures [14]. Moreover, it allows for the precise capture of color-accurate photographs of 2D and 3D samples, which may then be saved as digital files [15]. DigiEye can get colorimetric information from samples with surfaces that are very tiny, uneven, or curved. The sample was photographed using a calibrated digital camera from the Nikon D-series. The color of the specified region of the analyzed sample was assessed using the DigiPix feature [15]. Quantifying the color elements of patterns and prints that have limited repetition, thin strips, tiny spots, small checks, and other forms poses a much greater challenge. DigiEye is capable of distinguishing the color of multi-colored fabric, which a spectrophotometer is incapable of doing. In addition, it cannot automatically send the client the color-matching result; however, this is possible with DigiEye. Lau et al. found a significant connection between the color coordinates obtained from the spectrophotometer and DigiEye for textiles [16]. In our investigation, we used knit materials to conduct a comparison between the results obtained from the DataColor spectrophotometer and the DigiEye colorimeter, as opposed to the woven fabrics employed by Matusiak et al. Their examination revealed a statistically significant correlation between the data collected from the spectrophotometer and the DigiEye. Our study also includes comparisons performed utilizing data from both the spectrophotometer and the DigiEye. This study aims to use DigiEye technology to measure and analyze the color features of dyed knit materials. Additionally, a comparison analysis is conducted using data acquired from a spectrophotometer and a DigiEye. Furthermore, this study revealed a coefficient correlation between the Spectrophotometer and DigiEye CIE and CMC values.
2. Materials and Method
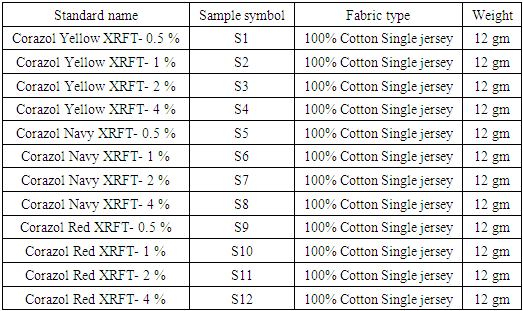
The assessment of color was performed on 100% cotton knit fabric dyed with three different colors Red, Yellow, and Navy. Four different shades of fabric were produced from each color. Since there are four fabrics, each with four different shades of every hue, there will be a total of twelve fabric standards. No samples were generated in this research. Each cloth of a specific color was separately placed in both a spectrophotometer and a DigiEye colorimeter machine to establish a standard for determining the CIE value (L*, a*, b*, C*, h*). After obtaining the CIE values from the standards, the identical fabrics were placed in both machines as samples to evaluate the color comparison (CMC values) with the standards, aiming to minimize the color discrepancy.The shade differences were assessed between several shades of the same color, such as the differences in color between Yellow 0.5% and Yellow 1%, Yellow 0.5% and Yellow 2%, and Yellow 0.5% and Yellow 4%. In this color assessment, fabrics with a shade of 0.5% were selected as the reference standard, while fabrics with other hues were chosen as the samples. The identical method was also performed for two other colors using both the spectrophotometer and DigiEye equipment.Table 1. Table of basic characteristics of the tested fabrics
 |
| |
|
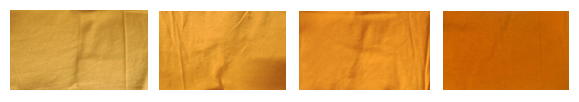 | Figure 2.1. Sample Yellow (0.5%, 1%, 2%, 4%) |
 | Figure 2.2. Sample Navy (0.5%, 1%, 2%, 4%) |
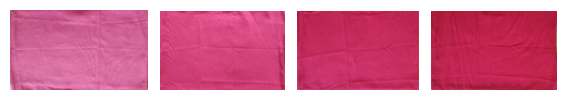 | Figure 2.3. Sample Red (0.5%, 1%, 2%, 4%) |
The evaluation was conducted using a DataColor spectrophotometer and a DigiEye, employing the standard CIE illuminants D65 and A. The illuminant D65 represents the average artificial daylight, with 'D' referring to daylight. The color temperature of this artificial daylight is 6500°K. The illuminant A corresponds to tungsten light with a color temperature of 2856°K. Color estimation was conducted for a 30 mm-diameter area using a 10° observer. A single-color estimation was conducted for each cloth and sample. The final results were collected and disclosed for the CIE calorimetric properties (L*, a*, b*, C*, h*) and CMC values (DL*, DC*, DH*, DE). The DigiEye machine is capable of capturing multispectral images of the sample under examination, providing detailed and diverse information on a specific area inside the image. Before this, the illuminants D65 and A were utilized in the spectrophotometer and DigiEye machine to evaluate the color difference between the standard and samples. The estimation was conducted using a 10° observer. Prior to color assessment, both the device spectrophotometer and DigiEye calorimeter underwent calibration to ensure accurate performance according to the specific standard CIE illuminant.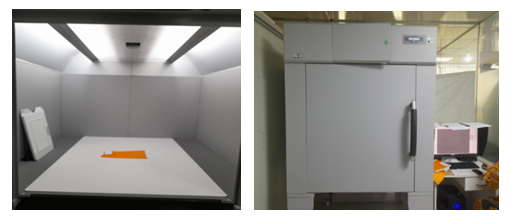 | Figure 2.4. DigiEye machine with a computer |
2.1. Spectrophotometer Measurement
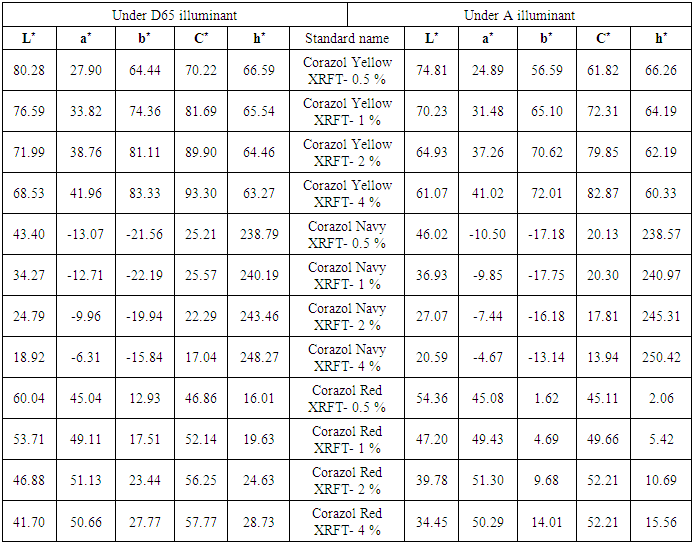
The standards and samples, which are made of the same fabrics, are positioned between the sample holder and the front panel door. Both standards and samples must be placed in a folded manner. Paying meticulous attention is crucial when situating the sample and reference textiles to get a precise measurement. The sample and standard must fully encompass the aperture opening. We used the following CIE and CMC values (L*, a*, b*, C*, h*, DL*, DC*, DH*, and DE*) to estimate the standard and sample fabrics, and we recorded these details. The same method was performed on both the standard and sample, ensuring appropriate calibration.Table 2. Table of CIE values of tested fabric from spectrophotometer (under D65 and A illuminant)
 |
| |
|
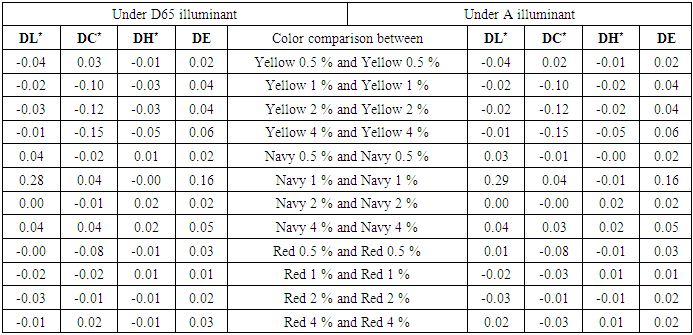
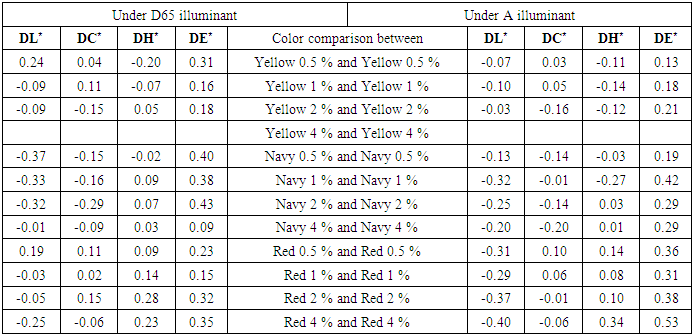
Table 3. Table of color comparison values of tested fabric from spectrophotometer (under D65 and A illuminant)
 |
| |
|
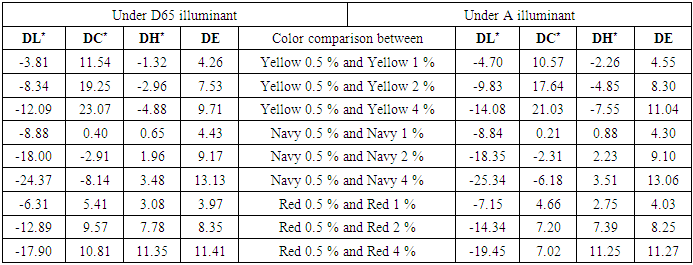
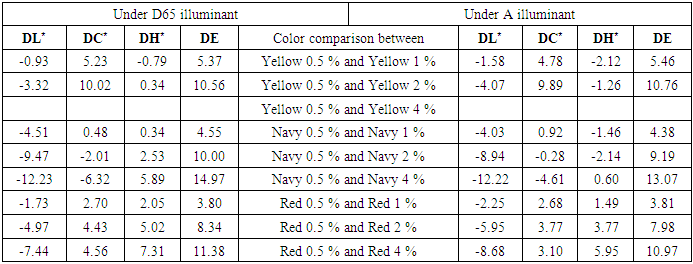
Table 4. Table of color comparison values between different shades of the same color from spectrophotometer (under D65 and A illuminant)
 |
| |
|
2.2. DigiEye Measurement
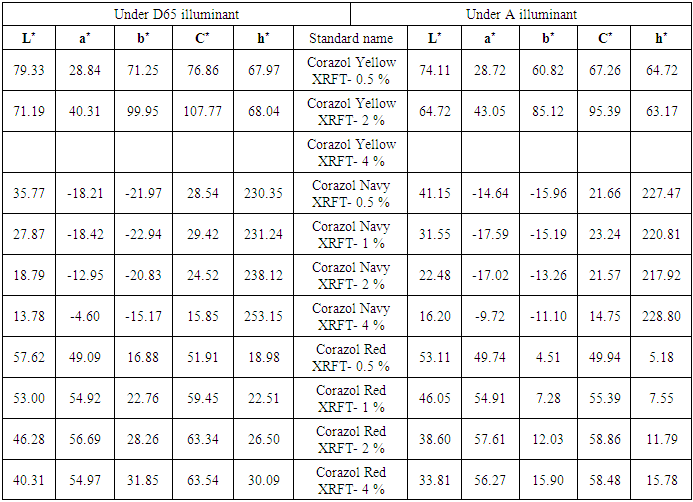
Initially, the standard fabrics are stored in a cabinet to estimate their color. The cabinet is illuminated by a D65 illuminant. The device was adjusted to function optimally under the specified illuminant, D65. Subsequently, an image of the fabric being evaluated is captured by a calibrated high-tech camera and analyzed using DigiEye software. The estimation is conducted by utilizing the DigiPix feature on the selected area of the fabric under examination. The chosen region might be either a rectangle or a circular tool. The same method was likewise conducted for the samples.Note: During the color assessment, DigiEye failed to detect the shade yellow at 4% and hence could not generate the CIE values for the fabric of that shade under both D65 and A illuminants. The cause of this was either a software malfunction or an unidentified factor.Table 5. Table of CIE values of tested fabric from DigiEye (under D65 and A illuminant)
 |
| |
|
Table 6. Table of color comparison values of tested fabric from DigiEye (under D65 and A illuminant)
 |
| |
|
Table 7. Table of color comparison values between different shades of the same color from DigiEye (under D65 and A illuminant)
 |
| |
|
Upon completing the color assessment technique, the CIE values (L*, a*, b*, c*, h*) and CMC values (DL*, DC*, DH*, DE) were acquired and recorded (as indicated in the tables above). Subsequently, all the available data was utilized to determine the correlation coefficient between the CIE and CMC values of the spectrophotometer and DigiEye. It is possible to do a correlation analysis to find out how strongly related multiple variables are. Since the experiment focused on two particular machines, there were two variables involved. The spectrophotometer provided the CIE and CMC values, which were considered the first set of variables. The DigiEye machine provided the CIE and CMC values, which were considered the second set of variables. Lastly, the following equation was used to obtain the correlation coefficient [17]: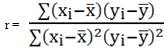 Where, r = Correlation Coefficientxi = CIE values from spectrophotometer
 = Average of CIE values from spectrophotometeryi = CIE values from DigiEye
 = Average of CIE values from DigiEye
3. Results and Discussions
3.1. Color Coordinates
Figure 3.1 – 3.9 displays the comparison of color coordinates obtained using a Spectrophotometer and DigiEye. The values of all color parameters measured by the Spectrophotometer and DigiEye are remarkably close. 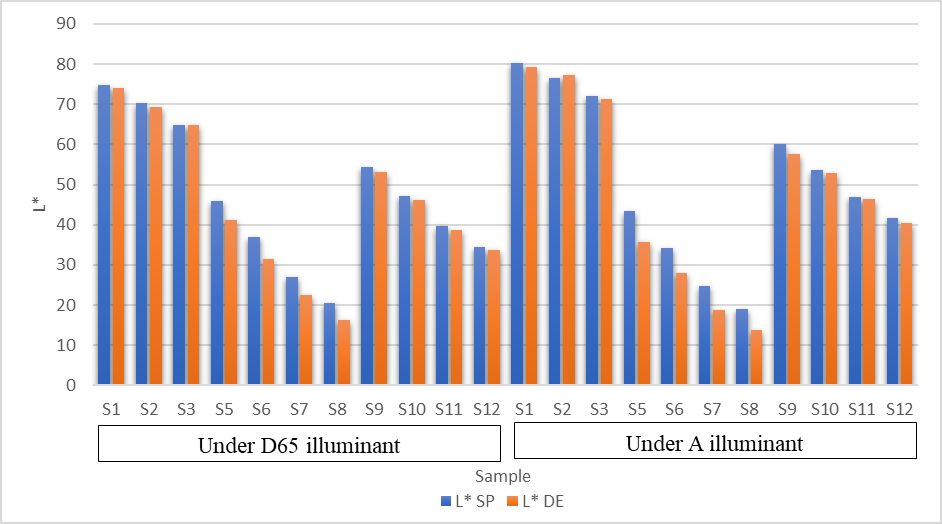 | Figure 3.1. Comparison of lightness (L*) results from Spectrophotometer and DigiEye for both under D65 illuminant and A illuminant |
As anticipated, the sample with the highest lightness was sample 1 (2nd Corazol Yellow XRFT – 0.5%) under A illuminant for both the Spectrophotometer and DigiEye, with respective values of 80.28 and 79.33. Conversely, the samples with the lowest lightness were sample 8 (2nd Corazol Navy XRFT, 4%) under A illuminant for both the Spectrophotometer and DigiEye, with respective values of 18.92 and 13.78. For 22 samples, the brightness readings obtained from the Spectrophotometer were marginally greater than those from the DigiEye.The Spectrophotometer and DigiEye yielded comparable results for the a* chromaticity coordinates.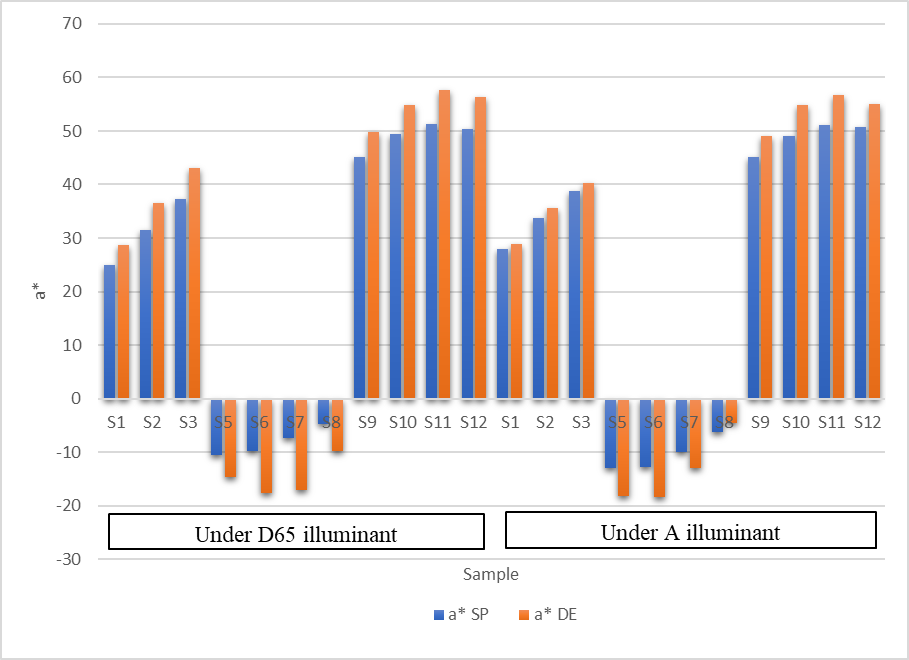 | Figure 3.2. Comparison of a* chromaticity coordinates results from Spectrophotometer and DigiEye for both under D65 illuminant and A illuminant |
Sample 11 (1st Corazol Red XRFT – 2%) under D65 illuminant for DigiEye has the greatest value of 57.61, while sample 6 (2nd Corazol Navy XRFT – 1%) under A illuminant for DigiEye has the lowest value of 18.42.For the majority of cases, the a* chromaticity coordinate findings obtained from the Spectrophotometer were slightly greater than those obtained from the DigiEye for 22 samples.For sample 8 (1st Corazol Navy XRFT, 4%) under D65 illuminant, significant differences were seen in the b* and c* color coordinates between the Spectrophotometer and DigiEye. 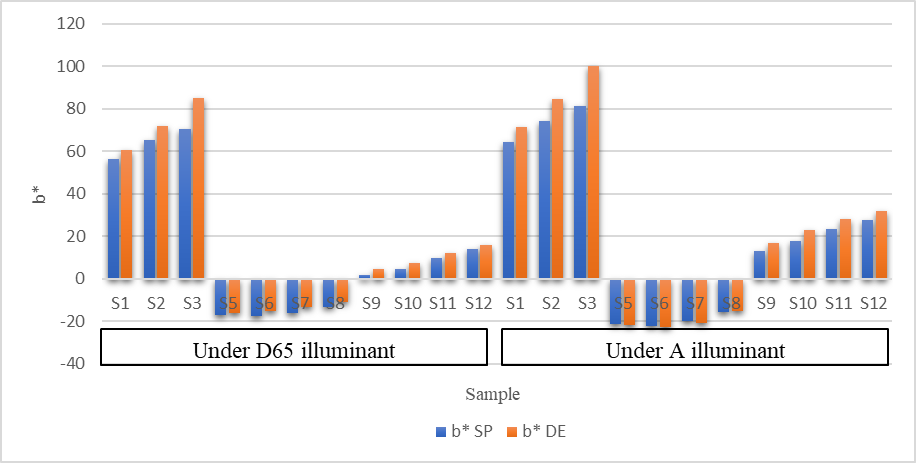 | Figure 3.3. Comparison of b* chromaticity coordinates results from Spectrophotometer and DigiEye for both under D65 illuminant and A illuminant |
Sample 3 (2nd Corazol Yellow XRFT – 2%) under A illuminant for DigiEye has the greatest value of 99.95, while sample 6 (2nd Corazol Navy XRFT – 1) under A illuminant for DigiEye has the lowest value of 22.94.For the majority of cases, the b* chromaticity coordinate findings obtained from the Spectrophotometer were slightly greater than those obtained from the DigiEye for 22 samples.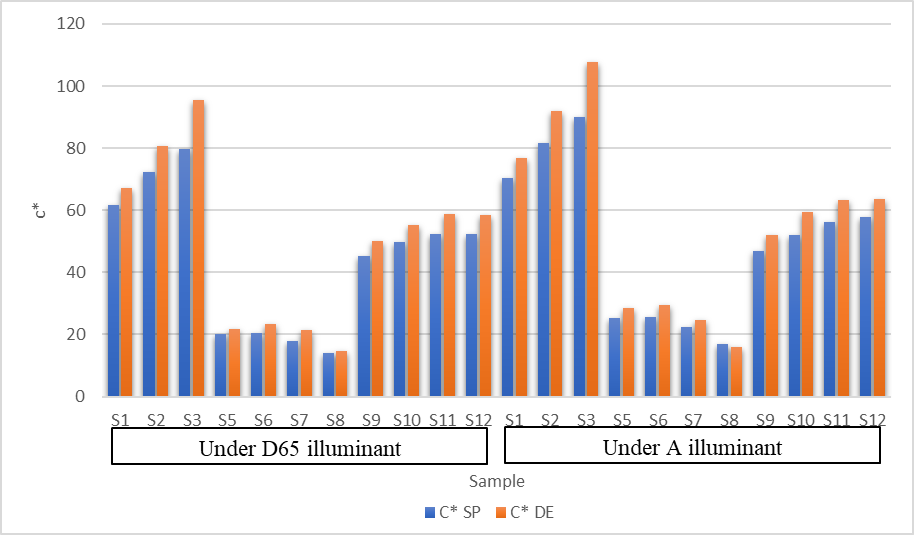 | Figure 3.4. Comparison of c* chromaticity coordinates results from Spectrophotometer and DigiEye for both under D65 illuminant and A illuminant |
However, while examining sample 8 (2nd Corazol Navy XRFT, 4%), there was a significant difference in the h* chromaticity coordinates when measured using both the Spectrophotometer and DigiEye under A illuminant. Sample 3 (2nd Corazol Yellow XRFT – 2%) under A illuminant for DigiEye has the greatest value of 107.77, while sample 8 (1st Corazol Navy XRFT – 4%) under D65 illuminant for Spectrophotometer has the lowest value of 13.94.For the majority of cases, the c* chromaticity coordinate findings obtained from the Spectrophotometer were slightly greater than those obtained from the DigiEye for 22 samples.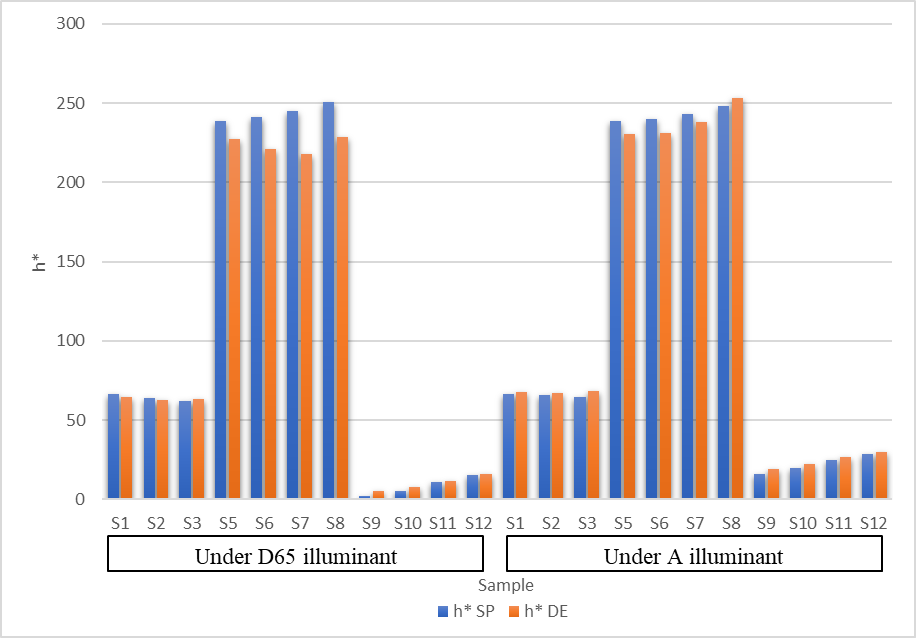 | Figure 3.5. Comparison of hue angle (h*) results from Spectrophotometer and DigiEye for both under D65 illuminant and A illuminant |
Sample 8, which is the 2nd Corazol Navy XRFT with a concentration of 4%, has the greatest value of 253.15 when measured under A illuminant using DigiEye. However, sample 9, which is the 1st Corazol Red XRFT with a concentration of 0.5%, has the lowest value of 2.06 when measured under D65 illuminant using a Spectrophotometer. For 22 samples, the hue angle results obtained from the Spectrophotometer were marginally greater than those from the DigiEye. 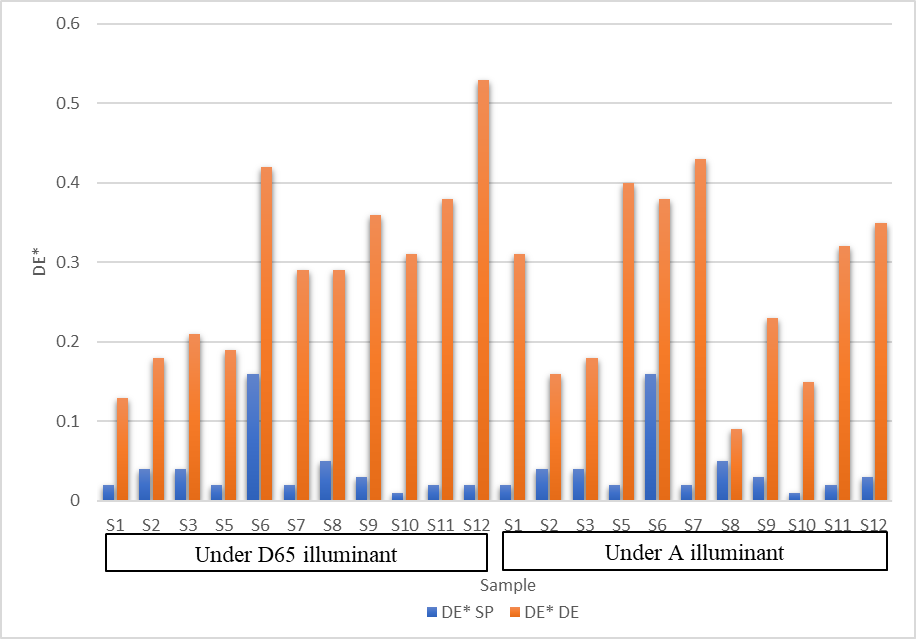 | Figure 3.6. Comparison of Color difference (DE*) results from Spectrophotometer and DigiEye for both under D65 illuminant and A illuminant |
The sample 12 (1st Corazol Red XRFT, 4%) was observed under D65 illuminant for DigiEye and had the maximum value of 0.53. On the other hand, samples 10 (1st and 2nd Corazol Red XRFT-1%) were observed under D65 and A illuminants for the Spectrophotometer and had the lowest value of 0.01.For 38 samples, the color difference results obtained from the Spectrophotometer were marginally greater than those obtained from the DigiEye.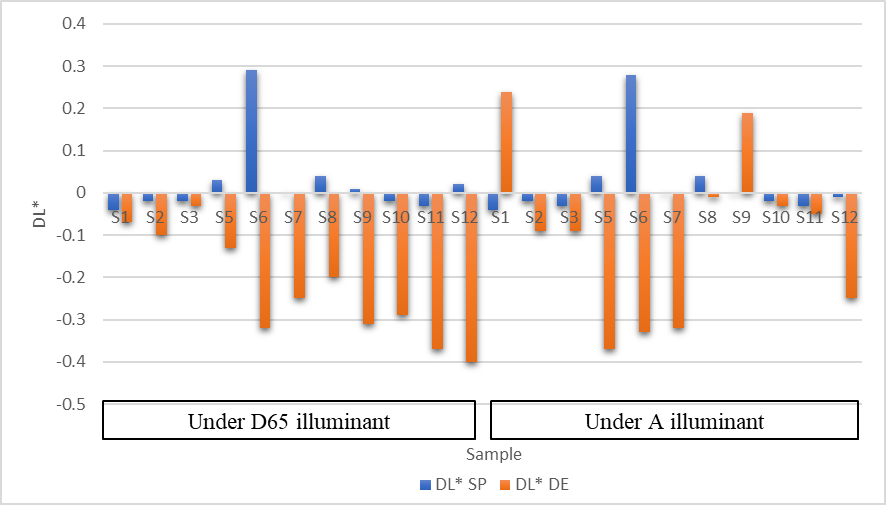 | Figure 3.7. Comparison of Lightness difference (DL*) results from Spectrophotometer and DigiEye for both under D65 illuminant and A illuminant |
Sample 6 (1st Corazol Navy XRFT-1%) had the highest value of 0.29 when observed under D65 illuminant using a Spectrophotometer. However, sample 12 (1st Corazol Red XRFT-4%) had the lowest value of -0.40 when observed under D65 illuminant using a DigiEye.For 38 samples, the lightness difference readings obtained from the Spectrophotometer were slightly greater than those from the DigiEye.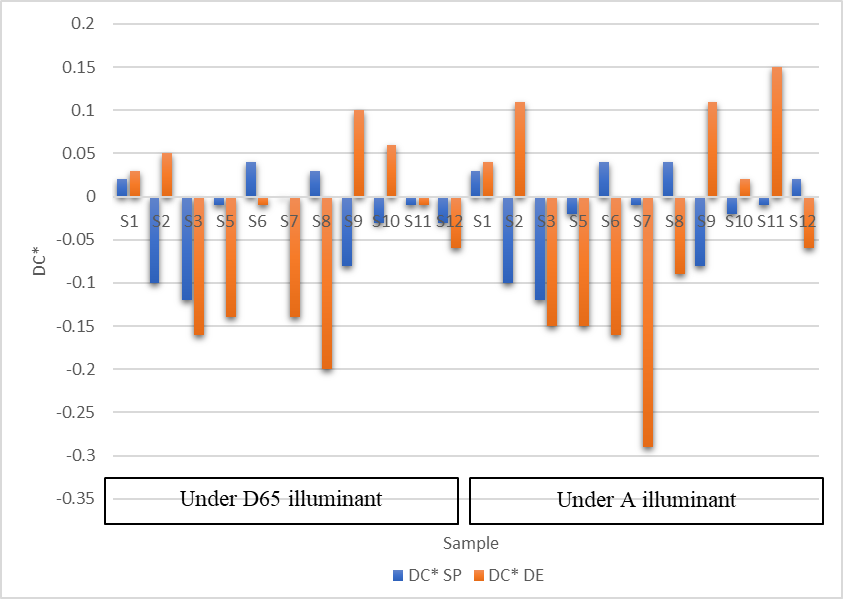 | Figure 3.8. Comparison of c* chromaticity coordinate difference (DC*) results from Spectrophotometer and DigiEye for both under D65 illuminant and A illuminant |
Sample 11 (2nd Corazol Red XRFT – 2%) under A illuminant for DigiEye has the greatest value of 0.15, while sample 7 (2nd Corazol Navy XRFT – 2%) under A illuminant for DigiEye has the lowest value of 0.29.For 38 samples, the c* chromaticity difference readings obtained from the Spectrophotometer were marginally greater than those from the DigiEye.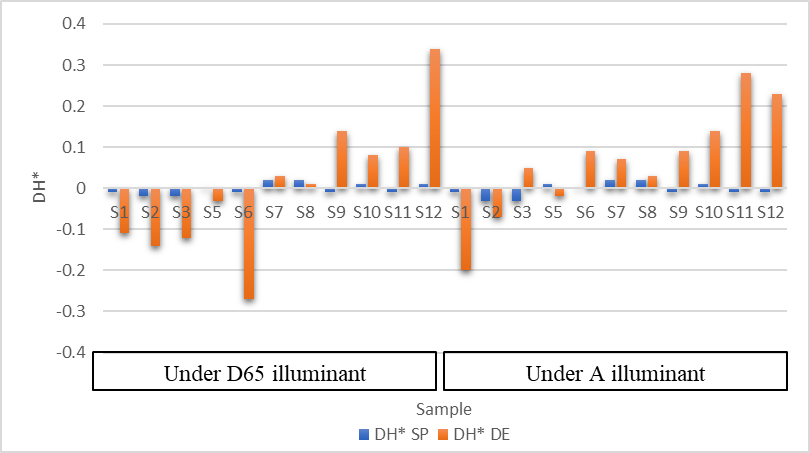 | Figure 3.9. Comparison of h* chromaticity coordinate difference (DH*) results from Spectrophotometer and DigiEye for both under D65 illuminant and A illuminant |
Sample 12, which is the 1st Corazol Red XRFT (4% under D65 illuminant for DigiEye), has the greatest value of 0.34. Conversely, sample 6, the 1st Corazol Navy XRFT -1% under D65 illuminant for DigiEye, has the lowest value of -0.27.For 38 samples, the hue angle difference readings obtained from the Spectrophotometer were marginally greater than those obtained from the DigiEye.These little inconsistencies are difficult to justify. DigiEye lacks standardized fabric measuring procedures; as a result, we have developed a novel approach that determines the size of the measurement area depending on the sample size after the first measurements. To ensure precision, it is recommended to refrain from placing the sample near the edges and instead position it in the middle with the appropriate dimensions. In the future, it will be essential to establish the methodologies used by DigiEye to quantify the characteristics of printed or colored yarn textiles. The following equation calculates linear correlation coefficients using graphical data [17]: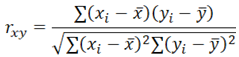 Here,
Here, Correlation coefficientxi
  CIE values from the Spectrophotometer both for under D65 illuminant and A illuminant
 Average of CIE values from the Spectrophotometer both for under D65 illuminant and A illuminantyi
  CIE values from DigiEye both for under D65 illuminant and A illuminant
 Average of CIE values from DigiEye both for under D65 illuminant and A illuminantThe limit of the correlation coefficient is -1 to + 1 i.e., -1 ≤ r ≤ +1
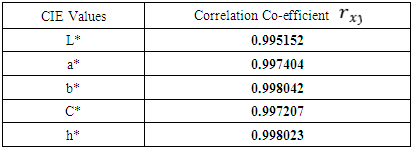
3.2. Results of the Project
We analyzed the data and found a strong connection between the color coordinate values acquired from the Spectrophotometer and DigiEye. The following correlation coefficients were found from both instruments for the CIE values:Table 8. Table of the correlation coefficients obtained from the Spectrophotometer and DigiEye’s CIE values
 |
| |
|
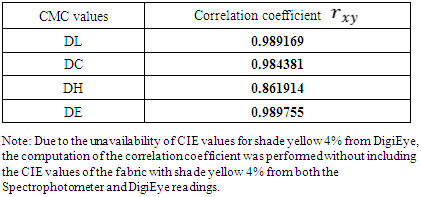
Again, the results of the correlation coefficient from these two instruments for both CMC values are shown below:Table 9. Table of the correlation coefficients obtained from the Spectrophotometer and DigiEye’s CMC values
 |
| |
|
3.3. Color Differences
Color identification is crucial to textile quality. The color difference assessment is done during textile material approval and color fastness measurement. A visual comparison under typical lighting circumstances (D65 and A) evaluates color changes.From this perspective, color differences should be assessed according to buyer or consumer suggestions and precisely and quantitatively. The following formula [18] can be used to calculate color differences using color coordinate data, L*, b*, and c* [19]: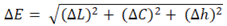 Here,
Here, Color difference as per CIE recommendation
  Lightness Differences

 To streamline the process of determining pass/fail outcomes, the aforementioned equations [20] are fine-tuned to accurately assess the disparity in color between closely related shades. The color disparities between measured and batch samples are typically minimal due to the evaluation of color variances in matching or approving fabrics of the same hue during the manufacturing process by buyer specifications.
3.4. Discussion and Findings
According to the correlation coefficient, the Spectrophotometer and DigiEye color evaluation CIE and CMC values are generally favorably associated. This study provided a color comparison chart with precise color variances that affected color coordinate values. The D65 and A illuminants' coordinate measurements with the Spectrophotometer and DigiEye showed a significant correlation. The Spectrophotometer and DigiEye color discrepancies were also strongly correlated.
4. Conclusions
This study presents specific variations in color appearance seen in color comparison charts, which in turn affected the measured values of color coordinates. A robust correlation has been established between the coordinate measurement outcomes obtained by the Spectrophotometer and DigiEye for both D65 illuminant and A illuminant. There was a significant correlation between the color differences that were calculated based on the findings obtained from the Spectrophotometer and DigiEye. During the color assessment, DigiEye failed to detect the shade yellow 4% and hence could not generate the CIE values for the cloth in shade yellow 4% under both D65 and A illuminant. The cause of this was either a software malfunction or an undetermined factor. This study determines the CIE and CMC relationships between Spectrophotometer and DigiEye color assessments. More research is needed to establish the color difference between the Spectrophotometer and the DigiEye. After conducting such a project, we recommend determining the reflectance (R%) curve and utilizing more light sources on more colored fabric of varying textures from both machines to detect any differences. DigiEye's failure to provide shaded yellow 4% CIE values should also be investigated.
References
| [1] | Raluca B. A REVIEW OF COLOR MEASUREMENTS IN THE TEXTILE INDUSTRY. Vol. XVII (1): 19-24. |
| [2] | Matusiak, M., et al. COMPARISON OF SPECTROPHOTOMETRIC AND DIGIEYE COLOUR MEASUREMENTS OF WOVEN FABRICS. Published online 2016: 53-59. |
| [3] | Rigg B. Colour description/specification systems. In: Total Colour Management in Textiles. Elsevier; 2006: 22-43. doi:10.1533/9781845691080.22. |
| [4] | Gangakhedkar NS. Colour measurement methods for textiles. In: Colour Measurement. Elsevier; 2010: 221-252. doi:10.1533/9780857090195.2.221. |
| [5] | Ngo LL. Colour matching system for colour approval of multi-component apparel. https://theses.lib.polyu.edu.hk/handle/200/6701. |
| [6] | Matusiak M, Walawska A. Important Aspects of Cotton Colour Measurement. FIBRES & TEXTILES in Eastern Europe. 2010; 18 (No. 3 (80)): 17-23. |
| [7] | Wyszecki G, Stiles W. Color Science: Concepts and Methods, Quantitative Data and Formulae. Vol 40. John Wiley & Sons; 2000. https://books.google.com.bd/books. |
| [8] | McDonald R. Keith McLaren —colorist and communicator. Published online 1993. https://doi.org/10.1111/j.1478-4408.1993.tb01529. |
| [9] | Hunter RS, Harold RW. The Measurement of Appearance. Published online 1987. |
| [10] | EDITION T. COLORIMETRY.; 2004. https://haralick.org/DV/cie_2004_colorimetry. |
| [11] | Luo Cheng, Ghorashi H, Duckett K, Zapletalova T, Watson M. Color Grading of Cotton Part II: Color Grading with an Expert System and Neural Networks. Textile Research Journal. 1999; 69(12): 893-903. doi:10.1177/004051759906901202. |
| [12] | Li Q, Zhang F, Jin X, Zhu C. Optimal yarn colour combination for full-colour fabric design and mixed-colour chromaticity coordinates based on CIE chromaticity diagram analysis. Coloration Technology. 2014; 130(6): 437-444. doi:10.1111/cote.12117. |
| [13] | DigiEye Colour measurement system and software. https://www.verivide.com/product-category/verivide-products/digieye-system/. |
| [14] | Hirschler R. Electronic colour communication in the textile and apparel industry. 2010; 1: 43-61. |
| [15] | Matusiak M. Digieye Application in Cotton Colour Measurement. Autex Research Journal. 2015; 15(2): 77-86. doi:10.2478/aut-2014-0036. |
| [16] | Lau LN, Kan CW. Study of the correlation between solid colours measured by spectrophotometer and DigiEye. https://research.polyu.edu.hk/en/publications/study-of-the-correlation-between-solid-colours-measured-by-spectrophotometer. |
| [17] | Lane D, Scott D, Hebl M, Guerra R, Osherson D, Zimmer H. Introduction to Statistics.; 2003. |
| [18] | Identifying-color-differences-using-l-a-b-or-l-c-h-coordinates. |
| [19] | Habekost M. Which color differencing equation should be used. Published online 2013: 20- 33. |
| [20] | Determination of chromatic characteristics according to CIELab. |

 Abstract
 Reference
 Full-Text PDF
 Full-text HTML