-
Paper Information
- Paper Submission
-
Journal Information
- About This Journal
- Editorial Board
- Current Issue
- Archive
- Author Guidelines
- Contact Us
International Journal of Textile Science
p-ISSN: 2325-0119 e-ISSN: 2325-0100
2022; 11(3): 37-46
doi:10.5923/j.textile.20221103.01
Received: Sep. 20, 2022; Accepted: Oct. 20, 2022; Published: Nov. 29, 2022

An Observation Toward Computer Aided Processes in Garments Production. Comparison and Analysis of CAD/CAM Software in Bangladesh
 Abstract
 Reference
 Full-Text PDF
 Full-text HTML
Md. Shazzat Hossain1, 2, Md. Abdus Samad2, Md. Hasan Ali2, Jubayer Islam2, Md. Hazrat Ali3, Md. Al-Amin3, Md. Zahir Uddin Babar1, 4, Mohammad Ullah5, Md. Rezaul Karim6, Sree Antu Adhikari7
1Wuhan Textile University, 1 Fangzhi Rd, Hongshan, Wuhan, Hubei, China, China
2University of Dhaka, Nilkhet Rd, Dhaka, Dhaka, Bangladesh
3Bangladesh University of Textiles, 92 Shaheed Tajuddin Ahmed Ave, Dhaka, Bangladesh
4Green University of Bangladesh, 220/D-Begum Rokeya Sarani, Dhaka, Bangladesh
5Khulna University of Engineering and Technology, Khulna, Bangladesh
6University of Rajshahi, Administration Building 1, Rajshahi, Bangladesh
7European University of Bangladesh, 2/4 Gabtoli, Mirpur, Dhaka, Bangladesh
Correspondence to: Md. Abdus Samad, University of Dhaka, Nilkhet Rd, Dhaka, Dhaka, Bangladesh.
| Email: |  |
Copyright © 2022 The Author(s). Published by Scientific & Academic Publishing.
This work is licensed under the Creative Commons Attribution International License (CC BY).
http://creativecommons.org/licenses/by/4.0/

This research paper inquires about different attribute for Computer aided processes in garments production. This perspective Research Done by Our courageous team in 2021 to 2022. Specially, it reveals adequate information on the Garments industry intension and criteria for choosing a CAD/CAM software. For the sake of this Research we were visited more than 600 industries to gather raw data, where Every Industry from different region of Bangladesh was willingly attended in this research and we had been collecting all raw data from this garments industry. The data of Garments industry was coordinated by Excel program, consequently the data was analyzed and implemented statistically to identify the Garments Industry attribute for satisfaction to CAD/CAM software. This process also detects lot of challenges and define advise a proper solution to solve the problems that the Garments industry facing in current situation. This research paper demonstrates adequate information about the Garments criteria and demand in purchasing garments computer aided software.
Keywords: Textile CAD and CAM software, Computer aided design, Computer aided manufacturing, Computer aided process, Garments CAD and CAM software
Cite this paper: Md. Shazzat Hossain, Md. Abdus Samad, Md. Hasan Ali, Jubayer Islam, Md. Hazrat Ali, Md. Al-Amin, Md. Zahir Uddin Babar, Mohammad Ullah, Md. Rezaul Karim, Sree Antu Adhikari, An Observation Toward Computer Aided Processes in Garments Production. Comparison and Analysis of CAD/CAM Software in Bangladesh, International Journal of Textile Science, Vol. 11 No. 3, 2022, pp. 37-46. doi: 10.5923/j.textile.20221103.01.
Article Outline
1. Introduction
- Nowadays in this situation garments industry faces a numerous problem that really need to addressed through constant stamina and targeted research. Insufficiency is constant companion of Bangladesh that surprisingly influenced Industry behavior [1]. The clothing market is totally dependent on the foreign buyer because of targeted profit. But in this Modern period the buyer expectation is higher than usual. So every industry focuses on buyer demand and satisfaction. Literally buying behaviors of a Buyer and uses of the computer aided software of an industry rely on different aspects of retention, perception, financial state and the other Circumstance. Owing to the issue every vendor needs to realize what actually industry willing to buy and using them and what effected on Buyer satisfaction [2]. Industry and buyer behavior have alternated dramatically in the past few years with modern revolution. Every buyer is focused on their money how they spend than ever before Rather than wasting energy and time. A buyer wants products that satisfy their Criteria, and Industry rely on some attribute which is really affordable [3]. Foreign Buyer are not complicated attitude but harder to define [4].Computer aided process play a very far-reaching role in a garments production. The CAD and CAM software are a Garments product that is capable of enhancing garments production. It also plays an important Role on Buyer satisfaction and provoked loyalty of Buyer, which impact on reputation about the specific company.Majority Companies aware about increasing the production flow of an industry [5]. However, it depends on a lot of attributes which is really affordable [1]. Now a day the demand has been increased dramatically in the marker [6]. Hence, this research focuses on the present study is to explore the garments industry behavior to use CAD/CAM software and to Buyer satisfaction.
2. Procedure
- In regarding to perform the research analysis Garments industry and buyer satisfaction were treated as the root point. Eventually, the Different Respondent sentiment was taken into account about the Attribute of garments Cad and Cam software [7]. This research detects the preferable attribute for Using behavior of Garments Computer aided process [8].
2.1. Research Approach/Way
- The Goal of this inquiry was to collect the data with a specific research of numerous Bangladeshi Garments industry on the different aspects such as quality, time, performance, price, mistake, production size, prices, etc. The Buyer expectation was implemented by using targeted research [9]. The Cad and cam user were experimented with specific designing with buyer requirements. This enabled the Buyer to write their open opinions and expectation of demand about the Cad and cam software [8].
2.2. Obstacle Analysis
- The analysis has been performed to detect Buyer demand and their attribute of Cad and cam software. Simultaneously it determines the industry aspects to using a specific software and root causes of using this specific software [10]. The general research conducted through Cad and Cam engineer to the targeted Industry and this study tried to focus the Buyer needs. This Research was originally carried out to collect some useful data with Targeted criteria that create a sense of overall behavior for Industry and Buyer. Overall Using behavior of software positively impacts both attribute and gratification and this ultimately leads to customer Satisfaction [11].
2.3. Evolve Questions
- The provided questions and experiments are created to adequately collect information to construct a view of a user and Buyer intension about disjunction variables such as Time, price, activity, quality of Design, preference, and reason of using specific software and Buyer expectation [2]. The user is able to answer with “a tick mark” and show their experiments in garments CAD and CAM lab. This study expounds the psychology of different user about Garments CAD and CAM software and Buyer demands [12].
2.4. Data Assortment and Inspect
- There are 600 users and 600 buyers were attended in this research experiments where most of them were aged from 18 to 55. Most of the respondents are Bangladeshi user and foreign buyer [13]. Most of the experiments and interview location chosen at the industry lab where Engineer using their CAD and CAM Software from different industry [14].
2.5. Final Data Scraping and Analysis
- Final Data scraping and analysis was very challenging part in this research. Because we have focuses on 2 site-1) User experience and satisfaction2) Buyer criteria and demandsData analysis is regulated through the User intension and faculty to Using a specific software, into fewer worthwhile groups. On the same way it analyzed the buyer demands. The statistical data analysis succeeds using the process of an open coding system. Consequently, this method of data-analysis permits us to illustrate the actual data [3].
2.6. Magnitude and Measurement
- For data collecting we tried to make a sample size 600 Industry User for respondents we took to ensure adequate ratios where the most respondents are directly CAD and CAM software expert. On the other hand, we have collected information from more than 600 buyers why they require and Satisfy with a specific software [11]. Eventually the authors are able to collect Data and information from respondents are from 5 different Industrial areas such as Dhaka, Tangail, Gazipur, Narayanganj, Narshingdi [8].
2.7. Data Manipulation and Integration
- Data integration is a Most vital element of a quality research where this process considered several analyze with some data points [15]. It controlled ideal and correct decision with decreasing misleading data. This process capable to evaluation and Recognition of data where the specific statistics comes from respondents. That’s why this combination implemented for quality result [3].
3. Primary Analysis & Discussions
3.1. 1st and 2nd Priority Level to Using CAD/CAM Software for a Garments Industry Software User
- In this analytics there two specific chart which represent the priority level of the different user with some attribute. However, the line chart and bar chart represent with same data and same value in the different way. The research Determine that majority of the Software user give 1st preference to the Production and 2nd priority to quality of the Software performance and as well production. According to Linear priority level this is clear that the highest preference is production size with minimum time. So every user of an industry chooses the software with Bulk production for saving valuable time. The following Line chart show the highest proportion of priority for production of software where 1st and 2nd priority accounted for 71.50% and 69.08% respectively. The bar diagram clearly expressed that the price, speed and mistake are on the maximum preferences for 2nd priority. The following diagram shows the volume of each priority in percentage.
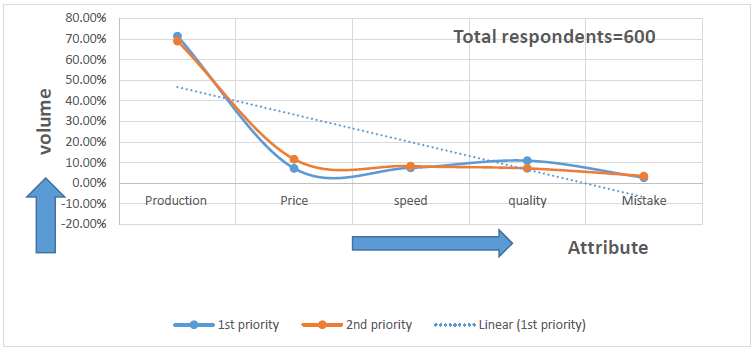 | Figure 1. 1st and 2nd priority of software user with Line chart |
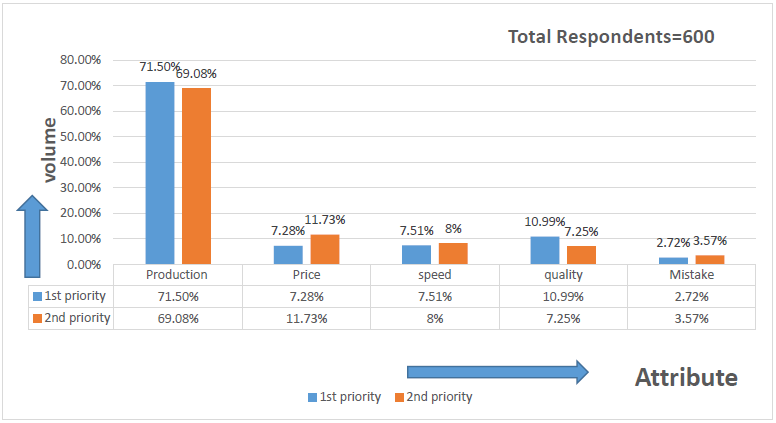 | Figure 2. 1st and 2nd priority of software user with Bar chart |
3.2. Quality Selection of CAD and CAM Software
- For quality selection I have to choose five attributes. Such as Time to making design, Brand of the software, price of the software, possibility of Mistake when making design, complexity of software. A user is terribly keen about quality of Software where most of the user considered maximum priority as Brand of the software and time for making a design. The first priority accounted for Brand, Time, price, mistake and complexity respectively 37%, 35%, 15%, 7% and 6%. This was followed by just 25%, 30%, 20%, 10% and 15% for 2nd priority. So, the user is Possibility of the mistake and Complexity of software in case of quality selection. Because the possibility of the mistake and complexity of software are almost same for all type of software. People always tried to focus on Brand and time to making a design. The volume of priority for quality has shown in the following bar chart and pie chart individually.
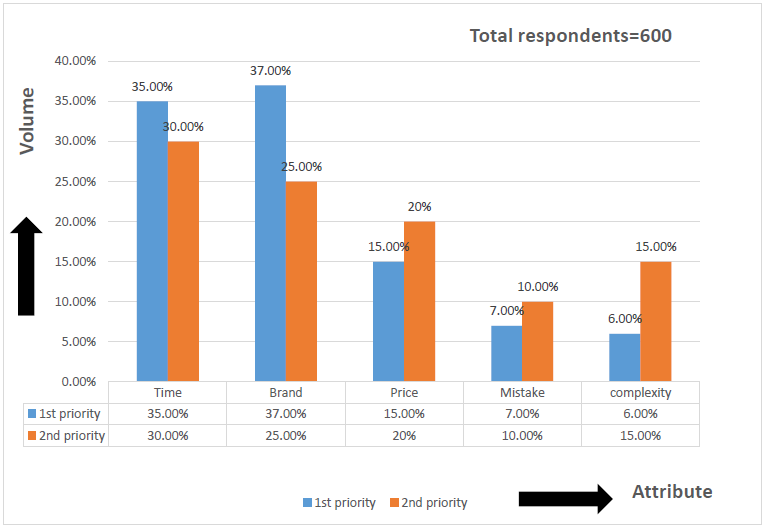 | Figure 3. Bar chart for quality selection of CAD and CAM software |
3.3. Buyer Priority to Select Software with Their Satisfaction
- Most of the Buyer intended to Use branded and well reputed company software rather than the price and speed of the software. Where the highest proportion of buyer choose to use brand of the software and quality of the production which both are accounted for 60.59% and 39.41% for 1st priority. This was followed by just 41.27% and 58.73% respectively for 2nd priority. Among them Buyer avoid the price of the software and how much it faster. Buyers are so confident that if the brand is well reputed than other attribute of the software will be better That’s why every buyer avoided the price and faster properties of the software. So a buyer chooses the best branded software like lectra or optitex software. However, Buyer focuses on lectra software in the first place. Software selection priority percentage has been shown in the following bar chart.
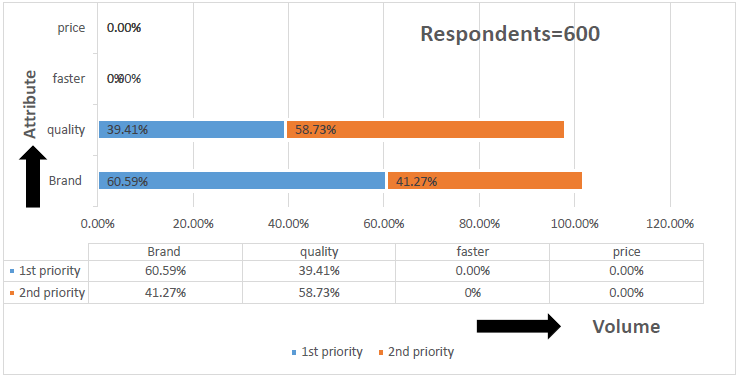 | Figure 4. Buyer priority for software selection with bar chart |
3.4. How Garments Industry and Buyer Awareness Increases over Time with Software Price
- This Bar chart and line chart are created with same data and same properties. However, both charts are clearly expressed the industry awareness and buyer awareness about using CAD/CAM software. There is a little comparison of software price with their awareness over the period. For the last six year’s period how the software price increased and the awareness changed with the price of the software. According to the chart the prices of the software increased in 2016, 2017, 2018, 2019, 2020 and 2021 respectively 50%, 52%, 54%, 56%, 57% and 59%. From the line chart it is clearly found that the buyer awareness was maximum in 2016 that which software is used by the company. However, industry awareness was lower than buyer awareness. But gradually industry awareness surpassed the buyer awareness in 2021.The following bar sketch and line chart shows the industry and buyer awareness over time.
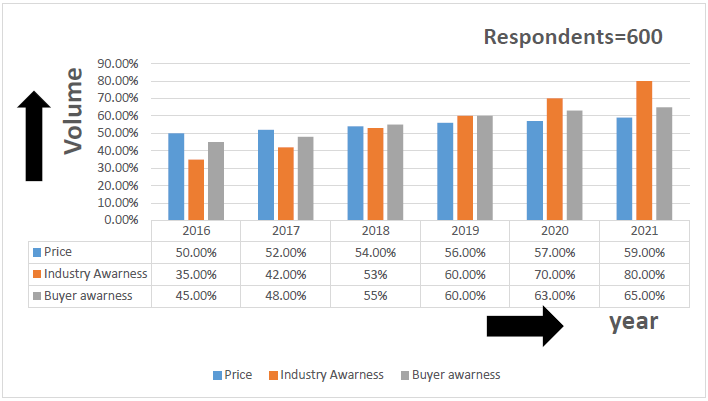 | Figure 5. Industry and buyer awareness overtime with bar chart |
 | Figure 6. Industry and buyer awareness overtime with line chart |
3.5. How Industry User Increased with Software Price
- The following line chart represent how the price of the software and software user changed over time. This analysis collected data of last 11 years. The price of the CAD and CAM software increased and decreased overtime from 2010 to 2020 which is accounted for 50% for 2010, 49% for 2011, 45% for 2012, 47% for 2013, 43% for 2014, 40% for 2015, 48% for 2016, 52% for 2017, 55% for 2018, 60% for 2019 and 60% for 2020. Where CAD/CAM software user increased 10%, 20%, 25%, 35%, 50%, 60%, 67%, 70%, 75% and 80% following by the year. The result of user with software price is shown in the following figure.
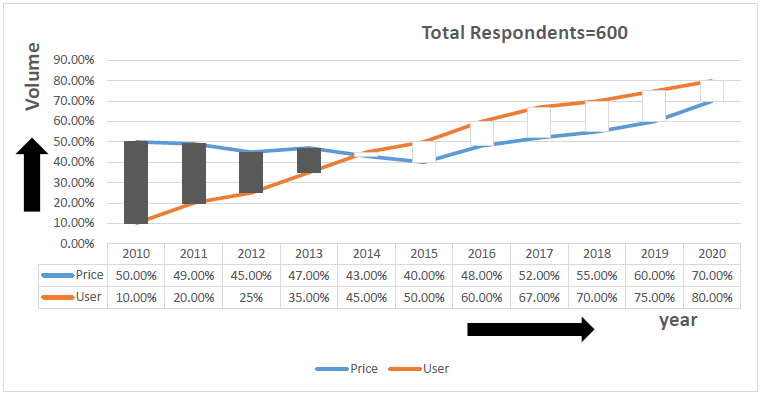 | Figure 7. Industry user increasing trend with Software price |
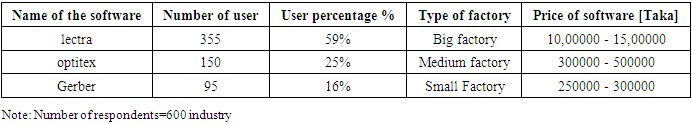
3.6. Most Used Software in Bangladesh with Industry Satisfaction
- This analysis specially focuses on final result of the whole research. Because this research represents actually which software usually used by an industry for their satisfaction and why this software actually meets their industry criteria. The following chart explains the software name, number of software user, type of factory and price of the software in Bangladeshi currency taka. Where more than 355 industries intended to use lectra software. However, the price of the software is high but most the big factory like epz and others prefer to using lecta modaris software. On the other hand, 150 industries like to use optitex software. Most of the factory are medium class. So they never want to spend big budget with buying lectra software. The small factory chooses to use gerber software for the low price. They choose gerber for low prices and small amount of production. Approximately 600 industries were attended in this research.The following table shows the number of software user with different attribute.
|
4. A Real Garments Order Sheet for Analysis
- For research purpose we have carryout a real test with a Buyer order sheet. Where most of the respondents used their own preferable software with the specific measurement. The buyer KIABI Company sends a requirement for a half shirt. Where the specific measurement is shown below on figure 1. On the other hand, figure 2 represent the specific design style for the half shirt. Where more than 600 respondents directly involved with making this half shirt design. We carefully observe the software performance when the software user trying to making a design. Our observation includes with some basic question and parameter. Such as-I. How much time required to make this specific design.II. The possibility of mistakes was carefully observed.III. The production ability was calculated with this software.IV. Quality of the final design.V. Quality of the final production with specific measurement.VI. Buyer satisfaction.VII. Complexity of the design with the specific software, etc.Where Lectra modaris software performed really amazing. So every big, gigantic factory like EPZ, Square Fashions ltd, Denim, Ha-meem group, Beximco, DBL Group, Opex Sinha Group, Fakir Group, Epyllion Group, Standard Group, Asian Apparels Limited, Viyellatex Limited and AJI group are using lectra modaris software. On the other hand optitex is also better for medium quantity production. In a small factory which is using Gerber software it performance are less. But for small production this software really suits. The following figure 1 represent style of design for the half shirt and the figure 2 show the measurement chart-
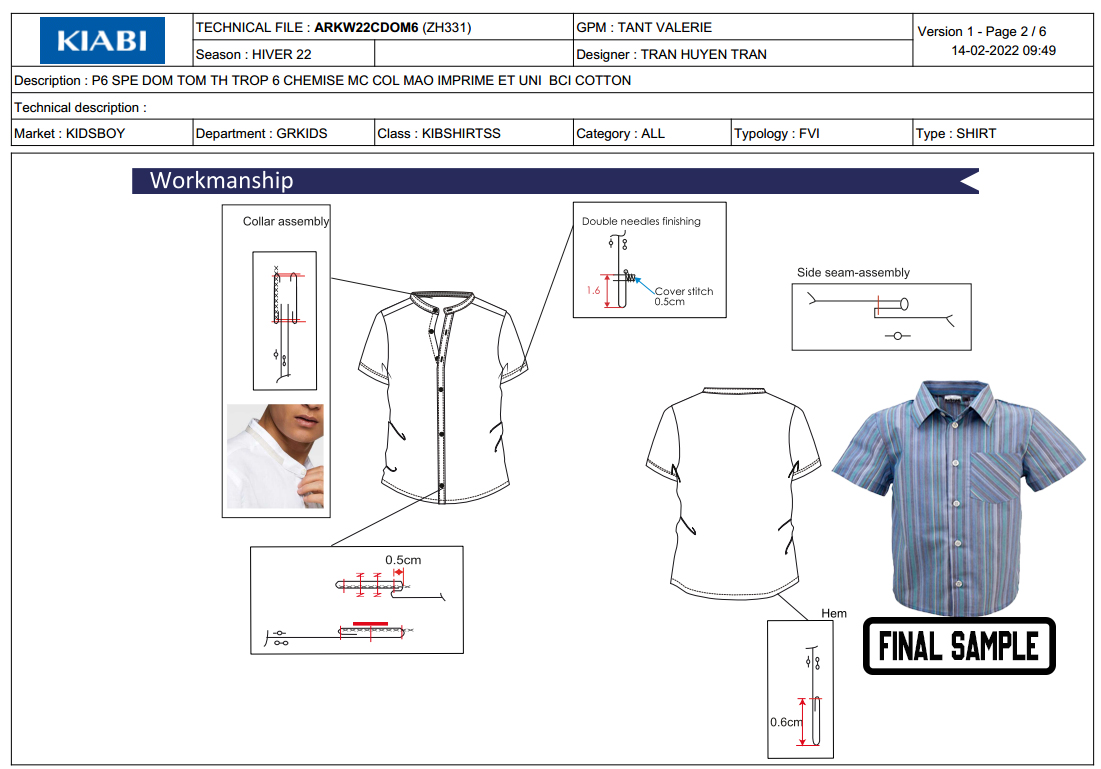 | Figure 8. CAD/CAM design for half shirt |
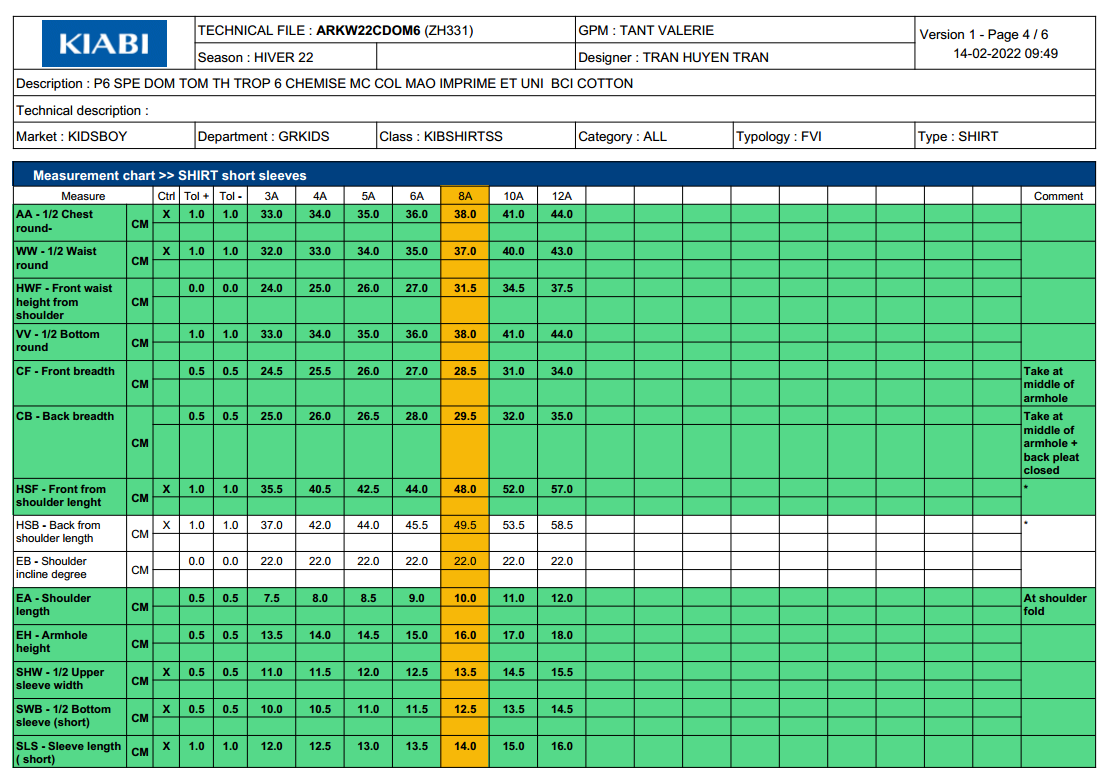 | Figure 9. KIABI company measurement chart for half shirt |
5. Automatic Template Design System
- Automatic template design system is a process where a user capable to making a CAD/CAM design with a previously created template. This Template providing the facility to making a garments design easily with this automatic template design system a user can reedit the design with their criteria [16]. A designer can reedit the measurement also. So the time to making a design is less in this automatic system. The purposes to discuss these properties specially to make it clear that which software consist highest facilities.Where lectra have a rich resource of automatic template. Because Lectra is a software which created by a well reputed company. They are trying to develop the software with period. They upadated the software gradually and added a lot of automatic template design.Optitex software recently added some automatic template design system. But this is less effective compared to Lecra software.On the other hand, Gerber is still backdated software compare to Lectra and Gerber. So this software has no resource of automatic template design system.
6. Final Analysis and Discussion
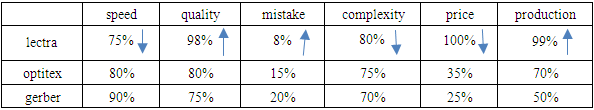
- Now the final analysis done from previous preliminary research. Overall final analysis represents the actual parameter and attribute that’s why a company choose a specific software. The following table is more complex among whole research. Where it represents the different attribute. Which specifically represents that’s why a company choose a software for their industry [9]. The positive attribute for lectra software is quality of design, possibility of mistake and production rate which is accounted for 98%, 8% and 99% respectively. Where optitex is accounted for 80%, 15% and 70% respectively. The gerber is also accounted for 75%, 20% and 50% respectively. The possibility of the mistake to create a design is less in lectra which plays an important role to choosing lectra.However, Gerber and optitex are faster, minimum complexity and less price. Where gerber is accounted for 90%, 70% and 25%. On the other hand, optitex is accounted for 80% but optitex and Gerber has a lot of limitation than lectra. The following bar chart represented the different attribute with different software with following data table.
|
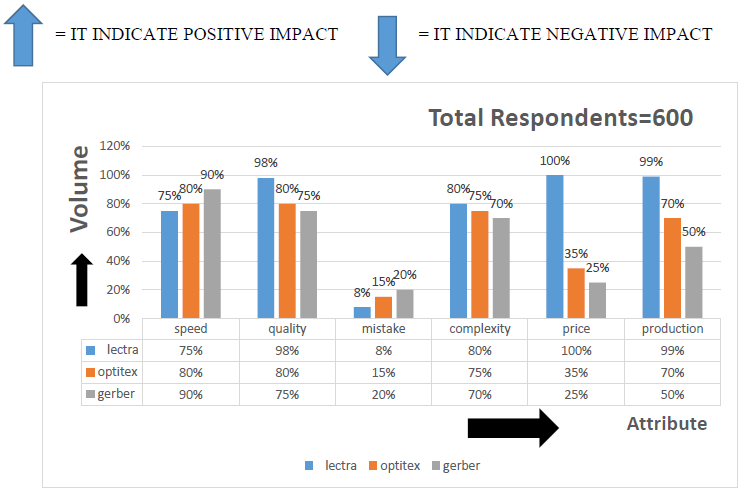 | Figure 10. Different software attribute with a bar chart |
7. Conclusions
- From the Research that performed successfully it can draw the conclusion for Bangladeshi industry attitude for CAD/CAM software and Identify attribute which affects to User behavior for the particular Garments Software [11]. Overall, the highest priority of customers was Production, speed and Brand. From the speed table it clearly represents that the most faster software is Gerber then optitex and lectra. But why an industry chooses lectra for their industry. If you looked up on quality of design of lectra is maximum. The possibility of mistake in lectra are less compared to other software. On the other hand, the production rate is also maximum in lectra software. However, the speed, complexity and price is maximum, and it plays negative impact on lectra software. But the quality of design, possibility of the mistake and production which is accounted for 98%, 8% and 99%. The price of the lectra software is maximum which is also accounted for 10,00000 to 15,00000 taka. However, the price of the software is too expensive. But the other attribute plays positive impact. That’s why the user is ignored the price of the software. Lectra software also has a complex and slower than other software. So the rate of production and quality of design hit maximum that plays positive impact on Lectra modaris software. The possibility of a mistake is 8% means Lectra modaris software have minimum possibility of mistakes. The other big factor that lectra software is top leading template system. Which helps a user for making automatic software. Which is biggest facility to making a design easily. That’s why the Lectra choose maximum number of big industry in Bangladesh. Owing to compatibility, production of the software plays an important role that influence user tendency to buying CAD/CAM software. For the medium industry they focus some attribute for their company satisfaction. So every medium class factory intended to buy optitex software. Optitex is a software which is faster than lectra software. Complexity is also lower than the lectra software. The price of the software is cheap compared to lectra software. That’s way the 3 attribute speed of the software, complexity and price which is accounted for 80%, 75% and 35% plays and important role to choosing optitex software. For medium class factory the production size is less. So they try to ignore the production size.For a small factory they always preferred to buy Gerber software for their satisfaction. Gerber is enough to meet their criteria also. Where the small factory ignored 3 attribute such as quality of design, possibility of mistakes and production size. On the other hand, they focus on speed, complexity and price of the software. Where speed, complexity and price is accounted for 90%, 70% and 25%. So it clearly represents that the speed and price of the software is minimum. And the complexity of the software is less. So it is quite easy to learn and using. To recapitulate the 59% user prefers to buy Lectra Software, 25% user prefer to buy optitex software and 16% user preferred to use Gerber software. There are 3 types of Gerber software is available. Such as gamine, bock and Emma etc. Where every buyer wants faster and quality software which involves with perfect delivery time. Buyer also focus on some attribute such as quality and brand which is accounted for39.41% and 60.59% for 1st priority. This was followed by the 58.73% and 41.27% for 2nd priority. However, buyer have no choice about price of the software. Because of that there is no influence of the price upon a buyer [3]. To encapsulate considering all the properties user is intended to buy 59% lectra, 25 % optitex and 16% Gerber.
8. Suggestion for Future Work
- v The software producer company should try to developed new way minimize the price of lectra software in the future. That’s why small and medium factory also capable to buy Lectra software.v The developer should try to speed up of lectra software.v In case of Optitex and Gerber Software developer should try to minimize the amount of mistake%.v The production rate in less in Optitex and Gerber. Developer should focus on this specific field. where it should capable to use in bulk production.
9. Funding
- Self
10. Conflicts of Interests
- We have no conflicts of interest to disclose. All authors declare that they have no conflicts of interest.
11. Author Agreement Statement
- The content is original, hasn't been posted before, and is not being evaluated for publishing anyplace, based on the signature. We confirm that all mentioned authors have read, reviewed, and approved the manuscript and that no other people who satisfy the qualifications for authorship but are not mentioned have participated to the work. We further repeat that we all agreed of the arrangement in which the writers are listed in the article. We know that the Corresponding Writer is the sole individual with whom the editing process may be in touch. He or she is in responsible of notifying the other writers on their work, offering corrections, and giving written permission to the proofs.
ACKNOWLEDGEMENTS
- This valuable thesis is the culmination of years of work that was associated with and approved by numerous persons. It is fascinating that we are now all respectfully thanking each contributor for their contributions.