-
Paper Information
- Paper Submission
-
Journal Information
- About This Journal
- Editorial Board
- Current Issue
- Archive
- Author Guidelines
- Contact Us
International Journal of Textile Science
p-ISSN: 2325-0119 e-ISSN: 2325-0100
2021; 10(1): 7-20
doi:10.5923/j.textile.20211001.02
Received: Apr. 21, 2021; Accepted: May 26, 2021; Published: Jun. 15, 2021

Mechanisms and Functional Properties of Colored Coffee Compounds Dyed Cotton Fabrics
 Abstract
 Reference
 Full-Text PDF
 Full-text HTML
Amel E. A. Elabid1, Imad E. A. Mahajoub2, Mutasim A. Ahmed1
1Faculty of Industries Engineering and Technology, University of Gezira, Wad Medani, Sudan
2Faculty of Engineering and Technology, Department of Chemical Engineering and Chemical Technology, University of Gezira, Wad Medani, Sudan
Correspondence to: Amel E. A. Elabid, Faculty of Industries Engineering and Technology, University of Gezira, Wad Medani, Sudan.
| Email: |  |
Copyright © 2021 The Author(s). Published by Scientific & Academic Publishing.
This work is licensed under the Creative Commons Attribution International License (CC BY).
http://creativecommons.org/licenses/by/4.0/

The colored Coffee compounds dyed Cotton Fabrics include mechanisms and functional properties were studied. The extract of raw, medium and dark Congolese Coffee (Arabica L) were subjected to GCMS analysis and it was found that the source possessed 1-22 major compounds with varied area percentage, depending on functional groups in simple structure were discussed of raw, medium and dark roasted Coffee, the total moles percentage of acids (RCOOH) of raw Coffee were 86.51% show that higher than the other functional groups and the total moles percentage of acids (RCOOH) of medium roasted Coffee were 33.53%, Phenol was 22.56%, and ROH was 21.64%. Therefor the total moles percentage of acid in (RCOOH) of dark roasted Coffee were 25.38%, this value decreased than on raw and medium roasted Coffees, the RCOOR was 30.43% and Phenol was 9.18% displayed in Tables 2, 4 and 6. Due to the presence of above mentioned compounds in the extract of Coffee, this result was in agreement with the fact that most of the natural dyes are a mixture of different color components rather than an individual color Surface properties of cotton fabrics were investigated using Spectrophotometry and were characterized using attenuated total reflectance Fourier Transform Infrared Spectroscopy (ATR-FTIR) to understand the performance of these natural dyes. Through roasting at 240°C, was noticed that the weight loss increased with the roasting time because drying causes due to removal of water and volatile substances.
Keywords: Coffee, Roasting, Cotton fabrics, GC-MS, FTIR, Chemical composition, Mechanism
Cite this paper: Amel E. A. Elabid, Imad E. A. Mahajoub, Mutasim A. Ahmed, Mechanisms and Functional Properties of Colored Coffee Compounds Dyed Cotton Fabrics, International Journal of Textile Science, Vol. 10 No. 1, 2021, pp. 7-20. doi: 10.5923/j.textile.20211001.02.
Article Outline
1. Introduction
- Natural colorants find the application in a wide range of coloration like dyeing and printing of textiles, paper, rubber, paints, and plastics. Natural dyes have several advantages in excess of synthetic dyes from the point of health, safety and ecology with uncommon, soothing and soft shades compared to synthetic dyes. Natural dyes have been used to coloring the textiles since time centuries old. People all over the world have been using plant sources viz., roots, stem, bark, leaves and flowers for textile coloration. Interest of natural dyes has been demonstrated towards because of ecological movement, bio degradability and higher compatibility of natural dyes with environment. Other advantages associated with natural dyes include lower toxicity and allergic reactions in relation to synthetic dyes (Netra. L. Bh, 2020). Coffee has in excess of two thousand components from volatile and non-volatile compounds (Moreira A, 2013). Coffee has a great number of selections, only some degree of them have economic significance. Coffee production was provided by two selections, called ‘Arabica’ and ‘Robusta’ of all the world's (Butt and Tauseef Sultan, 2011). The chemical composition of a coffee brew is strongly influenced by the composition of the green bean, the roasting procedure, and the extraction conditions. Green Coffee beans are rich in carbohydrates, proteins, and phenolic compounds, and these compounds are transformed and/or degraded upon roasting. During the roasting process polysaccharides and proteins are degraded (Oosterveld. A, 2003), and the Maillard reaction takes place between amino acids/proteins and reducing sugars, which the formation results of flavor and colored compounds. The roasting Coffee beans color is produced and characterize through the roasting process, (Fernanda V. Matta, 2019). Coffee Arabica is the most cultivated varieties was used for commercial production, accounting for about 60% and 40% of the world Coffee market. Modelling of Arabica Coffee influence of climate change led to the prediction that will be a 65%–100% decrease in it production via the year 2080 due to the reduction of suitable cultivation localities. (Iscaro, J, 2014). Many studies have dealt with Coffee in relation to growing the crop, its composition, and its effects on health. Also, much research was focused on the formation of aroma, taste, and color during the roasting process. Coffee flavor compounds were the result of a complex chain of chemical transformations. Extract Coffee infusions prepared from roasted Coffee beans get brown color. This consumption was so high and their characteristic flavor and aroma (Yeretzian. C, 2002). Some researcher were focused on the starring role of roasting conditions of the Coffee in the level of selected compounds. There were only few studies that deal with the complex observing of changes in the chemical composition of the Coffee during roasting (Wei. F, 2012). Ciecierska1. M et al, studied a different chemical profile has different variation of Coffee. It has volatile and non-volatile compounds were a complex chemical compounds produced during the roasting process, diterpenes, sugar, amino acids and organic pollutants are important for Coffee flavor, quality and health effects. At different levels of roasting, the chemical compounds produced also varies. In addition, different compound proportions can result in the different roasted of Coffee. The determiners of the chemical compounds of the Coffee bean was the variety of Coffee. Different varieties of Coffee have a different chemical profiles which play an important role of the Coffee (Ciecierska1. M, 2019).Livramento, K.G et al. investigated the roasting is the primary processing that Coffee beans undergo, during roasting the beans develop important flavor characteristics. This method affects the composition of the Coffee beans and beverage, similarly influencing potential Coffee bioactivity in arrears to interactions occurring in the compounds available in the Green Coffee beans were roasted; this process changes the chemical composition drastically (Livramento. K.G, 2017). The Maillard reactions are one of the principal reactions that occur throughout roasting Coffee beans. This reaction, in which reducing sugars react in a cascade of reaction steps with amino groups, leads to the formation of desired characteristic flavor and color compounds. The brown-colored Maillard-reaction end-products are referred to as melanoidins, and they are often defined as brown-colored. Martins et al studied the recognized mechanisms of the Maillard reaction and the products can be roughly divided in two classes (volatile components and the brown-colored non-volatile). The Maillard reaction volatile products can be referred to as Maillard flavors and non-volatile end products are generally referred to as melanoidins (Martins, S. I. F. S, 2001). This paper is aimed to identify the compounds present in Congolese Coffee (Arabica L) to evaluate and compare the active compounds and extracts after different roasting processes and their chemical composition of raw Coffee beans and roasted bean to explore the investigation of the mechanism and functional properties of raw beans and roasting Coffee degree on coloring cotton fabrics. To this end, Coffee were prepared from beans with varying degrees of roast as well as their formation mechanisms and the dyed Cotton fabrics with extracts Coffee colorant.
2. Materials and Methods
2.1. Preparation of Cotton Fabrics and Dyeing
- Cotton is purely cellulosic fibers and found throughout the world with many varieties and qualities. The cotton fabrics were weighted for each sample about 5 g/m2 and the thickness 0.37 mm, from Sur Military and Civil Clothing Factory, Khartoum, Sudan. Then desized, scoured and bleached as preparatory process before dyeing with Coffee dyes, the cotton fabrics were dyed using conventional method at pH 8, and the liquor ratio with the stock solution of the Coffee extract are 1:10. The Coffee extract, in a laboratory automatic dyeing machine (model 4-12; Tokyo, Japan). Dyeing time was 120 minutes (depending on shades) and dyeing temperature was 90°C. For dyeing the fabrics were boiled with an aqueous extracted solution of the Coffee dye until all the coloring matter was absorbed by the cotton fabrics. After the dyeing was over, the dyed cotton fabrics were repeatedly washed with hot and cold water and then finally, the dyed cotton fabrics are subjected to soaping with 2g/L soap solution at 60°C for 15 min, followed by repeated water wash and dried. The dyeing process were prepared from Textile Engineering Department Laboratory University of Gezira, Sudan.
2.2. Roasting of Coffee Beans
- Roasting of green Coffee beans is an essential step in the Coffee production process as it induces chemical reactions that lead to the formation of the characteristic Coffee flavors and being the dark-colored components. The roasting process comprises a 2-stage transformation of the bean: I) evaporation of 10-13% free water, this takes up to 80% of the roasting time, and II) pyrolysis within the beans, with swelling of the beans, and a fairly rapid darkening, followed by the emission of oily smoke and crackling sounds (Clarke. R.J, 1985). Randomly selected Coffee beans were put into a pan, spread on a layer and then roasted according to the specified processing conditions. The evaluation of roasting were established according to per hundred difference of sample weight before and after roasting and visual inspection of the external color of the beans, since they are the most common methods adopted by Coffee roasting industry. The Coffee put in the pan and placed in the same position in the fire each time to make sure minimum difference of roasting conditions. After roasting, electric fan was cooled immediately. Green (raw) beans of Congolese Coffee (Arabica L) was collected from Wad Medani market. They were washed, dried under sunlight and the green Coffee samples were roasted. The sample was roasted as long as 20 and 30 min with a temperature at 240°C to medium-roasted and dark-roasted Coffee respectively, until the volatile compounds inside the beans were evaporated, After that, they were milled in a grinder. The coffee powders were weighted. Extracts were obtained in hot water (90–95)°C for 20 min. To optimize the extraction, and the supernatant of each extract was separated into two parts one for drying in air drier and the other dyeing the cotton fabric after that the residue was drying (dehydration at 180°C; vacuum of 60 mbar). The dehydrated extracts were stored in vacuum at 80°C until analysis.
2.3. Extraction Process of Color Component from Coffee Dyes
- Extraction of color component from Coffee are important step for dyeing any one fabrics to maximize the color yield. Coffee dyes of different origin can be extracted by using water for the extraction with or without addition of salt. Extraction refers to separating the desired color component by chemical means with the aid of a solvent. Most favorable conditions of extraction variables were determined through extracting the caffeine from Coffee color component by varying extraction parameters of liquor and measuring the optical density of corresponding colored liquor by using spectrophotometer (Amel. E. A. E, 2021). Furthermore, the gravimetric yield of color can be measured by filtering the extraction liquor through standard filtration process followed by evaporation of solvent, washing and finally drying to get the purified Coffee dyeing. The extract was used as a stock solution for the dyeing of fabrics in the study. The extraction method was prepared from Chemical Engineering and Chemical Technology Department Laboratory University of Gezira, Sudan.
2.4. Preparation of extract for GC-MS
- Green (raw) beans of Congolese Coffee (Arabica L) were collected from Wad Medani market, Sudan. And roasted as long as 20 and 30 min with a temperature at 240°C to medium-roasted and dark-roasted Coffee respectively, so that the volatile compound inside the bean will be evaporated. The method used for the documentation of volatile compound in Arabica coffee was via Gas Chromatography-Mass Spectrometry (GC-MS). The samples were weighed up to 0.5 g and dissolve in dichloromethane, the holder of SPME was inserted into the hollow tube so the volatile compound can be sucked into the GCMS- QP2010 Ultra, Shimadzu with the following conditions: injector temperature was 280°C; injector mode was splitless; column oven temperature was 40°C with rate of 10°C/min; retention time of 3 min to reach the temperature of 299°C with total program time of 29,80 min; ion source and interface temperatures were 280°C; Helium gas was used as the carrier gas; flow control mode pressure at 41.8 kPa; total of flow was 8.4 ml/min; column flow was 0.9 ml/min; split ratio 5:1, column type Rtx-5MS; and column length 30 meter and thickness 0.25 μm.
2.5. Measurements
2.5.1. GC-MS PROgram
- GC-MS technique was performed in a GC Clarus 500 Perkin Elmer system. GC-MS operated using the following conditions: Column: Elite-5MS (30×0.25 mm×0.25 mm made up of 5% diphenyl 95% dichloromethane), electron energy - 70 eV; helium was utilized as hauler gas and at an incessant surge of 1 ml/min. The split ratio was 10:12 of 2 μl injection volume was employed. The temperature of injector was 250°C; temperature of inlet and source was 200°C. The oven temperature was encoded up to 200°C at the rate of 10°C/min (no hold), to 5°C/min - 9 min hold up to 280°C. Total working time of GC and MS was 29 min (Banakar. P and Jayaraj. M, 2018). From Mohamed Abied center Lab University of Gezira, Sudan.
2.5.2. Weight LOSS MEAsurement
- The weight percentage changes were calculated from the weight change in the fabrics after the treatment and the weight loss (WL) was calculated with the following formula (Afra. H. 1, 2010): Textile Engineering Department Laboratory University of Gezira, Sudan.
 | (1) |
2.5.3. Fourier Transforms Infrared Spectroscopy Analysis
- The Fourier transforms infrared spectrophotometer (FTIR) were recorded using IR Tracer-100 (EN230V) analytical FT-IR Spectrometer, SHIMADZU Company, Japan. The total reflectance of spectra was taken with a resolution of 4 cm-1 and accumulation of 32 scans for each undyed and dyed Cotton samples with a range of 500–4000 cm.-1, for consistency and reproducibility all spectra were normalized against the C-O-C asymmetric stretching vibration. From Mohamed Abied center Lab University of Gezira, Sudan.
2.5.4. Color Fastness Testing
- Washing fastness: The washing color fastness was determined according to ISO 105-C01:1989 test method (ISO, 1989). The washing fastness test was conducted in a laboratory launder tester (model DA-8 Tokyo, Japan) using 5 g/L nonionic detergent at 50°C for 30 min, the liquor ratio 1:50. Then, removed the compound specimen by wetted with running tap water, squeezed, and then dried. It included the test specimen and the two adjacent fabrics in contact to the main sample. Gray scale was used to assess the color change of the dyed sample and the staining of the two adjacent undyed fabrics (cotton and polyester).Rubbing fastness: The rubbing color fastness was determined according to ISO 105-X12: 1987 with a crock-meter under conditions for determination of dry and wet fastness (ISO, 1987). Laboratory rubbing tester Marubeni Corporation. Textile machinery DEPT. model LA-375. Tokyo; Japan (Uenoyama Kiko CO. LTD). The washing and rubbing color fastness were prepared from Textile Engineering Department Laboratory University of Gezira, Sudan.
3. Results and Discussions
3.1. Weight Loss
- The important physical aspect that is commonly monitored during Coffee roasting is weight loss. This parameter can be employed to assess the degree of roast. According to the process weight loss variation during roasting. Results of weight loss during roasting at 240°C when roasting time was 20 and 30 min, the external color of the beans changed from green to medium brown, dark brown, ultimately very dark, and the result of Congolese Coffee (Arabica L) mass loss values per roasting degree were 15.91%, 18.18% respectively. Were noticed that the weight loss increased with the roasting time because drying causes weight loss due to removal of water, even though during the roasting stage it is mostly caused by removal of water and volatile substances, with the roasting time increasing the roasting process turned into roasting stage from drying stage, so loss rate of weight occurred faster during the last 10min. After drying stage, a significant. That increase in weight loss occurs after that could be attributed to the intensive release of organic compounds and CO2 associated to the pyrolysis reactions (Franca. A.S, 2009).
3.2. FTIR Spectral Analysis
- The (FTIR) spectra of the plain undyed cotton fabric, and fabrics dyed with Congolese Coffee (Arabica L); raw Coffee, medium-roasted and dark-roasted Coffee extracts were presented on Figure 1. From the figure it could be observed that the undyed cotton fabric presents a spectrum which was a typical cellulose structure. The cellulose spectral features are discussed somewhere else (Haule, L. V, 2016). The comparison was done in the 4000 cm-1 to 500 cm-1 wave numbers because this is the spectrum where most of the chemical changes taked place during dyeing of cellulose fabrics. From figure 1, unique feature at 1640cm-1 wave number appears for the brown dyed fabrics. These feature is unique, does not appear in the plain, undyed cotton fabrics. Peak at 1160 cm-1 of the undyed cotton fabric disappear after dyeing and is reduced to 1157cm-1. Peak at 1107cm-1 as seen on the undyed cotton fabric, disappears after the dyeing of the cotton fabrics. Peak at 1030 cm-1 of the undyed cotton fabric is reduced to 1025cm-1 after dyeing of the cotton fabrics.
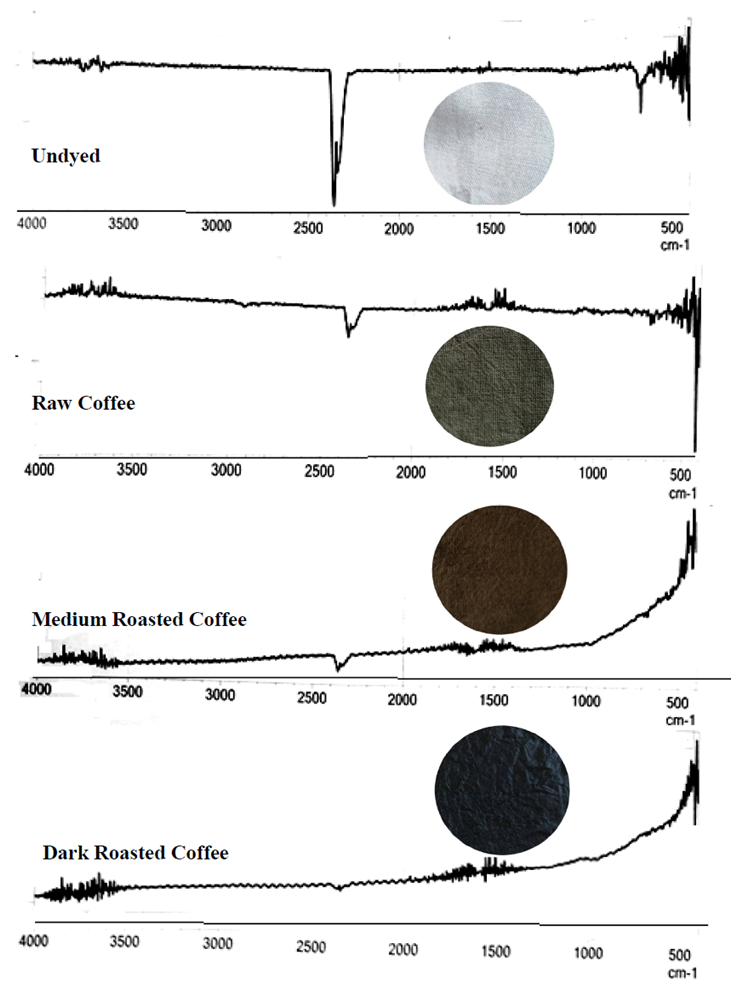 | Figure 1. FTIR spectra of dyed Cotton fabric samples: undyed and dyed fabrics using Congolese Coffee (Arabica L) extract |
3.3. GC-MS Analysis
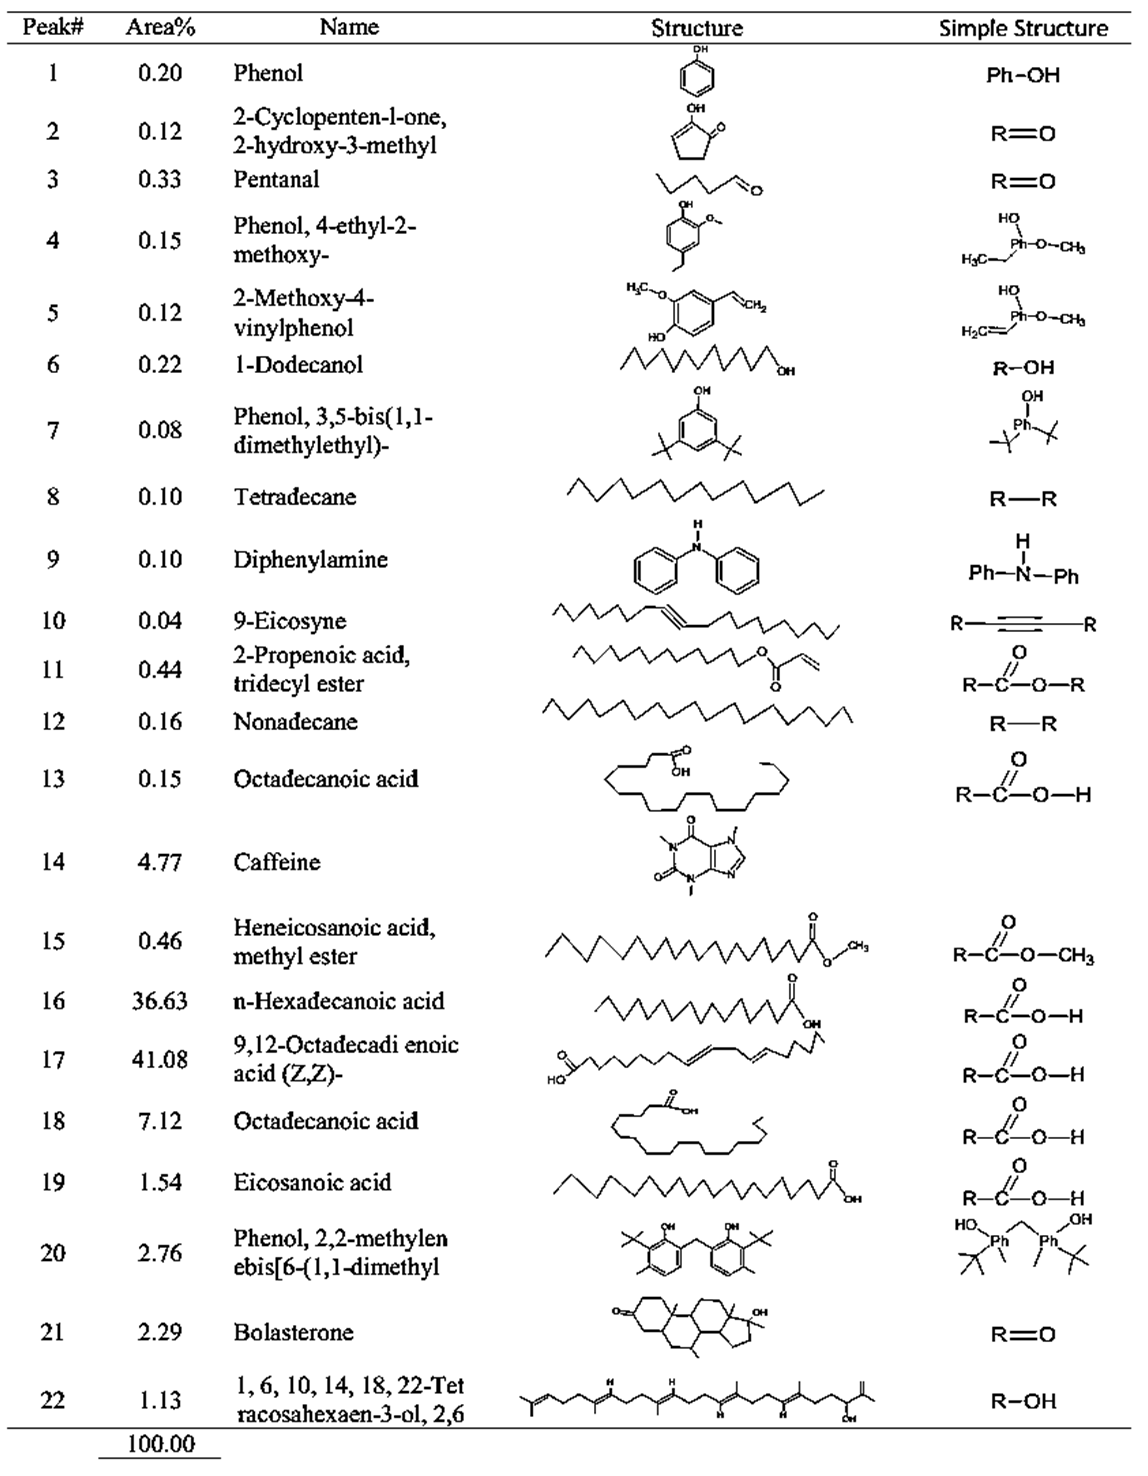
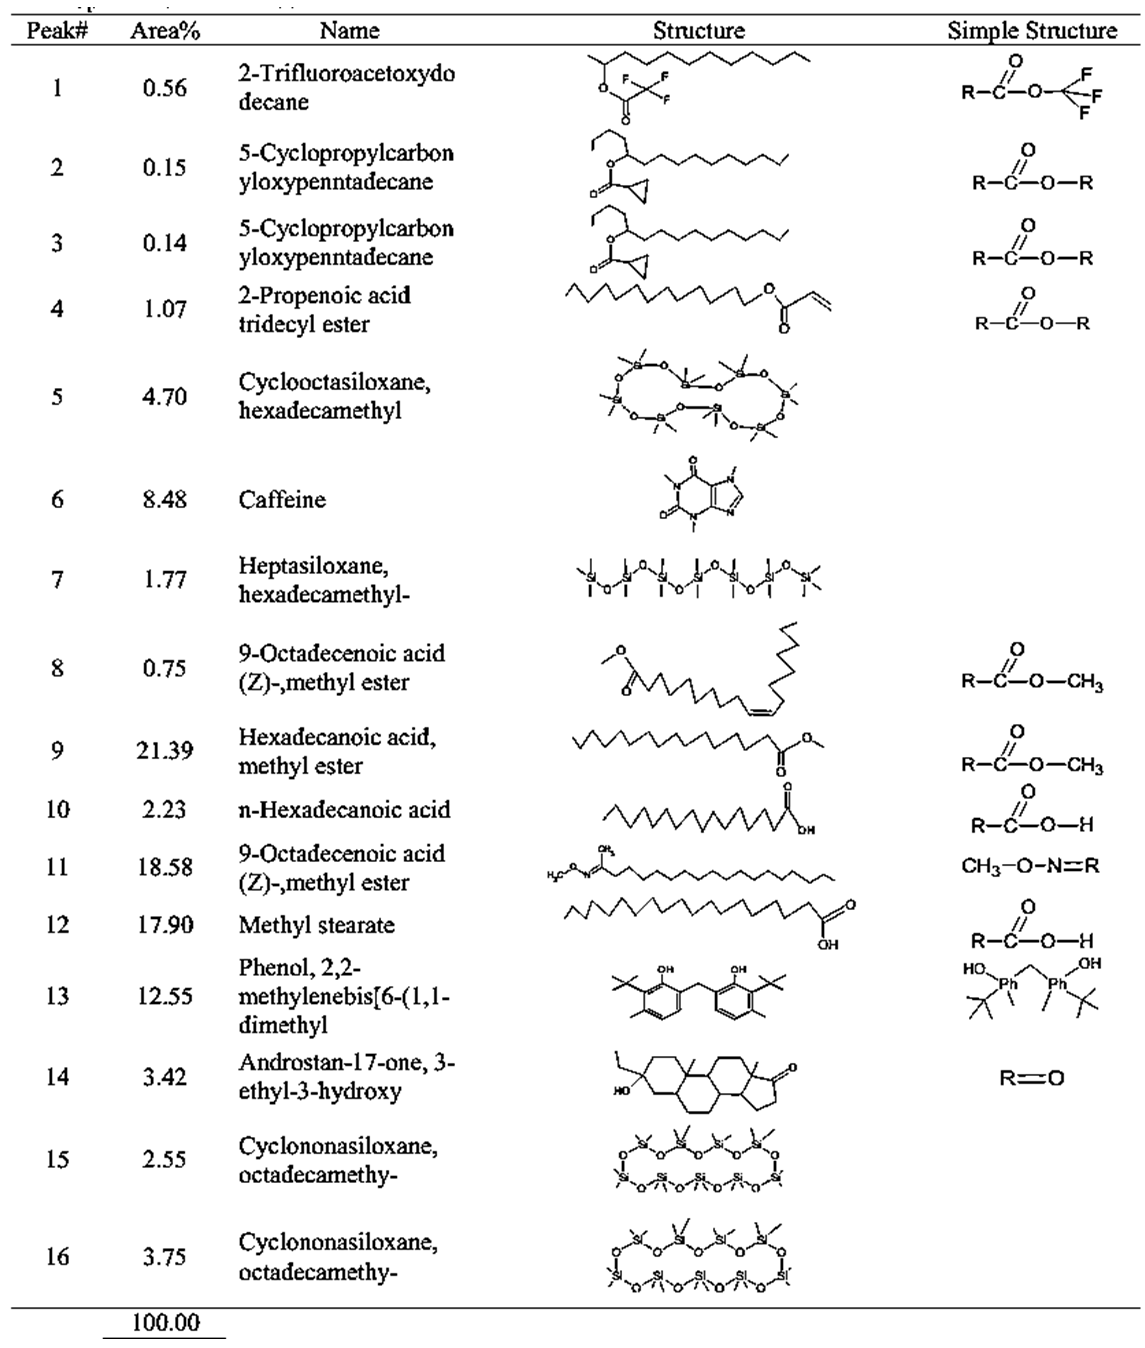
- GC-MS (Gas Chromatography-Mass Spectroscopy) is a very widely used technique and combines high sensitivity and specificity for suitable analyses. The compound found used Gas chromatography to identify a gas mixture and also determine the concentration of a compound in the gas phase. In the GC-MS analysis method was reading the spectra and there was a sample of many compounds, it can be seen from the number of peaks in the GC spectra. Depended on the retention time data that has been known, it can be known what compounds were in the sample. The chromatogram consists of a peak, where one peak represents a specific molecule. In GC systems minimal separation was determined by various peaks in the chromatogram that correspond to different components.Figure 2 shows the chromatogram of the compounds of raw and roasted Congolese Coffee (Arabica L). The active compounds with their peak number, concentration (peak area %), structure and simple structure presented in Tables 1, 3 and, 5 before dye and Tables 2, 4 and 6 after dye which showed the presence of 1-22 active compounds in the extract of Congolese Coffee (Arabica L).
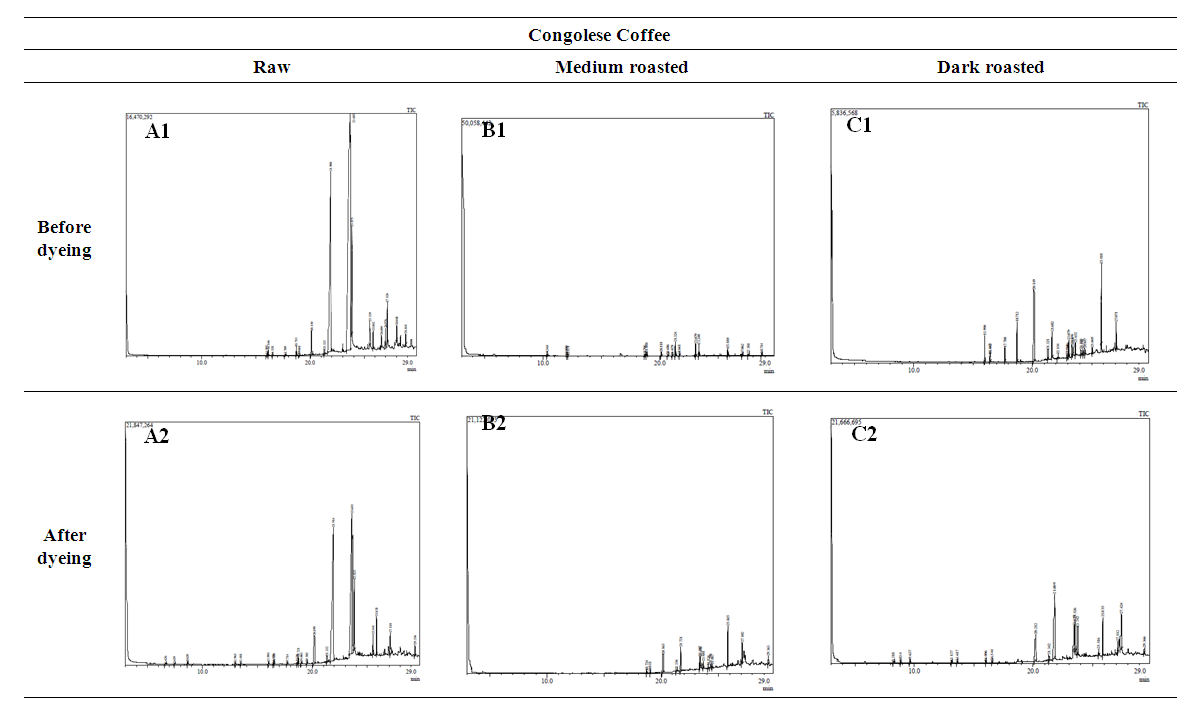 | Figure 2. GCMS spectral graph of extracts of Congolese coffee (Arabica L) |
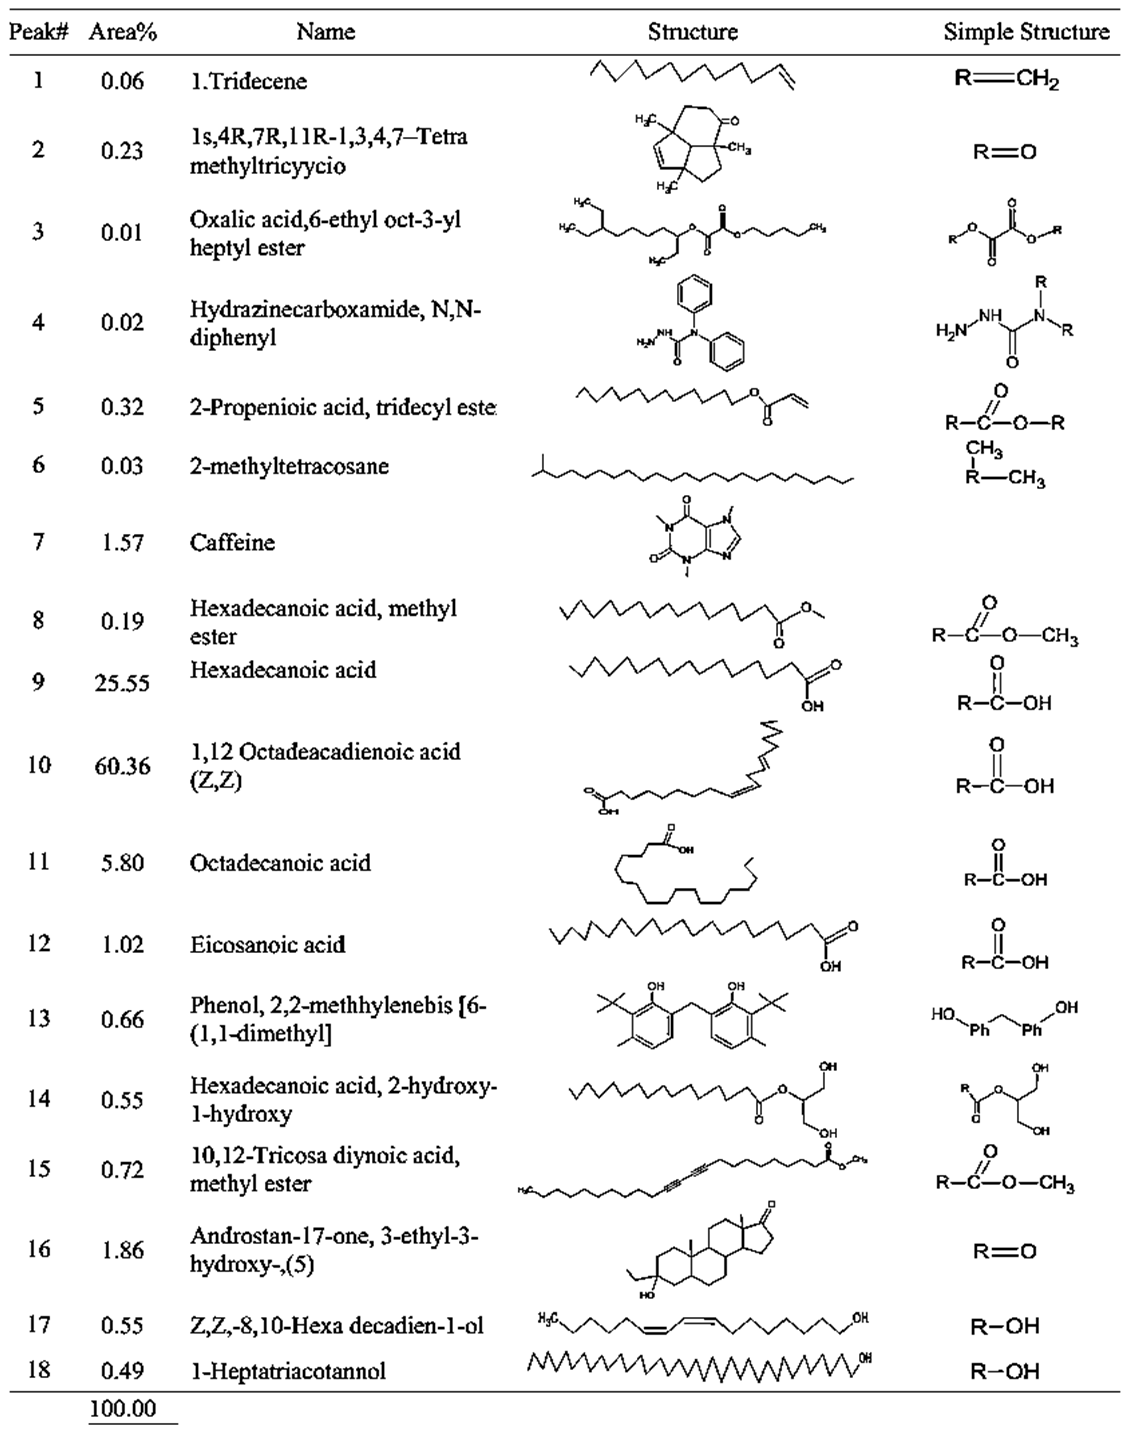 | Table 1. GCMS spectral analysis of extracts of raw Congolese coffee (Arabica L) before dye (A1) |
 | Table 2. GCMS spectral analysis of extracts of raw Congolese coffee (Arabica L) after dye (A2) |
 | Table 3. GCMS spectral analysis of extracts of medium roasting Congolese coffee (Arabica L) before dye (B1) |
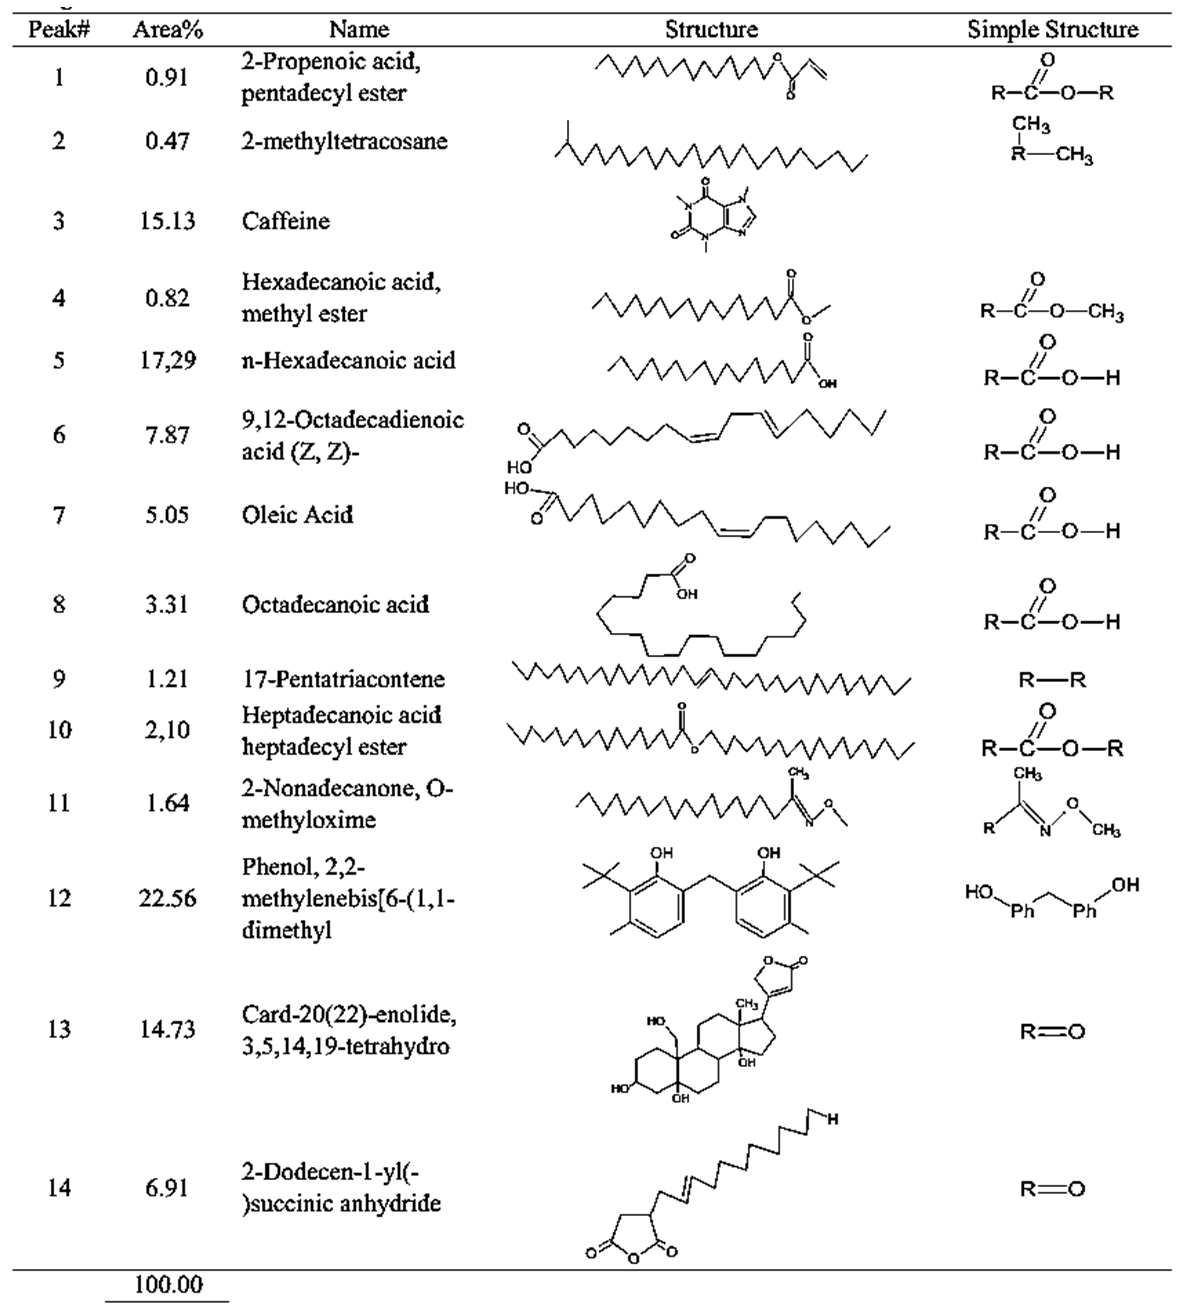 | Table 4. GCMS spectral analysis of extracts of medium roasting Congolese coffee (Arabica L) after dye (B2) |
 | Table 5. GCMS spectral analysis of extracts of dark roasting Congolese coffee (Arabica L) before dye (C1) |
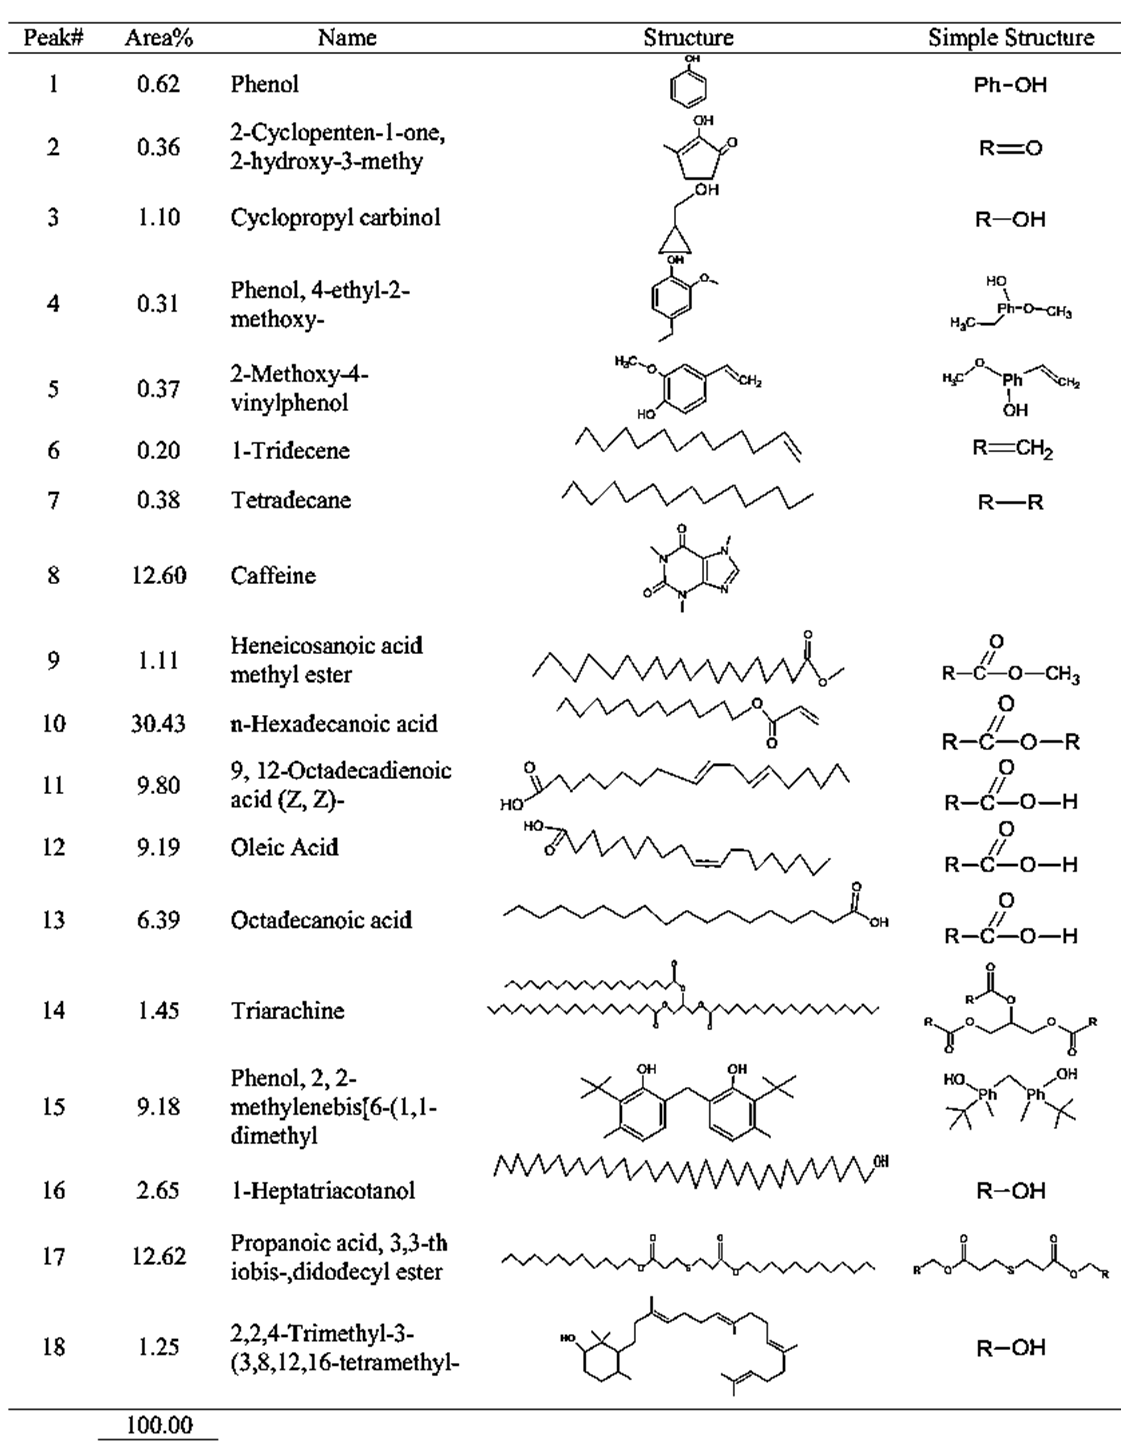 | Table 6. GCMS spectral analysis of extracts of dark roasting Congolese coffee (Arabica L) after dye (C2) |
 | Figure 3. Scheme for the mechanism of raw Congolese coffee (Arabica L) and Cotton fabrics |
 | Figure 4. Scheme for the mechanism of medium roasting Congolese coffee (Arabica L) and Cotton fabrics |
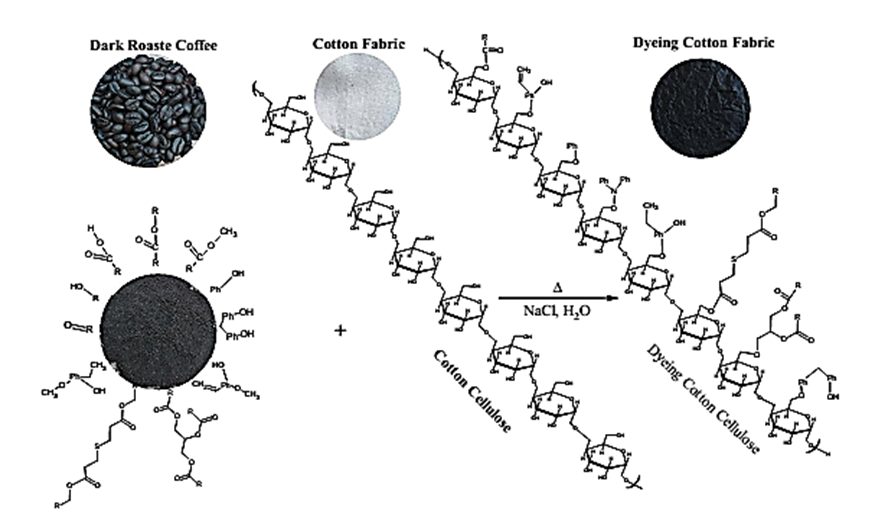 | Figure 5. Scheme for the mechanism of dark roasting Congolese coffee (Arabica L) and Cotton fabrics |
3.4. Color Fastness Result
- Color fastness (Washing and Rubbing fastness) of fabrics dyed with Congolese Coffee (Arabica L) raw coffee, medium-roasted and dark-roasted coffee extracts are shown in Table 1. Color fastness was in the range of 4 – 5 ratings with the exception of fabrics dyed with coffee. The washing fastness of the cotton and polyester fabrics (control) and the dyed fabrics for Congolese coffee were shown very good to excellent results, while the rubbing fastness obtained were shown excellent results for dry rub fastness, but the wet rub fastness were to be very good.
|

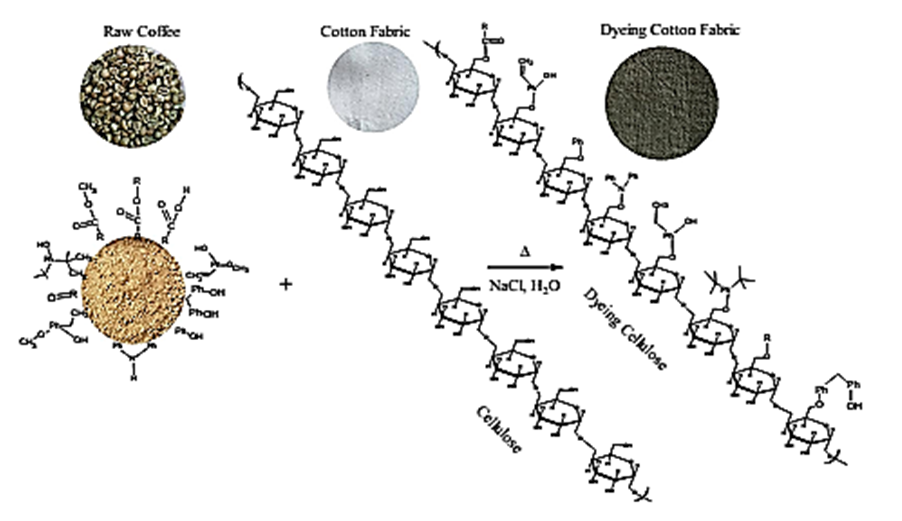
3.5. Mechanism of Congolese Coffee and Cotton Fabrics
- The characteristic of Coffee (aroma and the dark-colored) compounds leads to the formation and Coffee roasting process. The result of the reaction that takes place between carbohydrates or degraded carbohydrates and proteins and flavor compounds were mainly formed. The Medium colored compounds are referred to as intermediate roasted Coffee, whereas dark roasted Coffee should contain more roasted Coffee that have evolved towards the final structures. Acids and phenols are extremely reactive under roasting conditions. These acids in the reaction as they have free groups available for reaction and were involved in the formation of both flavor and color of Coffee.The most components in raw Coffee beans are carbohydrates, proteins, lipids, and acids as can be seen from the compositional data for Congolese Coffee (Arabica L) beans as displayed in Tables 1, 3 and 5 before dyed fabrics and Tables 2, 4 and 6 after dyed fabrics. This compilation provides a resume of the data available and shown in Figure 3, 4 and 5 Scheme for the mechanism of Congolese Coffee (Arabica L) and Cotton fabrics of raw Coffee without roasted, medium roasted and dark roasted respectively including compounds the simple structure of this compounds shown in Tables 2, 4 and 6 all this compounds in a powders Coffee was dissolved in water and after that increase the temperature to 90C and added to sodium chloride after that converted as the dye material bonding in Cotton cellulose shown the mechanism of raw, medium roasted and dark roasted Congolese Coffee (Arabica L) and Cotton fabrics. The surface chemical changes caused and the process is sketched in Figure. 3, 4 and 5. The structural changes of a cotton fabric dyed with Coffee dyes using FTIR it is displayed in Figure 1 when Cotton fabric surface are dyed with Coffee, the following chemical reactions were expected to occur at the Cotton fibers surface.
4. Conclusions
- Coffee beans undergo some physical changes and several chemical reactions during roasted process. Several functional properties were ascribed. Based on the findings of the study it can be enclosed that the extract of Congolese Coffee (Arabica L) exhibited 1-22 major compounds which are useful for textile coloration and mechanism. Numerous factors throughout the Coffee production chain, from plant to dye, have been shown to effects on the color and flavor of Coffee. This research were determined the volatile, non-volatile and coloring compounds in green and roasted Coffee which decide its color.Coffee was roasted at different roasting time and temperature. Roasting of raw coffee beans is an essential step in the Coffee production process as it induces chemical reactions that lead to the formation of the characteristic Coffee flavors and being the dark-colored components. The water-soluble brown colored compounds that were formed and referred to Coffee changed its color during roasting process, Depending on the roasting intensity and it follows that roasted Coffee can show a brown color in medium roasted and dark brown in intense roasted. The degree of roasted was a parameter for the extent of roasted and is defined as the total weight-loss that occurs upon roasted, including the water evaporation. Alternatively, the extent of roasted was also often expressed by the organic roast losses.
ACKNOWLEDGEMENTS
- This work was partially supported by the General Director of Scientific Research and Innovation, Ministry of Higher Education and Scientific Research, Republic of Sudan.