A. K. M. Ayatullah Hosne Asif, Md. Zayedul Hasan, Jahir Uddin Mohammad Babur, Md. Muzahidul Islam Sheikh, Alok Biswas, Md. Kayum Uddin, Sohel Rana
Department of Textile Engineering, Mawlana Bhashani Science and Technology University, Santosh, Tangail, Bangladesh
Correspondence to: A. K. M. Ayatullah Hosne Asif, Department of Textile Engineering, Mawlana Bhashani Science and Technology University, Santosh, Tangail, Bangladesh.
| Email: |  |
Copyright © 2019 The Author(s). Published by Scientific & Academic Publishing.
This work is licensed under the Creative Commons Attribution International License (CC BY).
http://creativecommons.org/licenses/by/4.0/

Abstract
The aim of this study was to investigate the manufacturing performance at sewing section through lean manufacturing principle in garment industry. The fundamental idea behind the concept of lean manufacturing consists to eliminate waste, which does not add value to the end product. Lean manufacturing is considered as one of the most influential activities that focus on cost reduction by eliminating non-value added activities. This paper addresses the relevance of lean manufacturing philosophy for the higher productivity in sewing section of the garments industry and pull out the frequent scenario of garments sector of Bangladesh by mentioning the existing pictures of sewing section. In this work, the existing layouts were studied and then lean manufacturing ideas are proposed to enhance the production system and some cellular manufacturing philosophies to find out the improved level of performance and productivity particularly in the garments section of that factory. All the operations related to different garments styles standard allowed minute or SAM were calculated. The resultant value of SMV for each style including and excluding non productive time were; Evelyn College – 6.20 and 5.23 min; Rodeo Long Sleeve – 7.53 and 6.43 min; Ramona MC01 - 7.05 and 5.87 min; Ramona MC03 - 6.95 and 5.74 min respectively. From this research work, various types of problems related to waste and various weaknesses of sewing section have been evaluated by using specific lean manufacturing tools as well as sewing performance has been measured in terms of effectiveness, time and quality. Waste related non productive activities and productivity are the two major issues in garments sector of Bangladesh. In this connection, this research was conducted. However, this research work proposes some recommendations for the future improvement of performance of the sewing section in garments industry.
Keywords:
Standard Minute Value (SMV), Standard Allowed Minute (SAM), Time Study, Non Value Added Activity
Cite this paper: A. K. M. Ayatullah Hosne Asif, Md. Zayedul Hasan, Jahir Uddin Mohammad Babur, Md. Muzahidul Islam Sheikh, Alok Biswas, Md. Kayum Uddin, Sohel Rana, Lean Manufacturing for Improving Productivity at Sewing Section in Apparel Industry: An Empirical Study, International Journal of Textile Science, Vol. 8 No. 1, 2019, pp. 1-9. doi: 10.5923/j.textile.20190801.01.
1. Introduction
It goes without saying that, the way of competing in the international market place is to simultaneously improve both quality and productivity on continual basis. The Apparel industry has been evolving over the years and is in a state of constant change, as different needs and technologies have arisen and responsiveness, quality and price are all major differentiating factors. The customer of the twenty-first century, demands comfortable, fashionable and innovative products in designs, color and services, those are fast, right, cheap and easy and the buyer has many more options available in terms of quality, variety and source of the product [1-2]. This puts pressure on apparel manufacturers to develop or upgrade their current systems or look for new production techniques in order to keep pace with the rapid changes and speed up their production in a continuous manner in order to fulfill orders, while at the same time improving its quality and reducing all related costs [3-4]. Due to more competitive production processes and fabrics handling are the urgent need of today can be attained through these new systems so as to not only satisfy fluctuating and unpredictable orders but also produce value-added garments. Lean is defined as the systematic approach to identify and eliminate the process wastages through continuous improvement [5-7]. In broader sense, Lean means elimination of non-value added activities and Kaizen means continuous improvement. Hence, Lean-Kaizen concept means continuous elimination of wastes through small-small improvements. Kaizen is also a popular procedure that applies to eliminate wastes at all levels of any organization. On the other hand, the main objective of Lean-Kaizen is the synchronized achievement of excellence in quality, cost and delivery which provides a better understanding for every individual of the organization to participate in achieving goals of the organization for achieving continuous improvements [8-10]. Application of lean manufacturing tools are now being practiced by organizations which aim to increase productivity, improve product quality and manufacturing cycle time, reduce inventory, reduce lead time and eliminate manufacturing waste [11-12]. The concept of lean production can also be described at different levels of abstraction: it can be defined as a philosophy, as a set of principles and as bundles of practices. According to the definition, lean production as a business and production philosophy that shortens the time between order placement and product delivery by eliminating waste from the product’s value-stream [14-15]. Furthermore, Lean Thinking is a systematic way and summarizes five critical elements of Lean implementation, i.e. value for the end customer, value stream mapping (VSM) and continuous flow; pull driven systems, and the pursuit of perfection [21].There are some issues for the implementation of lean may vary from country to country, geographic location within the country, and work culture of the organization [13]. But technically, improper processing practice, unorganized structure, and communication gap lead to surge several losses and wastes within organization which ultimately turn the organization ineffective [16-17]. On the other hand, another lean manufacturing tools like-Value stream mapping is a visual way of representing the flow of information and materials in the production of products. VSM application in a company which manufactures parts that makes up mobile phone bodies, button units and keypads [18-19]. Specifically, it is needless to say that, Lean Manufacturing has helped several industries to achieve operational and manufacturing excellence by increasing productivity and enhancing value, while reducing waste and costs [20].
2. Methodology
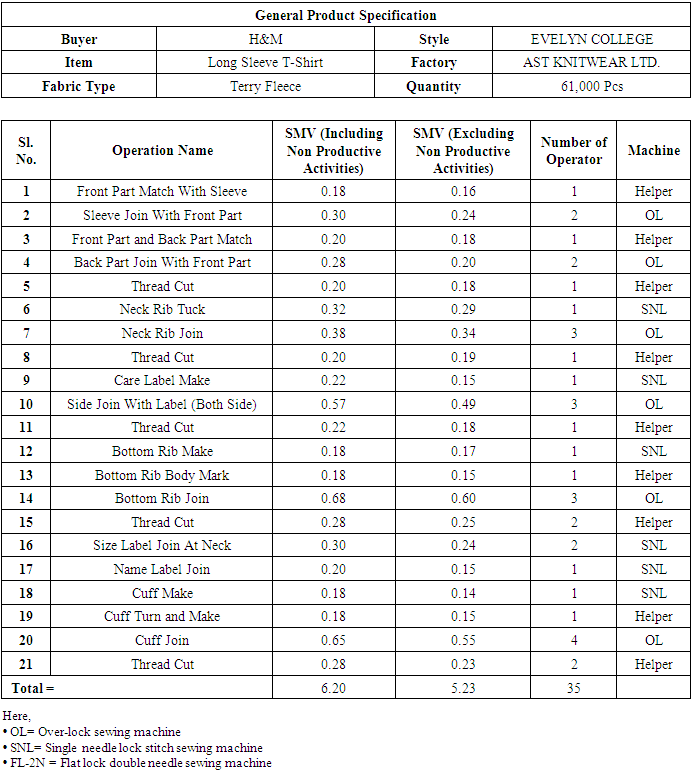
Table 2.1. Operational breakdown and SMV deviation for including and excluding Non Productive (NP) activities for style code: EVELYN COLLEGE
 |
| |
|
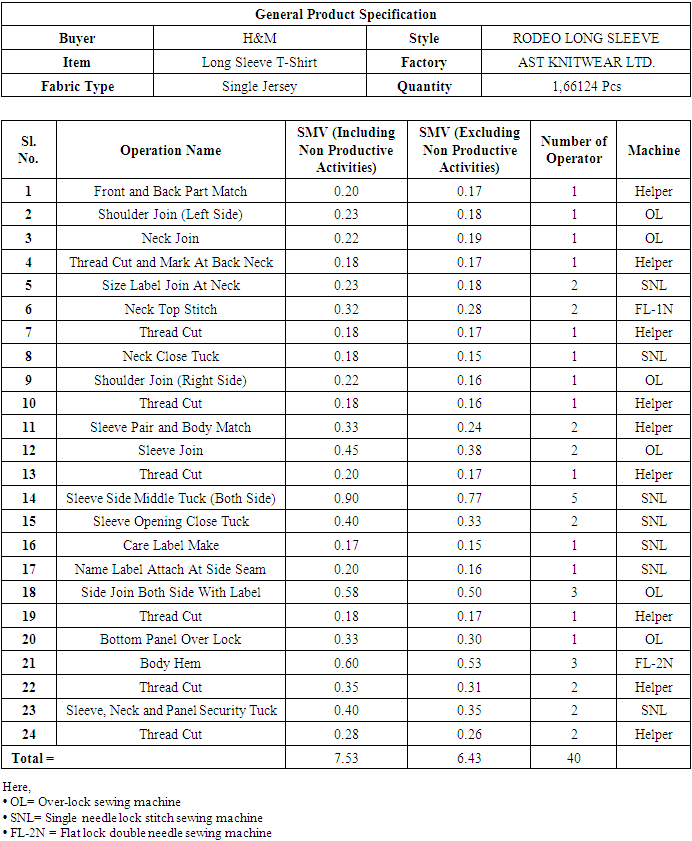
Table 2.2. Operational breakdown and SMV deviation for including and excluding Non Productive (NP) activities for style code: RODEO LONG SLEEVE
 |
| |
|
This study was conducted in a selected garment industry located in Gazipur, Bangladesh. The study gives an idea about the existing scenario of the sewing section of the garments industry. This study deals about various types of wastes of the industry, more specifically the waste of time. Several Lean Tools are used to investigate the existing situation of the selected garments industry that is discussed later. This section represents the necessary steps required to perform the lean techniques. The information and data collected were sorted and arranged so that further study and analysis could be performed. Quantitative data were analyzed by using tables and graphs. Various types of information were given as a profile. After completion of the data processing, the analysis has been performed.
2.1. Research Approach
A well reputed apparel manufacturing organization was selected to carry out for research. As the first step site tour was conducted in order to get a clear idea about the existing products and the overall process of the company. Four garment styles were selected (same garments design having color variation only) for application of lean manufacturing by collecting the relevant data. In order to carry out this task, one effective team with 5 members was formed. They were responsible for analyzing the raw material, cutting, sewing and finished goods departments’. We know different non-value added works have a great impact on productivity. Higher non –value added activities, higher standard minute value (SMV) leads to less final time of each step involved. Both for including and excluding non productive activities, SMV for each style was calculated. Then current state of lean manufacturing has been analyzed and various improvement proposals were identified to reduce the non-value adding waste. After that effective suggestion and recommendations were made.
2.2. Calculation of SAM or SMV through Time Study
Step 1: At first, one operation was selected about to calculate SAM.Step 2: Then one stop watch was used to measure cycle time. Stand by side of the operator. Cycle time for that operation was captured. (cycle time – total time taken to do all works to complete one operation, that means time from pick up part of first piece to next pick up of the next piece). Time study for consecutive five cycles was collected. Time that was got from time study is called cycle time. Convert this cycle time into basic time by multiplying cycle time with operator performance rating. [Basic Time = Cycle Time × performance Rating].Table 2.3. Operational breakdown and SMV deviation for including and excluding Non Productive (NP) activities for style code: RAMONA MC01
 |
| |
|
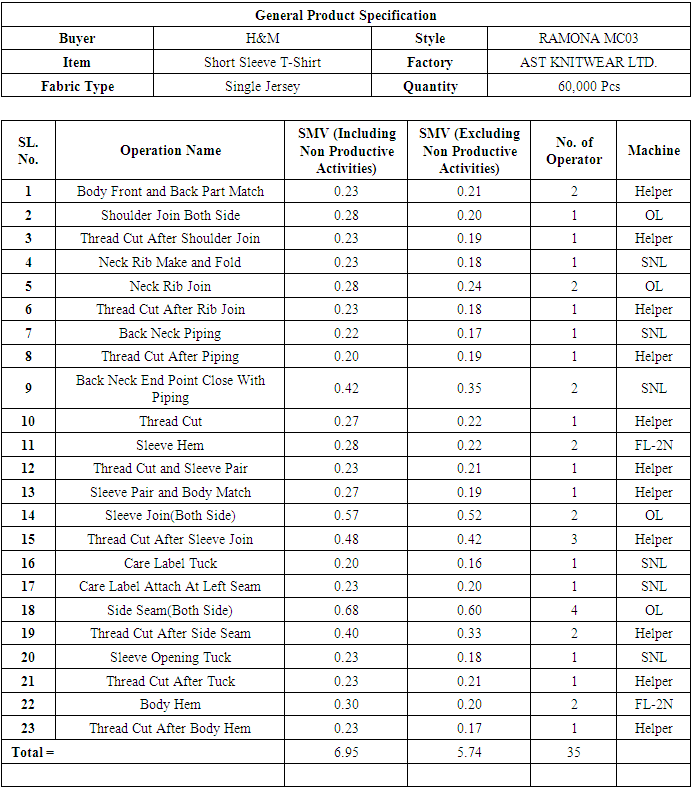
Table 2.4. Operational Breakdown and SMV deviation for including and excluding Non Productive (NP) activities for style code: RAMONA MC03
 |
| |
|
Step 3: Performance rating- Now it was time to rate the operator at what performance level he was doing the job, seeing his movement and work speed. Suppose that operator performance rating is 70%. Suppose cycle time is 0.66 minutes. Basic time = (0.66 × 70%) = 0.462 minutes.Step 4: Standard allowed minutes (SAM) = (Basic minute + Bundle allowances + machine and personal allowances). For calculation, bundle allowances (10%) and machine and personal allowances (20%) to basic time. Now Standard Minute value (SMV) or SAM was found. SAM= (0.462+0.0462 +0.0924) =0.6006 Minute. Similarly, for all the operation related to the above garments styles standard allowed minute or SAM were calculated. The approximate value of SMV for each style including and excluding non productive time is Evelyn College – 6.20 and 5.23; Rodeo Long Sleeve – 7.53 and 6.43; Ramona MC01 - 7.05 and 5.87; Ramona MC03 - 6.95 and 5.74 respectively. Value added and non value added time in each steps wherever found was identified for the above process for each style and the SMV or SAM in minutes were noted. Finally the ultimate SMV variation was calculated.
3. Results and Discussion
3.1. Analysis of Wastes in the Sewing Section
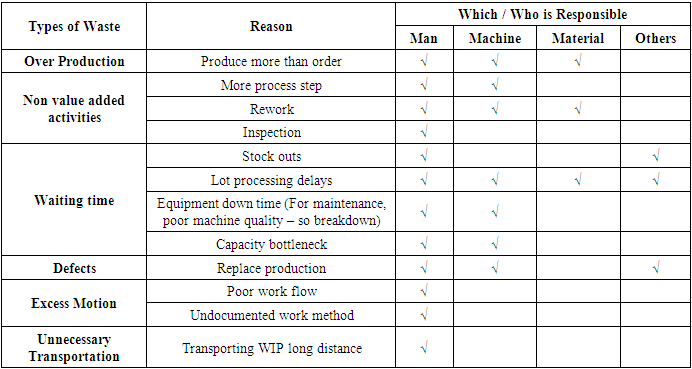
This study deals with various types of waste exists in sewing section more specifically time waste. The information has been gathered through the observation, time and motion study. The data was collected through the observation of the assembly floor and a few past records from the commercial, engineering and designing department of the chosen section. Looking at the current state of manufacturing several common causes were identified: (a) Excess inventories, (b) The difference between the total production lead-time and the value added time (c) Over processing, (d) Over production, (e) Excess motion, (f) Waiting time and other non productive activities were observed and recorded carefully. On the basis of these wastes the following table is constructed. This table represents the responsibility of man, machine, material and alternative issues against numerous varieties of wastes.Table 3.1. Profile of Wastes associated in sewing section
 |
| |
|
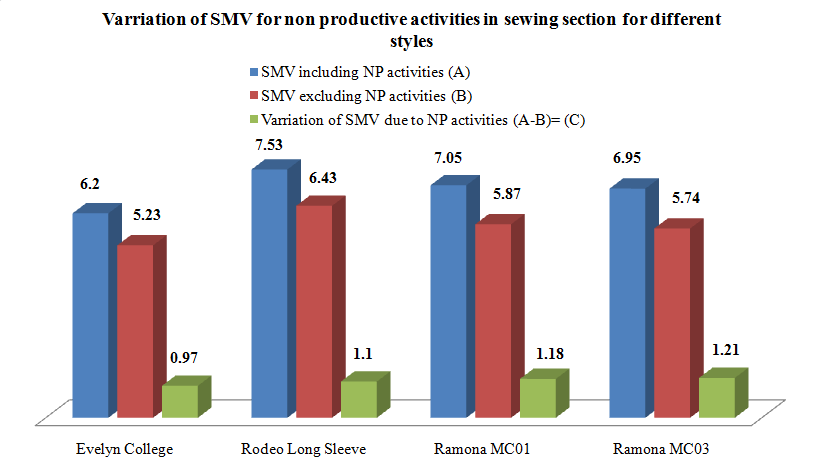 | Figure 3.1. Fabrics Style-wise SMV variations due to productive and non productive activities |
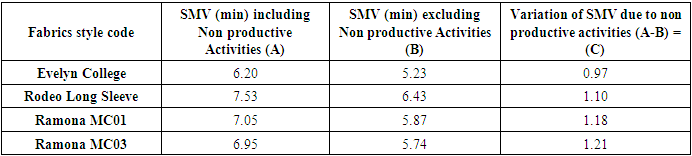
Here, table 3.1 shows SMV segregation of productive and non productive activities. These non productive time are due to, defects and reworks, waiting, over processing, over production, excess motion, wrong transportation, negligence of operators, no proper identification, zigzag movement due to improper layout, no proper planning, improper machine use, sharing of working instruments, absence of operators, workers’ fatigue, less experienced workers, poor machine performance, no standard operation followed by operator, machine break down, imbalanced line (work in process control), continuous feeding to the line, quality problem, individual operator performance level, operators absenteeism, etc.Table 3.2. Deviations of Standard minute value for non productive (NP) activities in sewing section for different styles
 |
| |
|
Table 3.2 shows the style-wise production rate of productive and non productive activities in lean manufacturing application in sewing section. As per the factory information, the unit CM costs for each garments in sewing section was taken into consideration to calculate the overall productive and non productive activities cost in terms of SMV, CM and production rate and consequent cost savings in ultimate factory expenditure. During the experimental observation, total productive and non productive times were identified separately and costs related to each time also calculated. Finally, cost savings for non productive activities time in terms of total time (both for including and excluding non productive time) required to finish the job were calculated.
3.2. Formulation for Production Estimation
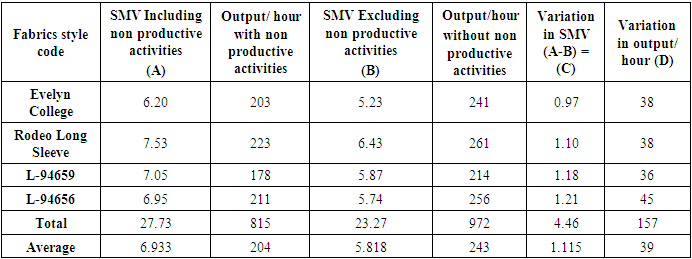
Daily production = Total man minutes available in a day/SAM × Average Line efficiency Total available man-minutes =Total no. of operators × Working hours in a day ×Efficiency. Suppose, SAM of the garment is 6.20 minutes, a line of 30 operators, works at 8 hours shift / day. Line works at average 70% efficiency. So, total available man minutes = 30 × (8 ×60) = 14400 minutes.Daily estimated production = 14400/6.20 × 70% = 1626 pieces/day (For SMV 6.20 min.) So, per hour production = 1626/8 = 203 pieces/hour Again, daily estimated production = 14400/5.23 × 70% = 1927 pieces/day (For SMV 5.23 min.) So, per hour production = 1927/8 = 241 pieces/hour From the above calculation, it was easily observed that due to SMV variation for including and excluding NP activities, variation in daily estimated production was (1927-1626) = 301 pieces. Variation in hourly production was (241-203) = 38 pieces approximately.In AST Knitwear Ltd. per day (8 hr shift) average production cost for the above experimental style is considered as $44.4 per dozen or $3.70 per piece. From the table 3.3, it is clearly observed that due to SMV variation for including and excluding non productive activities the sum of SMV is 4.46 min for which estimated production variation is 157 pieces per hour for the above four styles in four production lines. The table also indicates that due to non productive activities about 1.115 min extra SMV is required on average for which equivalent production loss per hour is approximately 39 pieces per line. So, we can calculate the average production loss in terms of total factory economy that is the way of costs savings for the industry.Table 3.3. Fabrics style code wise production rate variation at different levels of SMV
 |
| |
|
According to data analysis, it is observed that, average variation in production/hour / line is 39 pieces. The average factory earning loss / hour/ line: $3.70 × 39 = $144.3 The average variation in production / day / line: 39 × 8 = 312 pieces The average factory earning loss / day / line: $3.70 × 39 × 8 = $1154.4 The average variation in production / month / line: 39 × 8 × 26 = 8112 pieces The average factory earning loss / month / line: $3.70 × 39 × 8 × 26 = $30014.4 The average variation in production / year / line: 39 × 8 × 26 × 12 = 97344 pieces The average factory earning loss / year / line: $3.70 ×39 × 8 ×26 × 12 = $360172.8 Correspondingly, if this stature is taken into considerations in terms of total factory economy then a huge amount of factory earning loss could be saved easily that may have an important impact on overall factory economy. For example, from the above data analysis, it can be estimated that the earning figures for any factory as large as AST Knitwear Ltd. having 25 production lines that may save $ 9004320/year (25 lines × $360172.8). Therefore, the earning loss was calculated at about $9004320/year.
4. Conclusions
In recent industrial perspectives, it is difficult to identify the key areas and practices, which can be used to eliminate waste in their processes. According to this practical experiment conducted, it can be seen that lean manufacturing can be effectively applied to apparel industry as the key step of waste identification. By applying lean manufacturing tool, it is possible to map the current status and subsequently analyze to achieve waste elimination. Thus the study presented in this paper, has shown various wastes such as transport, inventory and defects, over processing, excess motion, over production etc can be reduced to a vast amount which in turn improves the productivity of the organization. In order to carry out this task, the managers of the case company have to implement approaches like 5S, one piece flow, Cellular manufacturing etc. Thus, lean manufacturing helps the organization to think about the present level of wastes occurring in the organization and the future possibilities of reducing or eliminating them. With a view to continuously reduce or eliminate waste, management of companies needs to apply different Lean tools and techniques accordingly while giving adequate training to their employees. Consequently organizations of similar type can use the research outcomes as a knowledge base to identify their wastes and come up with suitable remedies. Findings of this study can be valuable to other organizations of Bangladesh, which expect to execute lean manufacturing in the near future.
5. Recommendations
In order to lessen the non productive activities and improve the productivity in sewing section by the use of lean manufacturing; the following main opportunities were identified:Ÿ There should be least amount of waiting time in fabric cutting section before bulk Production starting, should reduce relaxing time of fabric in the cutting department, it is better to launch an electronic indication method for mechanic support. Ÿ Reduction of lot size relating to embroidery and printing, along with decoration can give accurate figures to suppliers. So proper coordination needed with printing or embroidery section. It is better to start one piece flow manufacturing in sewing department. Organize shipment weekly basic to reduce to finish good inventory.Ÿ By establishing proper arrangement for ratio packing. Use of folding boards and tools will be better for reduction of folding and packing time, measuring process, style wise locating the fabric in stores and measurement of only high risk area should be implemented. Ÿ It will be better for re-arrangement of washing and drying processes. Relocate panel inspection section inside the cutting department. Ÿ Elimination of numbering processes should be introduced. Furthermore, reduce the 100% panel inspection along with reduce number of quality checking points by implementing self checking process with the help of sewing machine operators.Ÿ In order to remove non value added activities, cut only next day sewing requirement along with establishing a visual link between cutting and production departments. Ÿ Fabric inspection time must be reduced. It will be better if factory can get testing reports, 100% shrinkage report from supplier from supplier on time. Confirmation of lot rejection and return of fabrics to the supplier whenever the fabric fails as per the point system should be well organized and also get the confirmation of fabric width from the supplier on time in order to remove wastes.
References
| [1] | Wilson, L. (2010). How to Implement Lean Manufacturing. 1st Edition McGraw Hill, New York. |
| [2] | Rebecca M. N., Aile T. A. (2015). Application of Lean Manufacturing Tools in a Garment Industry as a Strategy for Productivity Improvement. Asia Pacific Journal of Multidisciplinary Research, Vol 3, pp 46-53. |
| [3] | Rajab, A.H. (2010). The Current Awareness of JIT Technique With the Libyan Textile Private Industry: A Case Study. World Academy of Science, Engineering and Technology. |
| [4] | Stevenson, W.L. (2001). Production Operations Management. 6th Edition, Mc-Graw Hill, New York. |
| [5] | Fawaz, A.A., Jayant, R. (2007). Analyzing the benefits of lean manufacturing and value stream mapping via simulation: A process sector case study. International Journal of Production economics, 107, pp 223-236. |
| [6] | Lucy, D. M., Towers, N. (2004). Lean or Agile: A Solution for Supply Chain Management in the Textile and Clothing Industry. International Journal of Operations and Production Management, 24, pp 151-170. |
| [7] | Singh, B., Sharma, S.K. (2009). Value stream mapping as a versatile tool for lean implementation: An indian case study of a manufacturing firm. Measuring Business Excellence, 13, pp 58-68. |
| [8] | Vamsi, N., Jasti, K., Kodali, R. (2014). A literature review of empirical research methodology in lean manufacturing. Int J Oper Prod Manag, 34, pp 1080–1122. |
| [9] | Arya, A.K., Choudhary, S. (2015). Assessing the application of Kaizen principles in Indian small-scale industry. International Journal of Lean Six Sigma, 6, pp 369–396. |
| [10] | Barraza, MFS, Smith, T., Dahlgaard-Park, S.M. (2009). Lean-kaizen public service: an empirical approach in Spanish local governments. TQM Journal, 21, pp 143–167. |
| [11] | Bateman, N.A. (2005). Sustainability the elusive element of process improvement. International journal of operations and production management, 25, pp 261–276. |
| [12] | Tabanli, R.M., Ertay, T. (2013). Value stream mapping and benefit-cost analysis application for value visibility of a pilot project on RFID investment integrated to a manual production control system—a case study. The International Journal of Advanced Manufacturing Technology, 66, pp 987–1002. |
| [13] | Vinodh, S., Ben, R. R., Asokan, P. (2016). Life cycle assessment integrated value stream mapping framework to ensure sustainable manufacturing: a case study. Clean Technologies and Environmental Policy, 18, pp 279–295. |
| [14] | Grewal, C. and Singh, B. (2006). Application of value stream mapping in a traditional Indian environment: a case study, International Conference on Advances in Mechanical Engineering, pp 127-133(M-III). |
| [15] | Seth, D., Seth, N. and Goel, D. (2008). Application of value stream mapping (VSM) for minimization of wastes in the processing side of supply chain of cottonseed oil industry in Indian context, Journal of Manufacturing Technology Management, 19, pp 529-50. |
| [16] | Tapping, D. and Shuker, T. (2003). Value Stream Management for the Lean Office. Productivity Press, New York, NY. |
| [17] | Hallgren, M., Olhager, J. (2009). Lean and agile manufacturing: external and internal drivers and performance outcomes. International journal of operations and production management, 29, pp 976–999. |
| [18] | Mehmet C. K., Jason F. B., Joshua W. T. (2008). Lean manufacturing principles and their application. Cost Management, p. 16. |
| [19] | Narasimhan, R., Swink, M. and Kim, S.W. (2006). Disentangling leanness and agility: An empirical Investigation. Journal of Operations Management, 24, pp 440-457. |
| [20] | Pirraglia, A., Saloni, D. and Van Dyk, H. (2009). Status of lean manufacturing implementation on secondary wood industries including residential, cabinet, millwork and panel markets. BioResources, 4, pp 1341-1358. |
| [21] | Islam, M. M., Khan, A. M., Islam, M. M. (2013). Application of Lean Manufacturing to Higher Productivity in the Apparel Industry in Bangladesh. International Journal of Scientific and Engineering Research, 4, pp 1-10. |

 Abstract
 Reference
 Full-Text PDF
 Full-text HTML