Abdul Azeem, Jahandad Nasir, Sharjeel Abid, Ahsan Zafar, Abdullah Sethi, Bilal Riaz
Department of Textile Processing, National Textile University, Faisalabad, Pakistan
Correspondence to: Abdul Azeem, Department of Textile Processing, National Textile University, Faisalabad, Pakistan.
| Email: |  |
Copyright © 2015 Scientific & Academic Publishing. All Rights Reserved.
Abstract
Drapery fabrics are viewed as one of the vital sorts of furnishing either it is utilized inside homes, or lodgings or restaurants or workplaces or meeting halls. This study emphasizes to model and optimize the performance properties like light transmittance, drape coefficient and mean opacity of drapery fabrics made by cotton which could be predictable before their wet processing treatments. Fabrics of varying construction parameters i.e. yarn linear densities and thread densities were selected and tested for light transmittance, drape coefficient and fabric thickness. Four variables were selected as input parameters on basis of statistical analysis i.e. warp yarn linear density, weft yarn linear density, ends per inch and picks per inch. All the testing was conducted in ISO certified laboratory of textile testing using the standard testing procedures of ASTM D3691/D3691M–09. The testing of different fabric samples including fabric light transmittance, opacity and drape coefficient was conducted according to testing method lab developed LUX meter, AATCC 6/ISO 105-J01 and ISO 9073-9 respectively. Response surface regression was applied on the collected data set in order to develop a model of the selected variables. The model showed satisfactory predictability when applied on data and yielded an absolute average error of 5.1%. Thread densities, ends per inch and picks per inch played a vital role in determination of cover factor and slight variation in these variables could cause significant effect on performance properties than yarn linear densities. The developed model can be effectively used for prediction of light transmittance, drape coefficient and mean opacity for the current research of drapery and curtain fabrics as well as for technical fabrics.
Keywords:
Drape Coefficient, Opacity, Lux meter, Response surface regression
Cite this paper: Abdul Azeem, Jahandad Nasir, Sharjeel Abid, Ahsan Zafar, Abdullah Sethi, Bilal Riaz, Modeling and Optimization of Performance Properties of Drapery Fabrics Made by Cotton, International Journal of Textile Science, Vol. 4 No. 3, 2015, pp. 60-65. doi: 10.5923/j.textile.20150403.02.
1. Introduction
Coverings and curtains in drapery family are probably the most basic method for decorating and controlling temperature and light. These can be defined as straight panels of fabric that cover an area e.g. window and they may be set up for decorative purposes. When term “drapery” is used, it is expected that some kind of constructed top will be used. These constructed tops are often referred to as drapery “heading” and type of heading generally determines style of drapery [1]. Curtains have been used for shading purposes in green houses and shade halls for a number of years [2]. Heating costs for greenhouses in cold climates reached nearly a dollar per square foot per month. Curtain fabrics are used for two main purposes: first is beneficial, as the glass windows and wall holes to allow a person practices his personal life freely enough, or with the purpose of sound absorption and thermal insulation and protection of furniture from the harmful effect of sun rays (UV) especially in modern buildings of big glass faces. The second is Aesthetic represented in addition of art touch as an aesthetic value [3]. The world has changed and growers had a dramatic incentive to search for ways to cut energy costs. One approach to conservation of fuel and dollars that growers tried was internal curtain systems for heat retention. The acceptance of curtain systems for heat retention in greenhouses and other drapery functions paralleled this trend [4].By 1998, just over 34% of growers polled reported to have curtain systems. An additional 31% planned to retrofit curtain systems into existing houses and 38% said they plan to include a curtain system in any new houses that they build [4]. Researchers have used several ways to quantify reduction of solar gain on drapery fabrics. Keys (1967) for example by careful analysis of fabric transmittance, yarn reflectance and openness factor, was able to reconcile the yarn reflectance-openness chart with the fabric reflectance-transmittance chart [5]. N. A. Ibrahim et al. attempts to investigate how fabric construction as well as post-treatment finishes affects the mechanical, tactile performance, and comfort properties of the finished cellulosic fabrics [6]. Saadia O. K interested in study of the effect of difference material type on the functional performance [3].However, there is a lack of efforts which cover the scope of modelling and optimization of the performance properties like light transmittance, drapability and opacity of drapery fabrics formed by cotton from the given yarn properties. Therefore, the problem of forecasting these properties by modelling and optimizing of weaving through wet processing still remain unfocused for the past years.In this study we developed the mathematical model of selected variables by response surface regression and optimize the performance properties as light transmittance, drape coefficient and mean opacity of plain weave cotton fabrics in which one can easily predict the performance properties of drapery fabrics well before wet processing of drapery fabrics. Four variables were selected as input parameters on basis of statistical analysis i.e. warp yarn linear density, weft yarn linear density, ends per inch and picks per inch. The model showed satisfactory predictability when applied on data and yielded an absolute average error of 5.1%. The developed model can be effectively used for prediction of light transmittance, drape coefficient and mean opacity of the drapery and also would be able for the fabrics apart from aesthetic.
2. Materials and Methods
2.1. Materials
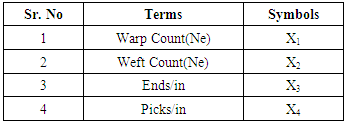
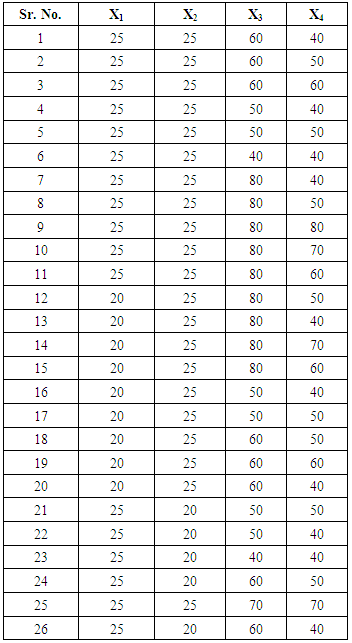
A total of 26 fabric having pattern of 1/1 plain weave made from cotton varieties were selected for modelling the transmittance, opacity and drape coefficient. Yarns of two different linear densities (20 and 25 Tex) were used in the fabrics. Five different levels of ends per inch and picks per inch are used 40, 50, 60, 70 and 80. The selected fabric samples were uniformly varied in linear density and thread densities so that they present all possible combinations of each input variable with other. The selected fabric constructions and symbols are given in Table 1 & 2.Table 1. List of Abbreviations
 |
| |
|
Table 2. Specifications of the fabric used in this research
 |
| |
|
Chemicals used for the pre-treatment of drapery fabrics were enzyme Bactasol PHC liq. Hc. based on bacterial alpha amylase, wetting agent Hostapal NI which is alkene oxide adduct non-ionic based and stabilizer SIFA liq. Polyacrylic acid derivative were purchased from Clariant International Ltd. While commercial grade acid, oxidizing agent H2O2, Na2CO3 and NaOH were used from local manufacturer. The fabric samples were processed for desizing, scouring and bleaching on a lab scale F-24 Jigger from England.The fabric samples were tested for light transmittance, opacity and drape coefficient and the testing equipment used for this purpose are UV/Visible Spectrophotometer (Color Eye 7000A) for determination of opacity of fabric by Macbeth, lab developed Drape Tester for determination of drape coefficient of fabric digitally, LUX Meter for the determination of light transmittance of fabric digitally made in Japan, Digital weighing balance (GF-300) weighing with accuracy up to 4 decimal by Kyoto, Japan, Pick glass for counting the number of warp and weft per unit length.
2.2. Wet Processing Method
Process of desizing, scouring and bleaching was done on jigger machine having same recipe for all samples. First of all samples were stitched according to the processing provision of lab scale Jigger available at wet processing lab. Second step was preparation of recipe according to experiments. Desizing was carried out at the temperature of 90C for 30 min at pH 6-7. Amylase based enzymes 6 g/l, salt 4 g/l, acetic acid 0.5 g/l, wetting agent 1-2 g/l were used. Solomatic bleaching was carried out at around pH 10.5 and temperature 85-90C. Bleaching recipe consists of 7 g/l of 35% H2O2, 2 g/l stabilizer and about 5 g/l NaOH and 2 g/l Na2CO3 and a liquor ratio 8:1 was maintained on Jigger. After processing, the fabric was dried and cut according to the different samples and testing of these samples was done and results were analyzed.
3. Results and Discussions
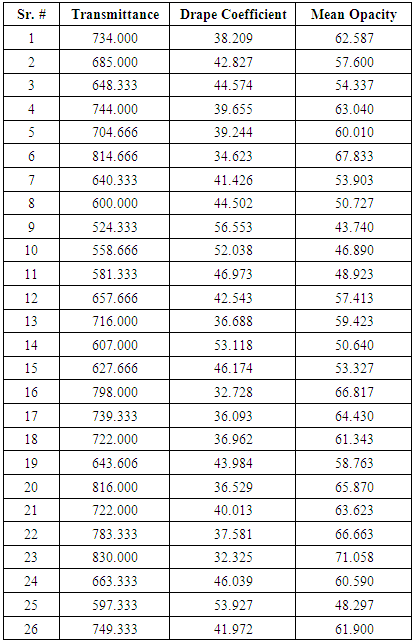
The experimental data is based on the selected fabric parameters i.e. Warp yarn count, weft yarn count, ends per inch and picks per inch. Minitab statistical analysis software was utilized for the analysis of data and development of the response surface regression model to determine relationships among the input variables. In this particular case, regression analysis has been successfully applied to the data for development of the model.The data was entered in the Minitab and analyzed by response surface regression. The data was then applied with response surface regression to develop the model for specified properties. The reason for selection of response surface regression rather than multiple linear regressions lies in the fact that response surface regression is a fully capable tool to model the linear as well as nonlinear relationships of the variables which is not possible in multiple linear regressions.The total data consisted of 26 samples of a variety of fabrics shown in table 3. The construction of the samples altered after pre-treatment, the reason is the removal of impurities during desizing, solomatic bleaching and as a result of which shrinkage was produced in fabric. Due to shrinkage, ends per inch were significantly increased and warp count is decreased but there was no significant effect on picks per inch and weft count as they do not get as relaxed as warp yarns.Table 3. List of actual input and output parameters of the samples
 |
| |
|
3.1. Effect of Selected Parameters on Transmittance
3.1.1. Effect of Input Parameters on Transmittance
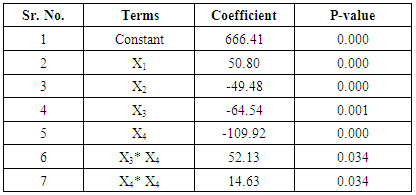
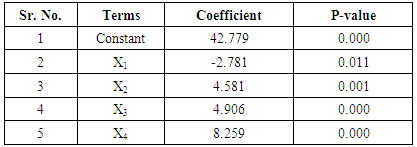
From the table 4, it was concluded that ends per inch (X3) and picks per inch (X4) had significant effect on transmittance (P ≤ 0.05). Both X3 and X4 had an inverse relation with transmittance, the increase in X3 and X4 caused decrease in transmittance values and vice versa.Table 4. Regression coefficients for factors of selected model (coded units)
 |
| |
|
The results obtained from surface plots of various parameters with transmittance fully confirm the established relationships of input parameters with the light transmittance characteristics of the fabrics as seen in figure 1. Increments in thread density either warp wise or weft wise, significantly enhanced the cover factor of the fabrics resulting in reduction of inter yarn spacing. Once the yarns were closer to each other, the porosity was reduced providing more hindrance to the light resulting in reduction of light transmittance of the woven fabric. 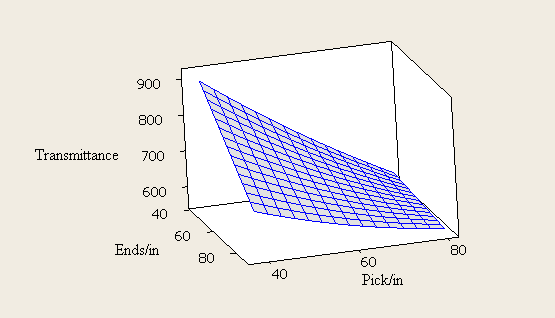 | Figure 1. Surface plot of picks per inch and ends per inch versus light transmittance |
From the table 4, it is concluded that warp count (X1) and weft count (X2) had significant effect on transmittance (P ≤ 0.05). Both X1 and X2 had direct relation with transmittance, the increase in X1 and X2 caused increase in transmittance values and vice versa.The counts of warp and weft were also negatively correlated with the light transmittance. From figure 2 the findings also complied with established facts of fabric structural characteristics that once the yarn diameter was increased it covered more space in a unit length as compared to a finer yarn. Increment in yarn diameter with count caused the pore size reduction in the fabric and enhancing its cover factor. This effect provided more hindrance to the light transmittance resulting in reduction of light transmittance of woven fabrics. However as the steeping of surface was relatively less in case of warp and weft counts as compared to thread densities Ends per inch and picks per inch, it could be inferred that effect of count was not as influential as that of thread densities.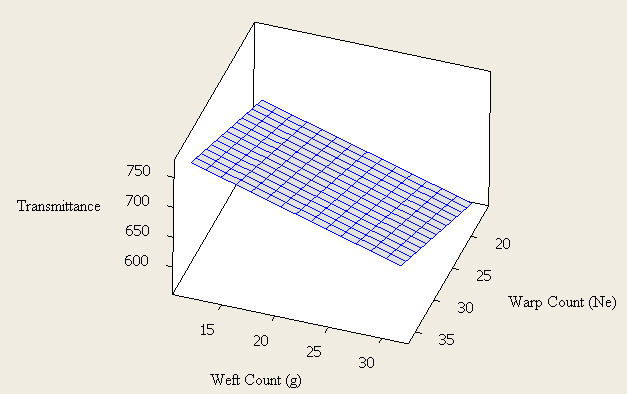 | Figure 2. Surface plot of weft count and warp count versus light transmittance |
3.2. Effect of Selected Parameters on Drape Coefficient
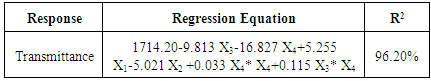
White fabrics transmit more light than the equivalent specification in a dark color, assuming the fabric is the same both sides. With 4% openness, white fabric transmits almost 4 times more light than the black fabric. Color of the sample affects the results of light transmittance. Distance factor between light source and curtain affect the results of transmittance. Distance factors between curtain and observer affect the results of transmittance. Intensity of light during day time keeps on changing that also affects the performance of the curtains which affects the results. Table 5 is model developed for prediction of light transmittance of fabrics.Table 5. Model for the prediction of transmittance with respect to input parameters
 |
| |
|
3.2.1. Effect of Input Parameters on Drape Coefficient
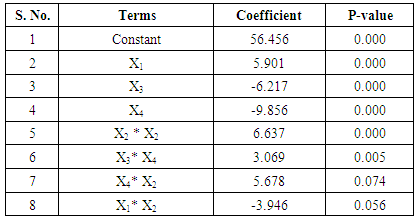
From the table 6, it was concluded that ends per inch (X3) and picks per inch (X4) had significant effect on transmittance (P ≤ 0.05). Both X3 and X4 had direct relation with drape coefficient, the increase in X3 and X4 caused increase in drape coefficient values and vice versa.Table 6. Regression coefficients for factors Drape Coefficient
 |
| |
|
Figure 3 shows the results obtained from surface plots of various parameters with drape coefficient fully confirmed the established relationships of input parameters with the drape coefficient characteristics of the fabrics. Increases in thread density either warp wise or weft wise significantly enhanced the weight and stiffness of the fabrics resulting in reduction of fall and bending property of the fabric. As the stiffness increased causing an increase in drape coefficient of the fabric that resisted the fabric to form pleasing folds of different nature due to its own weight.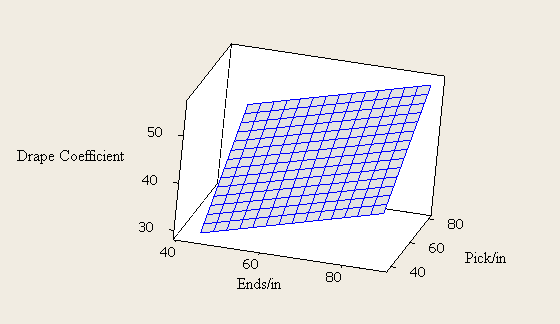 | Figure 3. Surface plot of picks per inch and ends per inch versus drape coefficient |
From the table 6, it is concluded that warp count (X1) and weft count (X2) had significant effect on transmittance (P ≤ 0.05). Both X1 and X2 had direct relation with drape coefficient, the increase in X1 and X2 caused decrease in drape coefficient value and vice versa.As in figure 4 the linear densities of warp and weft had also correlated with the drape coefficient. This finding also complied with established facts of fabric structural characteristics that once the yarn diameter was increased it covered more space in a unit length as compared to a finer yarn. Increment in yarn diameter with linear density caused the increase in weight of the fabric and enhancing its thickness. This effect gave more hindrance to the bending behavior resulting in increased in drape coefficient of woven fabrics. 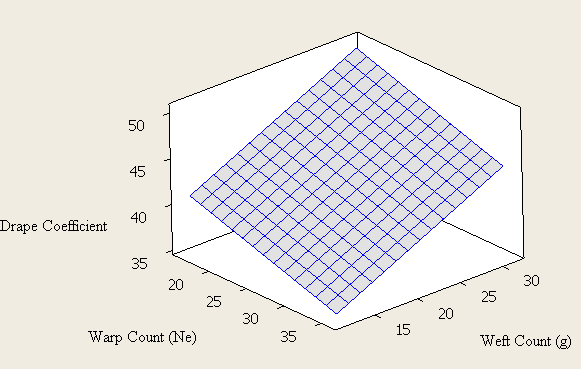 | Figure 4. Surface plot of weft count and warp count versus drape coefficient |
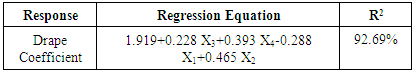
Drapability of a fabric is combined effect of several factors such as stiffness, flexural rigidity, weight, thickness etc. Stiffness, an attribute of fabric hand is one of the most important factors determining draping quality of fabric e.g. Soft fabric drapes closer to the body forming ripples whereas stiff fabric drapes away from the body. Stiffness of fabric itself depends upon geometrical parameters of the fabric. Drape of a fabric is affected by type of fiber, yarn, fabric structure, method of construction and finishing. By manipulating these parameters fabrics of different draping quality can be manufactured & used for creating garments of different styles. Table 7 is model developed for prediction of drape coeficient of fabrics.Table 7. Model for the prediction of drape coefficient with respect to input parameters
 |
| |
|
3.3. Effects of Input Parameters on Mean Opacity
3.3.1. Effect of Input Parameters on Mean Opacity
From the table 8, it was concluded that ends per inch (X3) and picks per inch (X4) had significant effect on transmittance (P ≤ 0.05). Both X3 and X4 had an inverse relation with mean opacity, the increase in X3 and X4 caused decrease in transmittance values and vice versa.Table 8. Regression coefficients for factors of Mean Opacity (coded units)
 |
| |
|
The results obtained from surface plots of various parameters in figure 5 with mean opacity fully confirmed the established relationships of input parameters with the light opacity characteristics of the fabrics. Increments in thread density either warp wise or weft wise, significantly enhanced the cover factor of the fabrics resulting in reduction of inter yarn spacing. Once the yarns were closer to each other, the porosity was reduced providing more hindrance to the light resulting in increased opacity of light of the woven fabric.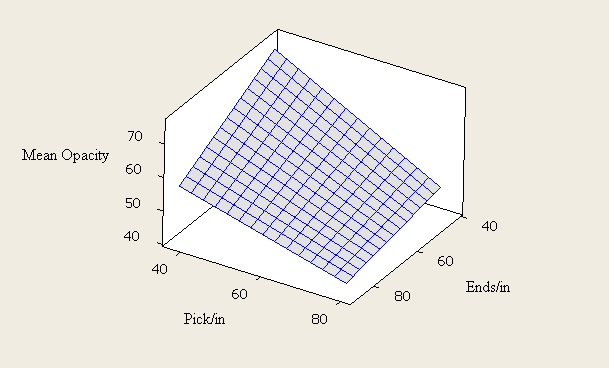 | Figure 5. Surface plot of picks and ends per inch versus mean opacity |
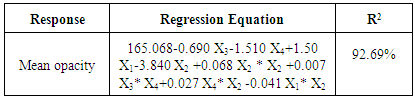
From the table 8, it is concluded that warp count (X1) and weft count (X2) had significant effect on transmittance (P ≤ 0.05). Both X1 and X2 had direct relation with mean opacity, the increase in X1 and X2 caused increase in transmittance values and vice versa.The linear densities of warp and weft were also correlated with the light opacity. Figure 6 also complied with established facts of fabric structural characteristics that once the yarn diameter was increased it covered more space in a unit length as compared to a finer yarn. Increment in yarn diameter with linear density caused the pore size reduction in the fabric and enhancing its cover factor. This effect provided more hindrance to the light transmittance resulting in increased light opacity of woven fabrics. Table 9 is model developed for prediction of mean opacity of fabrics.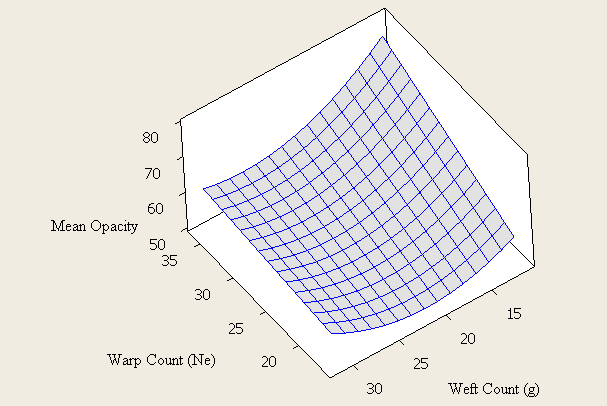 | Figure 6. Surface plot of weft count and warp count versus mean opacity |
Table 9. Model for the prediction of mean opacity with respect to input parameters
 |
| |
|
4. Conclusions
In this study, experimentation had been carried out in order to develop a response surface regression based model to predict the light transmittance, mean opacity and drape coefficient of plain weave woven fabrics. A total of 26 varieties of fabric samples were used in experimentation which were made from cotton woven fabrics with similar weave pattern. The model was developed on the basis of four input variables relating to the fabric construction i.e. warp yarn linear density, weft yarn linear density, ends per inch and picks per inch. The selection of the variables was made on expert opinion and literature review and further verified by statistical analysis which confirmed the suitability of the input parameters for the model.The concluded results fully complied with the established facts that thread densities ends per inch and picks per inch played a vital role in determination of cover factor and slight variation in it could cause significant effect on transmittance, drape coefficient and mean drape because of change in pore size of the fabric. Similarly the yarn linear densities warp and weft significantly affected the cover factor of the fabric but its influence was not as impacting as that of thread densities and due to this reason its relative contribution is lower than thread densities. The quantification of the input variables and their relative contribution determination for transmittance, drape coefficient and mean opacity of the fabric can serve for accurate prediction and optimization of important comfort parameter of woven fabrics. The model showed satisfactory predictability when applied on data and yielded an absolute average error of 5.1%. The coefficients resulted from statistical analysis showed that the minor changes in thread density can significantly vary the light transmittance, drape and opacity.
References
| [1] | Anonymous, Draperies and Curtain Education, Chapter 1, [Online] Available: http://www.draperyeducation.com/PDFs/EOSTPreviewOp.pdf. |
| [2] | Giiran Henningsson, CURTAIN FABRICS FOR GREENHOUSES AND SHADE HALLS, U.S. Patent 4,626,465, December 02, 1986. |
| [3] | Saadia O. K. Ibrahim, (2012), “The Effect of Material's Kind Variation on the Functional Performance Properties of the Woven curtains. Journal of American Science”, 8(4), [Online] Available: http://www.jofamericanscience.org/journals/am-sci/am0804/055_8395am0804_417_425.pdfYellot, J.I. (1965), Drapery fabrics and their effectiveness in solar heat control, ASHRAE Transactions 71 (1):260-72. |
| [4] | Anonymous, Curtain Systems, NGMA, [Online] Available: http://www.hort.vt.edu/ghvegetables/documents/Greenhouse%20Heating_Energy/NMGA_curtainsystems.pdf. |
| [5] | Keyes, M.W (1967), Analysis and rating of drapery materials used for indoor shading, ASHRAE Transactions 73 (1):8.4.1. |
| [6] | N. A. Ibrahim et al. “Effect of Knit Structure and Finishing Treatments on Functional and Comfort Properties of Cotton Knitted Fabrics, Journal of Industrial Textiles, Vol. 40, No. 1, July 2010. |
 Abstract
 Reference
 Full-Text PDF
 Full-text HTML