-
Paper Information
- Paper Submission
-
Journal Information
- About This Journal
- Editorial Board
- Current Issue
- Archive
- Author Guidelines
- Contact Us
International Journal of Textile Science
p-ISSN: 2325-0119 e-ISSN: 2325-0100
2015; 4(1): 1-8
doi:10.5923/j.textile.20150401.01
Improving Sewing Section Efficiency through Utilization of Worker Capacity by Time Study Technique
 Abstract
 Reference
 Full-Text PDF
 Full-text HTML
Farhatun Nabi 1, Rezwan Mahmud 1, Md. Mazedul Islam 2
1Department of Textile Engineering, Bangladesh University of Business & Technology, Dhaka, Bangladesh
2Department of Textile Engineering, Dhaka University of Engineering and Technology, Gazipur, Bangladesh
Correspondence to: Rezwan Mahmud , Department of Textile Engineering, Bangladesh University of Business & Technology, Dhaka, Bangladesh.
| Email: |  |
Copyright © 2015 Scientific & Academic Publishing. All Rights Reserved.
This paper represents the use of some tools and techniques for improving apparel sewing section efficiency throughout the production process. Now a day’s apparel manufacturing industries are trying to develop their current production system and situation and continuously looking for new production tools and techniques in order to keep swiftness with the rapid changes of trend in consumers of apparel products. To deal with the recent problems & challenges industries have to improve production efficiency & productivity; reduce lead time, ensuring proper quality requirements. There is no doubt that sewing section in an apparel industry is the most momentous and teeming department that plays a vital role in the whole firm. To improve the existing situation of this section and increasing productivity time study is a very effective technique. In time study, Standard Minute Value (SMV) has been calculated for each operation or job. Based on this technique each operators capacity is measured and balanced to eliminate the bottlenecks. Here, by applying these techniques significant improvements in the sewing section have been achieved such as SMV, man power, bottle neck, capacity achievable, production/hr, performance rating, balance % and line efficiency. The findings can be extended to similar apparel industries in future. General overviews to these works are presented in this paper.
Keywords: Sewing section efficiency, Worker capacity, Time study, Bottleneck, Line balancing, Productivity
Cite this paper: Farhatun Nabi , Rezwan Mahmud , Md. Mazedul Islam , Improving Sewing Section Efficiency through Utilization of Worker Capacity by Time Study Technique, International Journal of Textile Science, Vol. 4 No. 1, 2015, pp. 1-8. doi: 10.5923/j.textile.20150401.01.
Article Outline
1. Introduction
- Bangladesh has emerged as a key player in readymade garments sector since 1978.The RMG industries in Bangladesh has experienced an unprecedented growth over the last three decades and become fast growing industries in Bangladesh. The sector rapidly attained high importance in terms of employment, foreign exchange earnings & its contribution to GDP [2]. Many reputed buyers come to this country for lesser labor cost with high quality of product; but the training, capability, efficiency & productivity of labor in sewing section remain ignored throughout the whole time. Assembling apparel is a laborious process where in a simple tee-shirt producing sewing line consists of 25-50 workers with 18-40 sewing machines. So capacity variation occurs here very frequently as working capacity differs from men to men. When worker changes capacity of work also changes accordingly. For this type of variation balancing the maximum and minimum capacity is a challenging step for floor managers. Again garment industries in developing countries like Bangladesh are more focused on sourcing the raw materials & changing the cost of manufacturing charge because of the availability of cheap labor. Most of the apparel industries follow progressive bundle production system. This production system has many problems and bottleneck is one of them. Time study is a work measurement technique for recording the times of performing a certain specific job or its elements carried out under specified conditions, and for analyzing the data so as to obtain the time necessary for an operator to carry out at a defined rate of performance. Time study is most popular that is used for balancing the sewing line as well as solving the bottlenecks. An assembly line is defined as a set of distinct tasks which is assigned to a set of workstations linked together by a transport mechanism under detailed assembling sequences specifying how the assembling process flows from one station to another [13]. In assembly line balancing, allocation of jobs to machines is based on the objective of minimizing the workflow among the operators, reducing the throughput time as well as the work in progress and thus increasing the productivity [10]. However, in answering and to provide solution to many of such research problem, the study sought to accomplish several research objectives. Such as: examining the present level or situation of applying sewing section in apparel manufacturing organization in Bangladesh. Identifying and propose potential avenues for improving the present level of sewing section of apparel manufacturing. Also, minimizing SMV & wastages in the processes and helping the companies to achieve a shorter lead time, lower cost, highest quality, better performance rating, better works balance, increased production efficiency and to achieve more competitive advantages. This study is carried out in a reputed knit composite garment industry situated at Gazipur in Bangladesh. In this study a simple tee-shirt is analyzed and sewing line is visited several times for realizing the actual scenario.
2. Literature Review
- Productivity is measured by achievement toward established goals based on relationships between inputs and outputs [6]. Generally in sewing section line balancing means allotment of operations or jobs based on the objective of minimizing the throughput time as well as the work in process and thus increasing productivity. In sewing room, the breakdown of the total work content of a garment into operations has traditionally included long, medium and short operations, the actual length being influenced by the amount of work content in the garment, predicted quantity of output of an individual style, and the number employed in the company manufacturing it, with the consequent potential for specialization among its operators and managers. In this case an operation was the amount of the work content of a garment that was undertaken by one operator [7]. An operation is one of the steps in a process that must be completed to convert materials into a finished garment. An operation breakdown is a sequential list of all the operations involved in cutting, sewing and finishing a garment, component or style [6].Line lay out: A line lay out operates on the principle that each unit is produced exactly the same and those operations are performed in a specified sequence. Work often flows from the back of the layout to the front and from workstation to work station until the garment is completed. Line layout is most efficient with long runs (high volume of identical products) when the sequence of operations and equipment does not have to be changed frequently [8]. Depending on the volume required, a plant may have several lines making the same style or several lines each making different styles. Line layout does not necessarily mean each m/c is different. Several operators and helpers may perform the same operation. The objective is steady work flow through succeeding operations. If a style requires only one operator to hem the pockets and three operators to set pockets in order to keep work in process moving smoothly, then engineers will build that into the layout. Advantages of line layout may be less work in process than a skill center configuration and less handling between operations. This means faster throughput time and less buildup of parts between operations with high quality. Disadvantages of a line layout include potential bottlenecks (work buildup) and work load imbalance. Each operation depends on the previous one, and downtime, absenteeism, and slow operators may interrupt the workflow. To counteract these problems, some operators may need to cross-trained to perform more than one operation, and substitute machines must be readily available for immediate replacement if equipment breaks down. New trainees may be expected to meet production standards before being placed in a line position. Failure to meet production schedules for whatever reason may create a need to reroute work, shift personnel, or schedule to avoid further days [5, 6]. The managerial requirements of operation design in the PBU relate to the need for operators to be highly trained on the specific tasks that form the sequence of operations in the assembly of a particular garment style, and for the flow of work through these operators to be tightly controlled and well balanced [7].Progressive bundle system: The Progressive bundle system gets its name from the bundles of garment parts that are moved sequentially from operation to operation. This system often referred to as the traditional production system, has widely used by apparel manufacturers for several decades and still is used today. The technical advisory committee of AAMA (1993) reports that 80% of apparel manufacturers use bundle system. The committee also predicts that use of bundle systems would decrease as firms seeks more flexibility in their production systems. A progressive bundle system may require a high volume of work in process because of the number of units in the bundles and the large buffer of backup work that is needed to ensure a continuous workflow for all operators [6].The Progressive bundle system is driven by cost efficiency for individual operations. Operators perform the same operation on a continuing basis, which allows them to increase their speed and productivity. Operators who are compensated by piece rates become extremely efficient at one operation and may not be willing to learn a new operation because it reduces their efficiency and earnings. Individual operators that work in a progressive bundle system are independent of other operators and the final product [6].Time Study: At ANSI in 1982 Institute of Industrial Engineers state time study as, "A work measurement technique consisting of careful time measurement of the task with a time measuring instrument, adjusted for any observed variance from normal effort or pace and to allow adequate time for such items as foreign elements, unavoidable or machine delays, rest to overcome fatigue, and personal needs.” Time study is most popular and used method for line balancing and solving bottlenecks. One problem of time study is the Hawthorne Effect where it is found that employees change their behavior when they know that their being measured [14].Cycle time: Total time taken to do all works to complete one operation, i.e. time from pick up part of first piece to next pick up of the next piece [11, 12].SAM (Standard allowed minute): The amount of time required to complete a specific job or operation under existing condition, using the specified & standard method at a standard pace when there is plenty of repetitive work [9].Standard time = (Average observed time X Rating %) + Allowance%.Allowance: Different types of allowances are allowed in apparel production floor. Such as personal time allowance, Delay allowances, Fatigue allowances etc.Balance: Balance is an important factor. In traditional performance measurement approach, the most important goals of evaluation is performance measurement while modern approach has focused on evaluated growth and development capacity [2]. Peter Drucker in 1954 argued that one potential solution was to introduce ‘’balanced’’ sets of measures [3, 10]. Market standings, innovation, productivity, physical and financial resources, profitability, manager performance and development, worker performance and attitude, and public responsibility are appropriate performance criteria [1]. Modern evaluation system results in satisfaction improvement, efficiency improvement, and finally improvement in effectiveness of organizational activities [3].Bottleneck: A constraint for smooth flow of operation, limits the flow of production rate, productivity, efficiency is usually termed as bottleneck.
3. Methodology and Experimental Materials
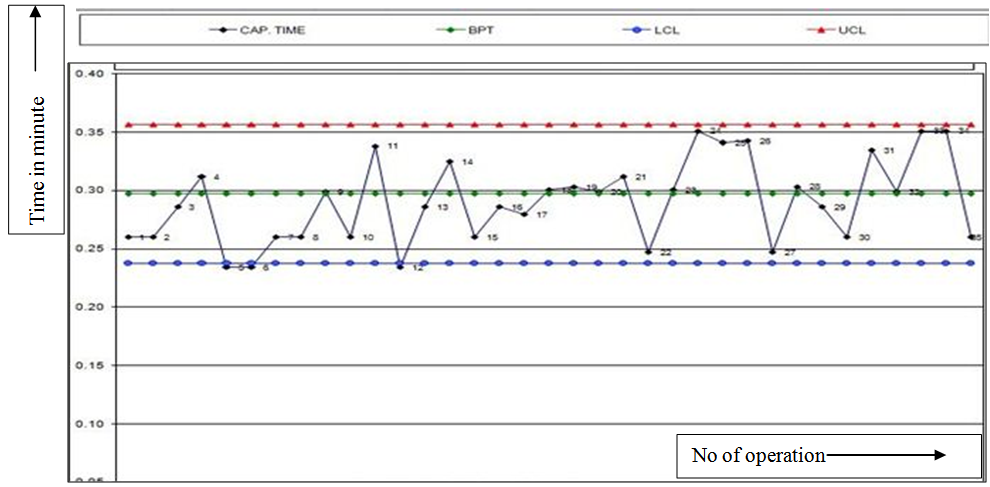
- Work measurement applies different types of techniques to determine the required time to complete one operation and the total work that can be performed by one operator in a specific time. It provides a fair way of estimating the time to do a skillful operator with plentiful work supply & proper equipment. Different work measurement techniques used by sewing floor managers are stopwatch study or time study, historical time study, predetermined data, standard data, judgment, operator reporting & work sampling. Among them stopwatch study or time study is the most popular. For conducting time study visit at sewing floor had done for several times to muddle through the actual situation of sewing floor. The technique of random sampling used for analysis of the time spent for rendering each phase of various professional work or service performed by worker of service man is known as time measuring or needed time to perform a work [14]. For conducting time study here traditional stop watch method was used. Here 10 cycle time for each operation was recorded and at the same time the name of the operator or helper, performance rating, attachment used and machine type was recorded in a time study template sheet. Before starting the time study, the breakdown of the progress of operation was done. After recording 10 cycle time; average cycle time was calculated from which normal time or cycle time was found. Average observed time = sum of the time recorded to perform each element/ Number of cycles observed [4].Then from cycle time standard minute value (SMV), production per hour, capacity was calculated. With the help of time study excel spread sheet line capacity graph was created. From the line capacity graph, the bottlenecks & capacity variations between the workers were visible clearly. After finding the bottlenecks in layout and imbalance of worker capacity from the worker capacity graph and time study graph, a change in layout and operation breakdown was done for effective flow of product. This changed breakdown shows better performance in case of work in progress and good through put time was achieved by solving the bottleneck points. For balancing the sewing line, here assistant was added or arrange training facility for the bottleneck creating worker or if the work load was too much; then load was divided within the higher capacity processing workers for maximum utilization of labor capacity & increase their productivity. By this way a more balanced & efficient line was found with higher productivity. Following table shows the condition of the specific sewing line before any modification was done.Identification of Bottleneck: From the above line capacity graph it is understandable that workers having lower capacity level are doing their jobs at operation number 12, 25, 33, 35 & 36 with more time that cross upper control limit(UCL) and it is approximately 34.5 second. They require more processing time for which cannot pass required amount of product to the next operator or next operation. These positions are creating bottlenecks. On the other side operators at operation number 1, 4, 5, 6, 10, 14, 18, 19, 24, 31 & 34 were doing the jobs more promptly than the requirement. So their capacity was unutilized because of imbalance. Here the bottleneck creating operators were provided training and also motivation was done for better performance. A change in the operation breakdown was also done. Finally where work load is excess that was distributed among the higher capacity possessing workers considering the layout. Thus the bottlenecks were solved and maximum capacity was utilized and most importantly productivity was improved. The following table shows the improved operation breakdown and line capacity graph with proper balance.
4. Results and Discussions
4.1. Calculations
- Here by analyzing worker psychology and sewing line condition existing workers was motivated and trained to work more consciously and efficiently. In this case before balancing the line operation no 5, 15 and 19 was eliminated by distributing their work load within the worker who possesses higher capacity.Calculation of Sewing Line Efficiency:Line efficiency = (Total production×SMV×100) / (No of operator ×Working hour ×60)Before balancing line efficiency: = (136×11.96×100)/ (50×1×60) =54.22 %After balancing the line efficiency = (145×11.62×100)/ (47×1×60) =59.74%Calculation of Sewing Productivity:Productivity = (output amount/input amount) ×100% Before balancing productivity = (136/300) ×100%
 = 45.33%After balancing productivity = (145/250) ×100%
  = 58%Calculation of Operation Capacity:Capacity/hr = (60/Capacity total avg. time) x total manpower.Before = (60/10.17) ×50 = 294.98After = (60/10.11) ×4 = 278.93Capacity achievable = capacity/hr x balance%Before = 294.98×0.45 = 132.74After = 278.93×0.85 = 237.09
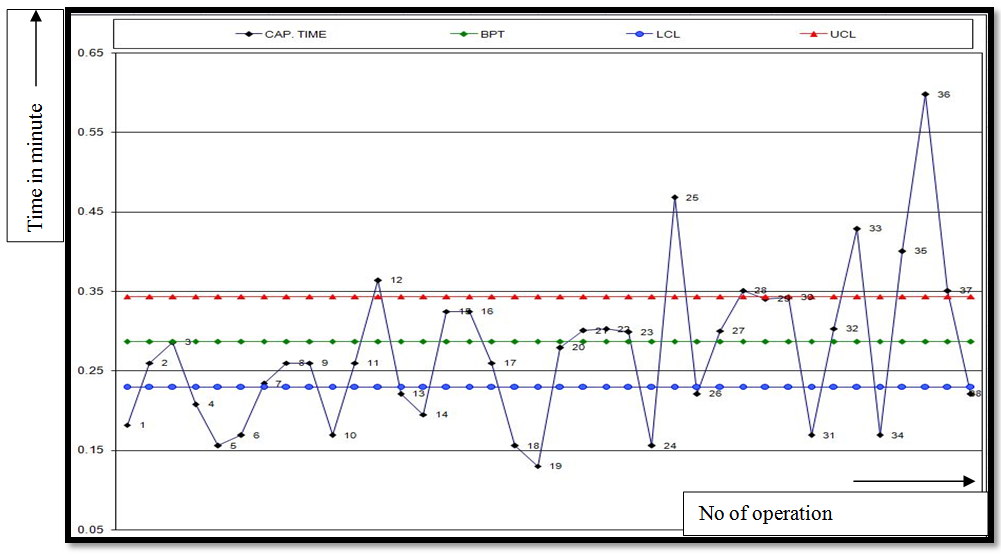 | Figure 1. Line capacity graph before balancing |
 | Figure 2. Line capacity graph before balancing |
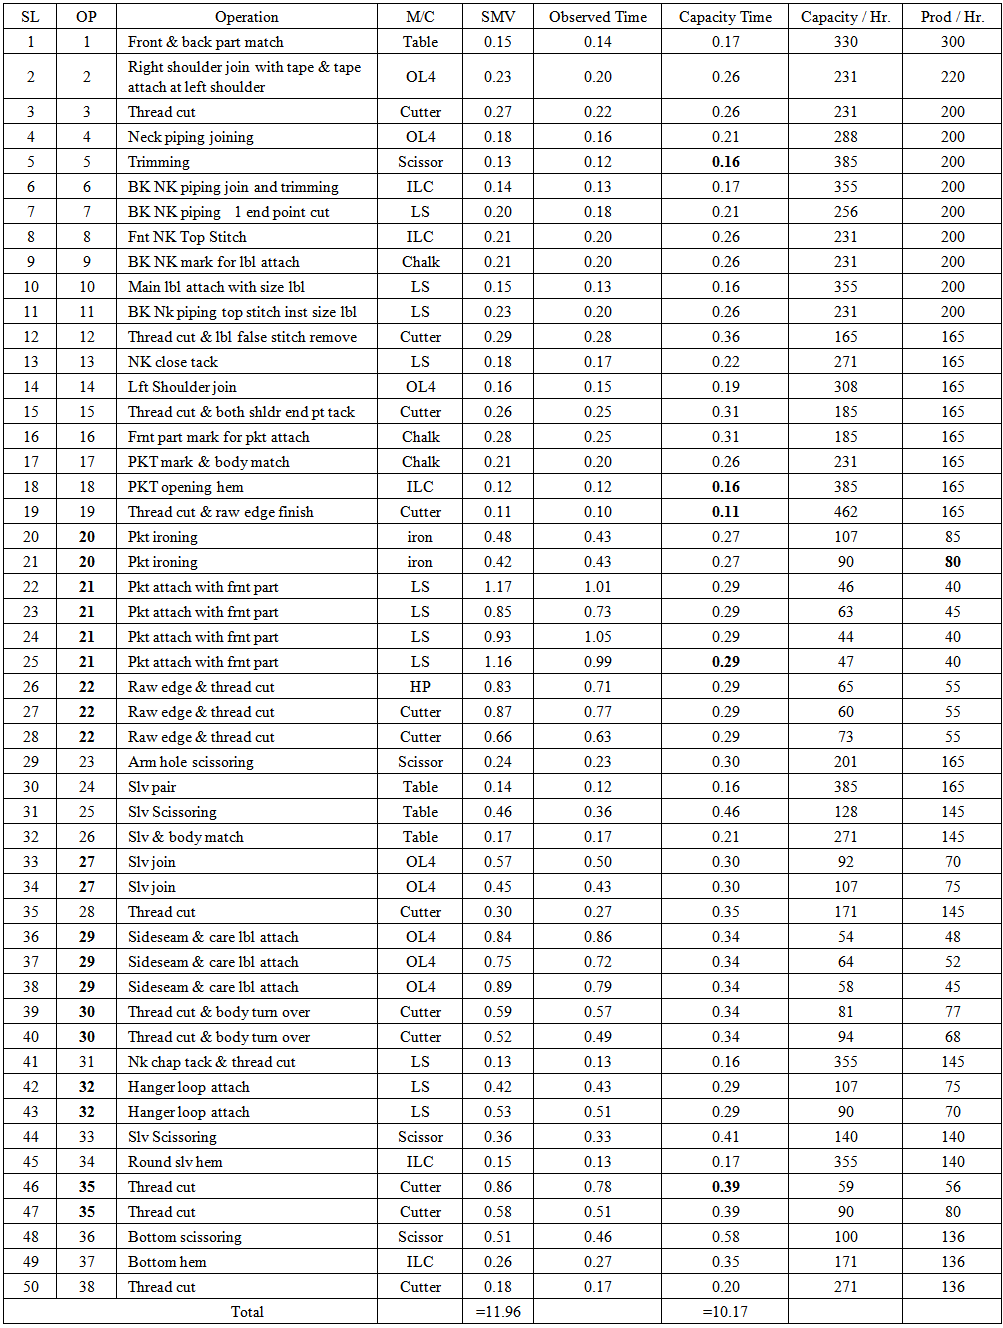 | Table 1. Time study chart before worker capacity balancing |
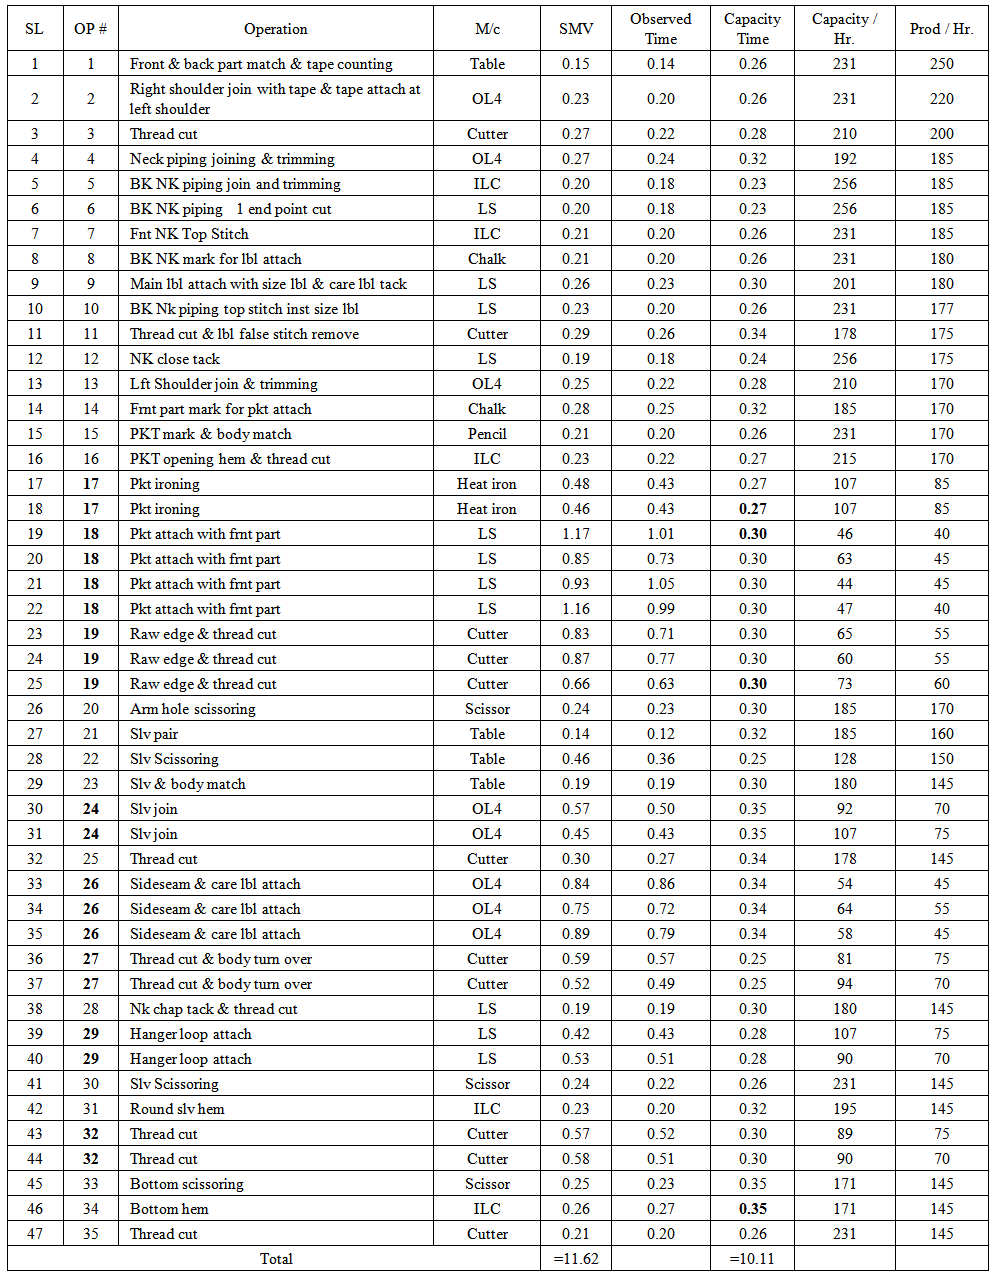 | Table 2. Time study after worker capacity balancing |
4.2. Reduction of SMV, Manpower and Bottleneck Constraints
|
4.3. Changes due to Worker Capacity Balancing
|
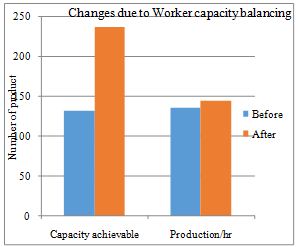 | Figure 3. Bar chart showing the changes due to worker capacity balancing |
4.4. Effects of Line Balancing
- Line balancing is important as it balance the line and increases the workers performance, line efficiency as well as productivity. In this research worker performance was improved at 87.5% from 85%, balance was improved at 85% from 45% and line efficiency was improved 5.52%. and most importantly productivity was improved to 58% from 45.33%.The effect of a balanced line is shown in following Table 5 and figure 4.
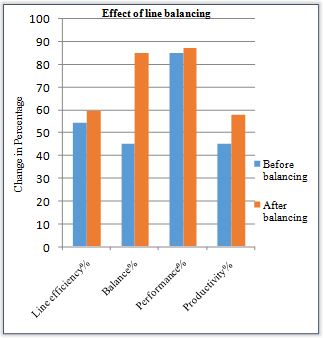 | Figure 4. Bar chart showing the comparison of Performance%, Balance%, Line efficiency% and Productivity% |
5. Conclusions
- In apparel industries sometimes it is difficult to identify the key areas and practices, which can be used to improve the current system & situation in the processes. Delivering high quality garments at low cost in shorter lead times are the major challenges faced by the apparel manufacturers [9]. Based on the practical experiment conducted, it can be seen that SMV and such like others tools can be effectively applied to apparel industries for better production efficiency. Using this tool, it is possible to map the current status and subsequently analyze to achieve better target. However, the work provides some ways of improvement to increase the line efficiency by applying time study and line balancing techniques. As a consequence, good line balancing with small stocks in the sewing line has to be drawn up increase the efficiency and quality of production [15, 16]. Line balancing is very crucial in manufacturing sector especially in apparel manufacturing industries. The line needs to balance so that the line has the high value of efficiency. Higher value of line efficiency indicates that the line have the approximately equal cycle time between operators along the line. Besides that, the workload between operators also distributed equally which make the higher line efficiency and the target output can be achieved without having overtime. Therefore, organizations of similar type can use the research outcomes as a knowledge base to identify their problems and come up with suitable remedies. Findings of this research can be valuable and helpful to other similar apparel industries of Bangladesh, those who expect for better production efficiency through effective use of man, machines, materials and other resources.
ACKNOWLEDGEMENTS
- We thankfully acknowledge the authority and few personnel of the knit composite industry who generously cooperated and helped to carry out this study successfully.
References
| [1] | A. Neely, (2005), “The Evolution of performance measurement research”, International journal of operations and production management, 25(12), 1264-1277. |
| [2] | P. Niknazar, (2009) “Application of integrated DEA-BSC model in strategic management”, 6th international conference of management. |
| [3] | D.P. Norton, (1999), “Use Strategy Maps to Communicate Your Strategy”, Harvard Business Review, 1(2), November-December. |
| [4] | J. Heizer, and B. Render, (2000), Principles of Operations Management 4th Edition. Pearson College Div. ISBN-10: 0130271470, 336-420. |
| [5] | M.M. Islam, A. M. Khan and M. M. Islam. (2013), “Textiles Industries in Bangladesh and Challenges of Growth”, Research Journal of Management Science, 2(6), 1-7. |
| [6] | G. E. Kunz, G. E. Ruth (2012). Apparel manufacturing sewn product analysis, 4th Edition. Pearson publication. ISBN 978-81-7758-076-1. |
| [7] | C. Harold, L. Barbara (1996). The technology of clothing manufacture. 2nd Edition. Blackwell Science. ISBN 0-632-03748-2. |
| [8] | M.R. H. Shumon, K. A. Zaman and A. Rahman. “Productivity Improvement through Line Balancing in Apparel Industries.” Proceedings of the 2010 International Conference on Industrial Engineering and Operations Management. Dhaka, Bangladesh, January 9 – 10, 2010. |
| [9] | M. M. Islam, A. M. Khan and M. M. Islam, (2013), “Application of Lean Manufacturing to Higher Productivity in the Apparel Industry in Bangladesh”, International Journal of Scientific & Engineering Research, 4(2), 1-10. |
| [10] | S. K. Bahadır, “Assembly line balancing in garment production by simulation.” Retrieved from https//www.onlineclothing study.com (2014). |
| [11] | S. Bala, “Factors influencing costing of woven fabrics.” The Indian Textile Journal, June, 2003. |
| [12] | D. P. Khanna, (2005) “Work study, time and motion study”, Dhanpat Rai and sons, New Delhi (PP. 21). |
| [13] | D.J. Taylor, “Materials Management In Clothing Production”, BSP Professionals Books Press, London, 1991. |
| [14] | S. Jannat, M. M. Hoque, N. Sultana, I. J. Chowdhury, “Time study of A Furniture industry: A case study at navana furniture industry”. Preceeding of the International Conference on Mechanical Engineering 2009 (ICME 2009) 26-28 December 2009, Dhaka, Bangladesh. |
| [15] | G. Cooklin, (1991), Introduction to Clothing Manufacturing, Blackwell Science, Oxford, 104. |
| [16] | A.J. Chuter, (1988), Introduction to Clothing Production Management, Blackwell Science, Oxford, 60-63. |