Giwa A.1, Isa M. T.2, Idris U. A.1
1Department of Textile Science and Technology, Ahmadu Bello University, Zaria, Nigeria
2Department of Chemical Engineering, Ahmadu Bello University, Zaria, Nigeria
Correspondence to: Giwa A., Department of Textile Science and Technology, Ahmadu Bello University, Zaria, Nigeria.
| Email: |  |
Copyright © 2012 Scientific & Academic Publishing. All Rights Reserved.
Abstract
In textile production technology, one of the objectives of the manufacturer is to produce high quality fabrics or garment which will satisfy the customers’ need both in serviceability and in price. In this study, a comparative study was made on the properties of Nylon 6.6, Nylon 6, Kevlar 49, and E-glass fabric. This comparison was based on properties such as yarn count, yarn crimp, fabric sett, fabric thickness, abrasion resistance, crease recovery/resistance, fabric shrinkage and fabric flammability. It is evident from the result obtained that these fabrics posses unique properties which result from the type of fiber used, with a character of their own that can be optimized for suitable end-use. The fabrics have value for their end-use performance, strength and protective characteristics. This study reveals that the performance of any textile material is dependent upon a combination of inherent fiber properties, as well as the geometrical arrangement of fiber in yarns and fabric.
Keywords:
Synthetic Fabrics, Physical Properties, Mechanical Properties, Statistical Analysis
Cite this paper: Giwa A., Isa M. T., Idris U. A., Analysis of Some Physical and Mechanical Properties of Selected Fabrics, International Journal of Textile Science, Vol. 2 No. 3, 2013, pp. 49-58. doi: 10.5923/j.textile.20130203.02.
1. Introduction
The technology of textile manufacturing, the improvement of assortment and quality as well as automation of production process, the need for sensitive fiber and fabric for industrial and engineering application and the method for the measurement of structural indices and properties are related to the study of synthetic and mineral textile materials[1]Different researchers such as[2-6] have studied the mechanical behavior of some textile materials. The study of materials involves the inspection of the structure and properties, and their inter-relations that makes it possible to control production and inspect the quality and performance of textile material and to regulate their consumption[7]. Generally, textile fiber and fabric possess an exceptional combination of properties covering the flow of heat, abrasion resistance, tensile strength, shrinkage, etc., all these are amongst the properties that determine the quality of fabric. These qualities depend largely on the kind of fiber used and the manufacturing processes. A fabric is valued not only for its appearance but also for its serviceability and end use performances[8]. In composite materials manufacture fibers are now being combined to improve on the mechanical properties, especially stiff and flexible fibers in a matrix. Therefore, there is need to characterize some flexible conventional fibers like nylon with other technical fibers to determine their applicability in hybridization in composite material manufacture or production. The aim of this research is to study the properties of some selected fully synthetic fabric – Nylon 6, Nylon 6.6, Kevlar 49 and mineral fiber (E-glass) so as to analyze the influence of fiber type and yarn on the fabric.
1.1. Nylon 6.6 and Nylon 6
Nylon, being a man-made fiber, is produced by extrusion method. The final structure of this fiber, which determines its textile properties, is as a result of several technological operations during production. These include spinning, drawing, antistatic treatment, embracing, molding, nylonising and water repellency, and heat treatment. The nylon structure gotten from the spinning alone is very important for the ultimate structure. It has excellent strength and ability to withstand abrasion. The resultant fibers are usually white in colour with little dullness, smooth and rod-like in appearance. While they are fair heat conductors, nylon can be crimped so as to add bulk and insulation to fabrics. Nylon has excellent resilience and inherent stiffness which resist bending and cause rapid recovery from bending. This quality contributes to the usual resilience of the fabric. Nylon does not absorb much moisture, this thus encourages development of static electricity, and due to the nature of its little moisture absorbency, contributes to less easy stain and less swelling in water and quick dryness. As regards their cleanliness and washing ability, they may be easily cleaned or laundered with soap or detergent because they don’t get easily dirty. Most stain washes out easily but it attracts dye; white nylon should be separated from coloured material during laundry. When Nylon is heat set and made into garment they hardly loose their shapes and shed crease quickly after washing. Nylon fabrics are sold with different trade names by different manufacturers, for example, Celon (Courtaulds), Antron (Dupont), Enkalon (British Enkalon).
1.2. Glass Fiber
There are two major methods of producing glass fiber yarns. Both begin with accurate batch formulation of selected silica, sand, limestone, soda ash and borax or other ingredient, depending on the ultimate purpose of the fiber. From pricely controlled furnace, the molten glass at a temperature of about 2500°F (1370°C) flows to a marble forming machine and from there pressed into filament form with binder application and with the high speed winder, the filaments are gathered into yarns and wound into tubes. Also, various operations during production of the fiber determine its textile properties e.g. volatilization, coronizing, texturization. The resultant fibers are produced in a wide range of fiber diameter. The fineness of the fiber contributes to its flexibility. Glass fiber is second only to Kevlar and Aramid as the strongest of all textiles. Glass fiber lack elasticity, but this has no effect on its flexibility and wrinkle resistance of glass fiber fabric. Glass fiber-fabric is dimensionally stable, it will not shrink and it is unaffected by water. Glass fiber is highly resistant to heat and will not burn.
1.3. Kevlar
Kevlar belongs to the class of aramid fiber manufactured mainly by Dupont. Like other synthetic fiber, during its manufacturing process, the long chain polymer is extruded through spinnerets as aromatic polyamide filament. Kevlar fibers are nearly one-fifth in density compared to steel but nearly equal to steel in tensile strength. Kevlar has a Tg of above 300°C and a melting point of 500°C. Due to its industrial and consumer use, the salient features are considered with reference to the fiber application. It has 50% more stretch resistance and greater flexibility, it has better fatigue resistance than polyester, but less than that of nylon 6.6. It has excellent dimensional change in weather and moisture condition and a high resistance to high temperature(s).
2. Methodology
2.1. Yarn Count
The count of the warp and weft yarns was determined in accordance with [9]. Length of yarns was taken and weighed. The yarn count was evaluated using the formular below (Equation 1 and 2).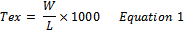 | (1) |
 | (2) |
Where W = weight of yarn in grams; L = Length in meters
2.2. Yarn Crimp
The conditioned fabric samples were laid flat, free from tension and crease. A rectangular strip of 21.4cm x 16cm was marked out and cut along the warp and weft direction and yarn sample were carefully removed using a dissection needle from warp and weft. One end of the thread was inserted into one grip of the apparatus (severely crimp tester) and closed so as to be able to withdraw the thread under the right tension. Ten different readings were taken from each sample, the mean calculated and the percentage crimp calculated (Equation 3).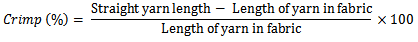 | (3) |
2.3. Fabric Sett
The experiment was conducted in accordance with the method described in[9]. The fabric was laid flat on a horizontal surface and the glass was placed on it in such a way that the edge of its aperture was parallel to the warp yarns. Then the numbers of warp yarns per centimeter (epcm) were counted. This was repeated for the weft by placing one of the edge of the aperture parallel to the weft yarns, the number of weft yarn per centimeter (ppcm) was then counted at different portions of the fabric. The mean value was then obtained.
2.4. Fabric Thickness
The thickness of all sample were determined in accordance with the procedure in[9] using Essdiel (Thickness Gauge). The test specimen areas were selected randomly to represent the sample; the surface of the device was cleaned, after which the instruments were adjusted to provide the pressure prescribed by the material specification and gauge to read zero. The plates were separated and the increased part of the specimen was placed in contact with the angle without tension. The reading of the gauge after a length of time was observed and the fabric thickness was recorded. The pressure used was 1.96 x 10⁻¹ N/mm2. This was repeated several times. The mean pressure was also determined.
2.5. Abrasion Resistance
The test was conducted in accordance with the procedure in[9] using the Martin Dale Wear Abrasion Tester. The machine was set at 500 rubs. The weight of specimen was determined before and after abrasion. The time taken for the fabric to abrade was recorded. The mean and percentage loss was calculated for each fabric sample for 500 rubs.
2.6. Crease Resistance
According to[9], five rectangular strips of 5 x 2.5cm were cut from the specimen for both warp and weft. The degree of crease recovery was determined using a Shirley Crease Recovery Tester. The mean crease recovery angle for each specimen was determined i.e. angle formed under prescribed condition at a specified time (1min) after the removal of creasing load.
2.7. Fabric Shrinkage
A conditional sample of 10cm x 10cm was marked out of each selected fabric. The samples were immersed in and above 10cm square and 2cm deep containing boiling water. The specimen was submerged for 2hours and was carefully removed and laid on a glass and dabbed with an absorbent cloth, so as to remove excess water. It was then allowed to dry naturally. After drying, the dimension was re-measured and the percentage was calculated using the following formulae (Equation 4). | (4) |
2.8. Fabric Flammability
Based on the procedure in[9], a specimen of 4cm x 1cm dimension was suspended on a wire by clips. The flame from a candle stick was put at one inch just before the lower end of each of the specimen. The time taken to consume the specimen from its lower end to the top end was recorded with the aid of a stop watch.
2.9. Statistical Analysis
Descriptive statistical analysis was used as well as qualitative data for comparing test results.A one-way Analysis of Variance (ANOVA) was used to compare the parameters measured of the respective samples. An alpha level of 0.05 was used for the statistical test. Statistical analysis of the result was performed using the Statistical Package for Social Sciences (SPSS 16) software package.Certainly, the most often used descriptive statistic is the mean[10]. The mean is a particularly informative measure of the "central tendency" of the variable if it is reported along with its confidence intervals. As mentioned earlier, we are usually interested in statistics (such as the mean) from our sample only to the extent to which they can infer information about the population. The confidence intervals for the mean give us a range of values around the mean where we expect the "true" (population) mean to be located (with a given level of certainty)[10].
3. Results and Discussion
3.1. Yarn Count
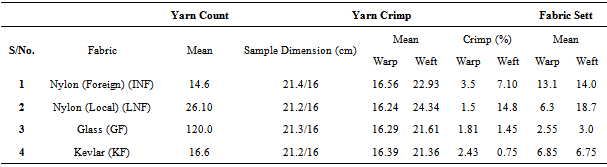
The fineness or coarseness of yarn is described in terms of their weight per unit length. This is referred to as yarn count. It is one of the factors that determine the fabric quality. It also determines the general behavior of the fabric from the yarn[11]. Yarn count is also referred to as the linear density.1. Kevlar (KF): Length of yarn = 21.6cm x 5 yarn = 108cm = 10.8m, Total weight of yarn in grams = 0.18g, from the formula, W/L x 1000 = tex2. Glass Fabric (GF): Length of yarn = 21.3cm x 5 yarn = 106 cm = 10.65cm, Total weight in grams = 1.28g3. Imported Nylon Fabric (INF): Length yarn = 21. 8cm x 5 yarn = 109 cm = 10.9m, total weight of yarn in gram = 0.16g4. Local Nylon Fabric (LNF): Length of yarn = 21.4cm x 5 yarn = 107cm = 10.7m, total weight in gram = 0.28gThe area density of a fabric is a very important parameter as it gives an indication of the amount of materials it contains. It also relates to the fitness of the material in terms of use and comfortability[11]. From Table 1, INF showed the least count and GF showed the highest count followed by LNF and then KF.Table 1. Mean values of Yarn count, Yarn crimp and Fabric sett
 |
| |
|
3.2. Yarn Crimp
Crimp of a fiber or yarn can be defined as the undulating or waviness of either the fiber or yarn[12]. Since a woven fabric is composed of interlaced warp and weft yarns, each warp or weft yarn (or both) must assume a wavy path as it goes under or over a yarn in order to be accommodated within the fabric structure. The waviness is called yarn crimp. Crimp is an important characteristic and a feature of woven fabrics which is the principal feature governing the bulking power of a textile material and generally, the specific volume of yarns and fabrics[12]. Fabric tensioning in either the warp or weft direction tends to remove the crimp and straighten the tension set of yarns.It is observed from Table 1 that the weft crimp is generally higher than those of the warp as expected. This is due to the fact that the warp yarn was under greater tension during weaving process on the loom as compared to the weft yarn. So also the weft yarns are more flexible relative to the stiffer yarns which may be crated with size so as to withstand tension and frictional effect of the healds during weaving action. The crimp of samples increases in the following order INF > LNF > GF > KF.
3.3. Fabric Sett
This is the number of yarns per centimeter in a fabric. Sett is also one of the factors that determine the quality of woven fabrics. Usually, the higher the fabric sett, the better the durability and stability of the fabric[12]. Fabric sett is expressed in picks per centimeter (ppcm) and ends per centimeter (epcm). Picks per centimeter is the number of fillings per centimeter while ends per centimeter is the number of warp yarns per centimeter.The fabric density has a direct influence on the cover factor and may be dependent to a certain extent on the yarn count[12]. It may also be related to the fabric handle and appearance in terms of fabric thickness. Table 1 shows that the fabric sett decreases in the following order GF < KF < INF < LNF. This was attributed to the beat-up force of the weaving machine.
3.4. Fabric Thickness
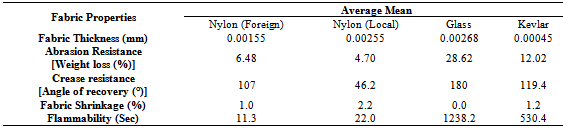
Fabric thickness is important in the study of other fabric characteristics such as thermal insulation, fabric abrasion resistance and fabric stiffness. Fabric thickness is usually regarded as being independent of the number of threads per unit length, but dependent on the degree of crimp interchange between different groups of warp and weft threads and the yarn diameter or bulk densities of the yarn[13].The thickness of a fabric depends on the mass/unit area, fabric (sett) density and the nature (count) of yarn used. Various properties such as abrasion resistance, dimensional stability stiffness and thermal insulation are affected by the fabric thickness. It may be observed from Table 2 that though GF has the highest fabric thickness, while the LNF is thicker than INF.
3.5. Abrasion Resistance
Fabric abrasion has been defined as simple rubbing action. It is the ability of fabrics to resist destruction due to abrasion. Fibers in use are subjected to a variety of different forces, which are repeated many times until finally the fibers wear out. It is also a series of repeated stress application usually caused by forces of relatively low order or magnitude, which occur many times during the life span of the material. The life of a fabric is very dependent on its resistance to abrasion. Fabrics are abraded in use against various materials (fabric against fabric under the arm) under various pressure (the seat of a pair of slacks), under dry and wet conditions (a wet rain coat of fabric in the washing machine), the list is endless.The abrasion resistance of a fabric is very much influenced not only by the choice of fibre but also the construction of the yarn and fabric. Abrasion may be classified as Flat/plane abrasion which occurs when a flat area of the material is abraded, Edge abrasion which is the kind that occurs at collars and folds, while Flex abrasion is the rubbing accompanied by flexing and bending. The tearing strength of the fabric is important in fabric abrasion.Abrasion resistance is a parameter which is related to rubbing action, which affects the durability, and also its performance characteristics. The assessment of abrasion of fabrics, usually provide the fabric with condition for those it will be subjected to, while in use. The result obtained in this work is very remarkable as it indicates that the nylon fabrics i.e INF and LNF exhibit similar Abrasion resistance which is expected under the same condition of usage. The ratings of the materials in terms of Abrasion resistance is GF > KF > INF > LNF.
3.6. Crease Resistance/Recovery
Those material which recovered best from creasing in both warp and weft directions, have good easy care properties and do not require much ironing before use. Table 2 shows that GF have better crease recovery properties followed by KF and INF and finally LNF.
3.7. Fabric Shrinkage
The percentage shrinkage of fabric is an indication of its dimensional stability. Table 2 indicates that LNF and KF had the highest percentage shrinkage in both warp and weft directions. While sample GF have zero percentage shrinkage and is said to be the most dimensionally stable.
3.8. Fabric Flammability
Flame resistance of a fabric depends on the chemical composition of fabrics and yarns, weight of fabrics and finishing. A flame-proof fabric is one which is self extinguishing, while a flammable one is that which is supportive to or propagates flame. For fabrics which propagate flame, flame resistance is related to their weight as well as fiber content. For any given fiber, the heavier the fabric, the higher the flame resistance.The test result shows that INF and LNF are flammable, while KF is flame retardant and GF is not flammable or flame-proof. The flammability is both dependent on the type of fibre used as well as, the extent of the flame retardant finishing imparted on the fabric.
3.9. Statistical Analysis
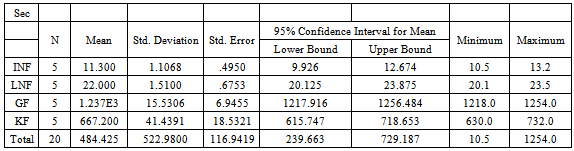
3.9.1. Descriptive Box
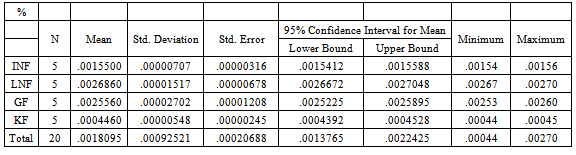
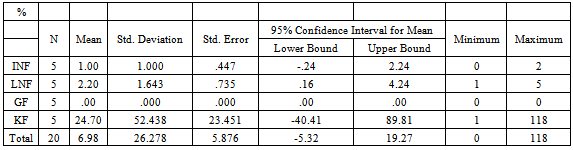
Table 3 a-c show the Fabric Thickness SPSS output illustrative data; we can see each condition name (samples) on the left hand side of the column. Hence we are able to determine the number of samples, the mean and standard deviation for each sample by reading across each of the 12 condition rows. Also obvious from the table are things like the minimum and maximum value in each condition, as well as confidence intervals and standard error.Table 2. Mean values of Fabric thickness, Abrasion resistance, Crease resistance, Fabric shrinkage and Fabric flammability
 |
| |
|
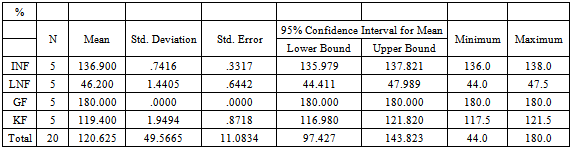
Table 3a. Descriptive statistics table for fabric thickness
 |
| |
|
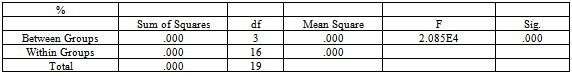
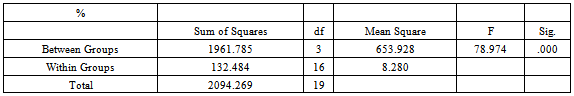
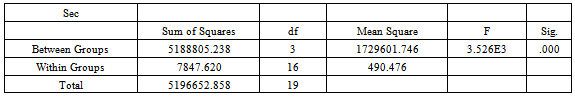
Table 3b. ANOVA table for fabric thickness
 |
| |
|
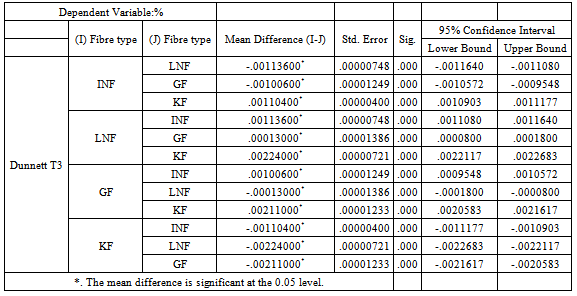
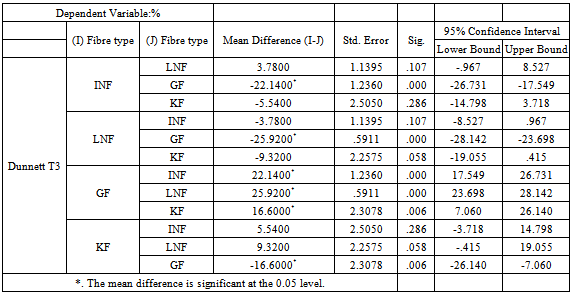
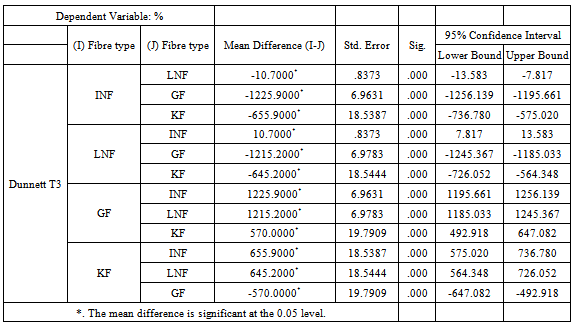
Table 3c. Post Hoc Test (Multiple comparisons) for fabric thickness
 |
| |
|
In this Descriptive Statistics box, the mean for the INF condition is 0.00155. The mean for the LNF is 0.002686, the mean for the GF is 0.002556 and the mean for the KF condition is 0.000446. The standard deviation for the INF condition is 0.00000707, the standard deviation for the LNF condition is 0.00001517, the standard deviation for the GF condition is 0.00002702, and the standard deviation for the KF condition is 0.00000548. The number of samples in each condition (N) is 5. However, we need ANOVA to determine if all the mean are statistically different.
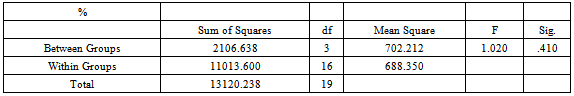
3.9.2. ANOVA Box
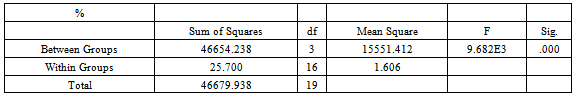
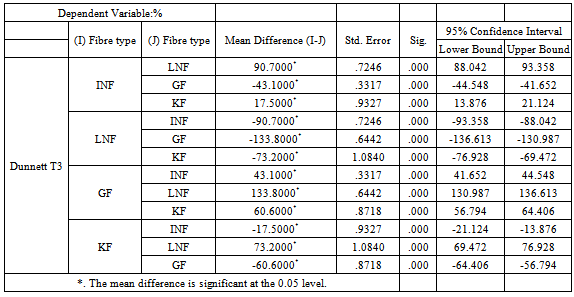
The ANOVA shows the results of the 1-Way Between Subjects ANOVA that we have conducted. The Sig. value in the last column helped us to determine if all our sample mean were relatively the same or if they were significantly different from one another. Put differently, this value has helped us to determine if the fabric thickness had an effect. In this example, the Sig. value is 0.000. If the Sig. value is greater than 0.05, we can conclude that there is no statistically significant difference between our four samples. We can conclude that the differences between condition Means are likely due to chance and not likely due to the fabric thickness. However, if the Sig. value is less than or equal to 0.05, we can conclude that there is a statistically significant difference between our four samples. We can conclude that the differences between condition Means are not likely due to chance and are probably due to the fabric thickness. Therefore, the Sig. value of our test is 0.000. This value is less than 0.05. Because of this, we can conclude that there is a statistically significant difference between the mean numbers of our samples. Conversely, the Sig. value does not tell us which sample means are different. It could be that only the INF sample is significantly different than the LNF sample. It could be that only the GF sample is significantly different than the KF. It could be that all the samples are significantly different from one another. The Sig. value can tell us that there is a significant difference between some of the samples. It just cannot tell us which ones. Researchers have solved this problem by conducting Post Hoc Tests. These tests are used when we have found statistical significance between conditions but when we don’t know where the significant differences are. These tests are not used when the results of a 1-Way Between Subjects ANOVA are not significant because there is no need. But when we do find a statistically significant result, when the Sig. value is less than 0.05, we need to use these tests. The Dunnett’s T3 test is popular so we will focus on that one. If we find a significant result with a 1-Way Between Subjects ANOVA, and if our fabric thickness has 3 or 4 levels, we would need to use the results of a post hoc test like the Dunnett’s T3 test to compare. Because of the fact that we found a statistically significant result in our Fabric Thickness analysis, we would want to look at the results of a post hoc test like Dunnett’s T3. This will help us find out which of our samples were significantly different from each other. We conduct post hoc tests like the Dunnett’s T3 to compare each of the following samples:
3.9.3. Multiple Comparisons Box
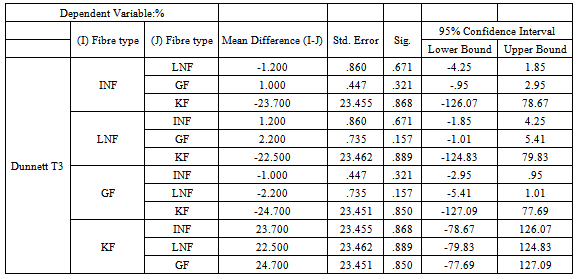
In the first column of this box, we have the sample names. The sample names appear in 12 rows. These rows show the comparisons of various samples. On the left side of every other row, we have a single sample name. On the right side of each row, we also have a sample name. The statistics that we present in the columns to the right of the first column showed the comparison between the sample name on the left and each of the sample names on the right. Here, the sample name INF appears in the first column on the left side of the top row. The sample name LNF appears to the right of it. If we read across this particular row, we would see the statistics that compare INF and LNF samples. We can also see the sample GF in the first column on the right hand side of the second row. If we read across this particular row, we see statistics that compare INF and GF samples.Taking a look at the Sig value when reading across each row, it shows whether the two conditions that are being compared are significantly different. If the conditions are significantly different, the Mean Difference value in the corresponding row will also contain an asterisk (*). However, there is more than one way to determine significance when using this type of post hoc test. If the Sig. value is greater than 0.05, we can conclude that there is no statistically significant difference between the samples that are being compared. We can conclude that the differences between sample Means are likely due to chance and not likely due to the fabric thickness manipulation. Conversely, if the Sig value is less than or equal to 0.05, we can conclude that there is a statistically significant difference between the samples being compared. We can conclude that the differences between sample Means are not likely due to chance and are probably due to the fabric thickness manipulation. Looking at the Sig. column in our Table, it shows that all the values are less than 0.05. For this reason, we can therefore conclude that the samples are significantly different in terms of Fabric Thickness.By and large, the above explanations suffice for Tables 4 – 7 accordingly.Table 4a. Descriptive statistics table for abrasion resistance
 |
| |
|
Table 4b. ANOVA table for abrasion resistance
 |
| |
|
Table 4c. Post Hoc Test (Multiple comparisons) for Abrasion resistance
 |
| |
|
Table 5a. Descriptive statistics table for crease recovery
 |
| |
|
Table 5b. ANOVA table for crease recovery
 |
| |
|
Table 5c. Post Hoc Test (Multiple comparisons) for crease recovery
 |
| |
|
Table 6a. Descriptive statistics table for fabric shrinkage
 |
| |
|
Table 6b. ANOVA table for fabric shrinkage
 |
| |
|
Table 6c. Post Hoc Test (Multiple comparisons) for fabric shrinkage
 |
| |
|
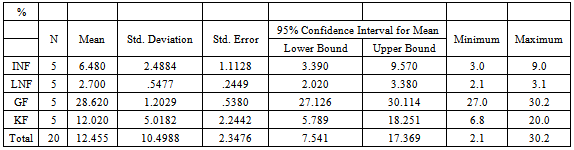
Table 7a. Descriptive statistics table for fabric flammability
 |
| |
|
Table 7b. ANOVA table for fabric flammability
 |
| |
|
Table 7c. Post Hoc Test (Multiple comparisons) for fabric flammability
 |
| |
|
4. Conclusions
This study has been carried out to show comparison between the properties of Nylon (foreign and locally made fabrics), Kevlar and Glass fabrics. The glass fabric is better in terms of fabric shrinkage, flammability and yarn count. While for the nylon fabrics, the locally made Nylon is better than the imported nylon in terms of abrasion resistance and yarn count. The Kevlar fabric is also better than the Nylon fabric in terms of crease recovery and flammability. These properties which determine the end use performance of the fabrics under study are not independent, they influence one another. The result obtained for the properties, determine how functional the fabrics may be when disposed to various end use.
References
| [1] | Hassan B. A. (2003). Effect of Mechanical and Physical Properties on Fabric Hand. Wood Head Publishing Limited, New York, pp 447 – 447. |
| [2] | Bassett R. J (1999). Experimental Methods for Measuring Fabric Mechanical Properties", Textile Research Journal, Vol 69, No 11, pp 866-875. |
| [3] | Kawabata Sueo, Niwa Masako, (1998) "Clothing engineering based on objective measurement technology", International Journal of Clothing Science and Technology, Vol. 10 No: 3/4, pp.263 – 272 |
| [4] | Kawabata, S. and Masako Niwa, (1991) "Objective Measurement of Fabric Mechanical Property and Quality: Its Application to Textile and Clothing Manufacturing", International Journal of Clothing Science and Technology, Vol. 3 No: 1, pp.7 – 18 |
| [5] | Postle, R. (1990) "Fabric Objective Measurement Technology: Present Status and Future Potential", International Journal of Clothing Science and Technology, Vol. 2 No: 3, pp.7 – 17 |
| [6] | Ukponmwan J. O. (1988). Correlation Between Objective and Subjective Methods of Assessing Fabric Handle, Journal of Textile Institute, No 4, 1988, pp 580-587. |
| [7] | Kawabata S. (1989). Fabric Performance in Clothing and Clothing Manufacture, Journal Of Textile Institute, Vol 80, No 1, pp 19-50 |
| [8] | Chen, Y., and Collier, B. J, (1997). Characterising Fabric End Use by Fabric Physical Properties, Textile Research Journal, Vol 67, No 4, pp 247-252. |
| [9] | BS (1979). Methods of Test for Textiles (British Standard Handbook No. 11). British Standards Institution. Revised Edition. |
| [10] | StatSoft (2012): StatSoft Electronic Statistics Textbook. Retrieved fromhttp://www.statsoft.com/textbook/basic-statistics/?button=1 Date: 23rd March, 2012 |
| [11] | Gong R.H. and Mukhopadhyay S.K. (1993). Fabric Objective Measurement: A Comparative Study of Fabric Characteristics, Journal of Textile Institute, Vol 84, No 2, pp 192-198. |
| [12] | Newton, A. (1995). The Comparison of Woven Fabrics by Reference to Their Tightness. The Journal of the Textile Institute Vol. 86 pp. 232 – 240. |
| [13] | Roshan L. S. (1995). Importance of Mechanical and Physical Properties of Fabrics in the Clothing Manufacturing Process. International Journal of Clothing Science and Technology, Vol 7, No 2/ 3, pp 35-42. |
 Abstract
 Reference
 Full-Text PDF
 Full-text HTML