Bilal Zahid1, 2, Xiaogang Chen2
1Textile Engineering Department, NED University of Engineering and Technology,Karachi,75270, Pakistan
2Textiles and Paper, The University of Manchester, Manchester, M139PL, United Kingdom
Correspondence to: Bilal Zahid, Textile Engineering Department, NED University of Engineering and Technology,Karachi,75270, Pakistan.
| Email: |  |
Copyright © 2012 Scientific & Academic Publishing. All Rights Reserved.
Abstract
This paper is a part of research carried out for the manufacturing and evaluation of riot police helmet having continuous textile reinforcement. Successful technique was developed for the manufacturing on single-piece continuously textile reinforced riot helmet shells. In order to fulfil the objective of in-house impact testing on the developed continuously textile reinforced helmets,a helmet test rig was made. The University of Manchester’s drop weight impact testing instrument was used and successfully modified for helmet testing.The importance of the developed test rig was the sufficient abilities to carry out impact testing at different impact position at the helmet shell, force blocking effectiveness at different locations can be calculated and the behaviour of the transmitted force at different impact locations can be understood. Furthermore, energy absorption at different impact location can also be studied.
Keywords:
Helmet, Continuous Textile Reinforcement, Impact Testing, Test Rig, Drop Weight Impact Testing Instrument
Cite this paper: Bilal Zahid, Xiaogang Chen, Development of a Helmet Test Rig for Continuously Textile Reinforced Riot Helmets, International Journal of Textile Science, Vol. 2 No. 1, 2013, pp. 12-20. doi: 10.5923/j.textile.20130201.03.
1. Research Background
This research was a part of research carried out for the manufacturing and evaluation of the continuously textile reinforced helmet shells. A special 5-layer angle interlock fabric was made and single-piece textile reinforced helmet shells were successfully developed using modified vacuum bagging[1]. Moreover, physical and mechanical properties of the developed 5-layer angle interlock fabric has been calculated and analysed[2]. One of the research aims was to do impact testing of the developed helmet shells. For this purpose, it was decided to use the in-house University of Manchester’s Dynatup drop weight impact testing instrument. The basic idea was to calculate the Impact energy absorbed by the helmet shells and the force attenuation factor. This paper explains different steps carried out for the manufacturing of a test rig used for impact testing.
2. Literature Review
2.1. The Drop Weight Impact
Impact testing on composite structures can be carried out in number of ways as discussed by Abrate[3], but the major three categories are: Gas gun, Drop weight and Pendulum. In this research as discussed that Drop weight method was chosen due to the instrument availability. In drop weight testers, a large mass impactor is guided by rails in a free fall motion from a given height. Sensors can detect the velocity and load at the time of impact. Impact energy and velocity are calculated from the following equations. | (1) |
 | (2) |
In the drop weight system the potential energy of the system is converted into kinetic energy during an impact onto the specimen. Friction in the mechanism is supposed to be zero due to the free fall motion of the impactor.
2.2. Instron Dynatup 8200 Drop Weight Tester - Impact Testing Instrument
The Instron Dynatup 8200 drop weight impact tester is capable of testing materials at a velocity of up to 4.4 m/sec with a maximum drop height of maximum 1.2 metres. Figure1shows the sketch of the Instron Dynatup 8200 impact tester[4].The main assemblies of 8200 drop weight impact testing instruments have been described as follows[4].
2.2.1. The Drop Weight Assembly
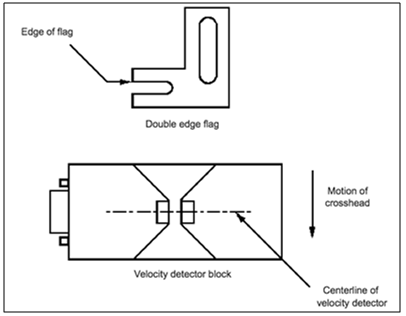
The drop weight assembly is the core of the Dynatup impact instrument. This assembly consists of three parts, which are the drop weight, tup and flag bracket. Brief descriptions of the machine used are as follows.The drop weight consists of the mass for the impact testing. The drop weight assembly is a framework of weights and plates bolted together. The empty mass of the drop weight is approximately 3 kg. The drop weight has an ability to hold more mass; ten extra weights, each weighing approximately 1.1 kg, to give a total test mass of 13.6 kg. These ten weights can be stacked within the drop weight and are retained by a threaded rod and securing hand-knob. Cover plates bolt onto the front and back of the drop weight frame to retain the weights.The impact force applied on the specimen is measured by the tup of the drop weight assembly. It consists of two parts, the tup: which is a load cell for measuring force, and the tup inserts or impact head which is the impactor that actually strikes the specimen. In the current study a flat rigid impactor made from Tecamid 66 was used as the tup insert[5] which is abrasion resistant, tough and rigid material.The velocity flag, a double pronged stainless steel piece, is a part of a velocity measuring system and is located at the right hand side of the drop weight. During the free fall of the drop weight assembly the velocity flag passes through the velocity detector and the velocity just before the impact is determined. Figure 2 shows the schematic diagram of velocity detector and flag. 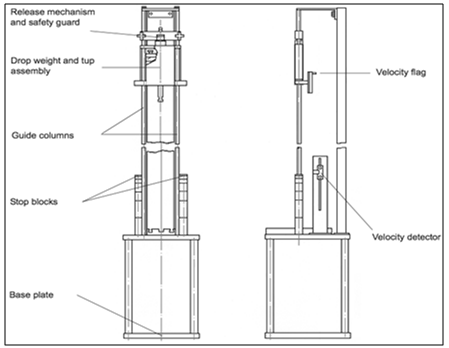 | Figure 1. Sketch of the Instron Dynatup 8200 impact tester |
 | Figure 2. Velocity detector and flag |
2.2.2. The Drop Weight Release Mechanism
A mechanical lever (release latch) is provided to manually release the drop weight assembly from a pre-selected drop position. The position, based on the required impact energy, can be adjusted by moving the clamp frame up and down and clamping it to the guide columns using the clamp knobs. The velocity of the drop weight can be adjusted from the drop height by using the Equation (2).
2.2.3. The Drop Tower Framework
The impactor was dropped precisely onto the specimen with the help of a guiding mechanism. This guiding mechanism consists of two vertical bars (columns), base plate, back and top weldment (support) and table. The drop weight assembly drops free fall on the guide columns via holes in its upper and lower guide blocks. The two guide columns bolted to the base plate and the top weldment. The back weldment provides rigidity and vertical stability to the drop tower.
2.2.4. The Anvils
Anvils are fixtures that hold specimens during testing. Different styles of anvil are available to accommodate various test specifications and techniques[4]. The drop weight mechanism also depends on several factors for instance impactor mass, impactor shape, height of the drop weight and also the boundary conditions holding the specimen to be tested.
3. Location of Impact at Helmet
In order to develop a test rig for helmet testing, the impact location on the helmets is one of the important factors for designing a helmet testing assembly. For this purpose the US NIJ standard[6], the Police Scientific Development Branch’s (PSDB) Protective Headwear Standard for UK Police (2004)[7] and the CAN/CSA-Z611-02[8]were reviewed.It was planned that the impact testing would be conducted at least on three locations on the helmet i.e. the side, back and top locations. The testing assembly has been planned to be constructed in the way so that it should have the option to do impact testing at the side, back and top of the developed continuous textile reinforced helmet.
4. Requirementsof Helmet Test Rig
The impact testing instrument at the University of Manchester can be seen in Figure 3. This instrument is used for low velocity and low energy impact testing. There was no anvil available to hold the helmets on the drop weight impact instrument as can be viewed in Figure 3. Moreover, there was a need to determine the transmitted force underneath the helmet (or at the top of the anvil). For that purpose force sensors had to be implanted. In other words, a test rig was required which could be used as an anvil in the drop weight impact testing instrument.In order to develop the test rig for helmet testing, there was ample space available at the bottom portion of the Instron Dynatup 8200 drop weight impact tester as can be seen in Figure 3. Utilisation of this bottom portion (having dimensions of 38 cm wide, 43 cm deep and 51 cm height) as the working space was aimed for the helmet holding assembly. 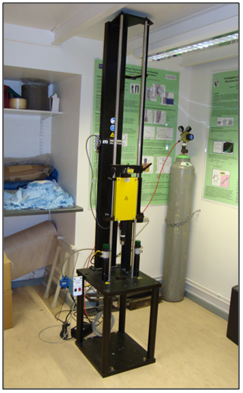 | Figure 3. Dynatup 8200 drop weight impact testing instrument |
The test rig for the helmet testing should have certain requirements.● Firstly, there was a need of a headform for holding the helmet during an impact. ● Secondly, helmet should be held firmly during the impact, so there was a need to develop a headform holding assembly. ● Thirdly, impact testing has to be carried out on the back, top and side of the helmet. So, there was a need to develop a mechanism by which helmet could be rotated with the headform without resetting the whole setup. ● Lastly, the Instron Dynatup 8200 drop weight impact tester can give the impact data from the top of the specimen. In order to find the force transmitted through the helmet, a force sensor was required for the evaluation of force blocking effectiveness.
5. Development of Test Rig
Based on the requirements discussed above, the test rig was manufactured in three steps namely:1. manufacturing of headform;2. manufacturing of headform holding assembly and assembly foundation;3. installation of force sensors at the headform.
5.1. Headform Manufacturing
In order to hold the helmet, there was a need for a headform which could serve the purpose of helmet a holding. An ideal headform is the one which should be able to stay firm at low velocity impacts and also force sensors can be mounted on the headform for measuring the transmitted force. In this study, spherical headform coordinates with 525 mm circumference from the British headform standard ‘Headform for use in the testing of protective helmets’ (BS EN 960:2006)[9] was selected due since it seems suitable for the developed helmets. A polypropylene made headform which has a circumference of 525 mm was as a mould and casted from aluminium as shown in Figure 4. Headforms made of aluminium are commonly used by several authors[10-12]. 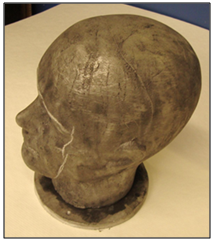 | Figure 4. Aluminium headform |
5.2. Headform Holding Assembly
There were three basic objectives while designing the helmet holding assembly. Firstly, impact testing has to be carried out on at least three sides of the helmet i.e. the top, side and back of helmet. Secondly, the whole helmet holding assembly should be able to rotate for different impact locations without resetting the whole setup. Thirdly, a force sensor should be installed on the headform at the exact position of impact.Based on the requirement it was planned that the headform was drilled and steel rods were fixed in the drilled portions at the bottom (neck) and the front (face). The purpose of these steel rods was to hold the headform and can be rotated to the required impact location. The drilled headform with steel rods can be seen in Figure 5(a). The purpose of these steel rods was to hold the headform on a specially designed foundation which can be seen in Figure 5(b). In this way the headform along with helmet on it can be swing simply to the required direction without removing and resetting the whole helmet holding assembly. The helmet holding assembly foundation was bolted to the main base foundation of the Dynatup 8200 Impact testing instrument. The steel rods were bolted on to the upper part of the helmet holding assembly. Anti-vibration pads were also used in the bottom of the steel rod connecting to the foundation to reduce vibration caused by the reaction on the impact. 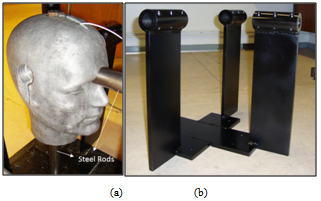 | Figure 5. (a) Headform holding rods (b) Foundation for helmet holding assembly |
5.3. Force Sensors and Mounting at Headform
The Dynatup 8200 impact testing instrument has the ability to provide the impact force, but in order to evaluate the force received underneath the helmet, a force sensor has to be installed at the headform.A Dytran ring type model series 1203V5 force sensor was selected due to its inbuilt form of thin ring with through hole and also having high compression range. This sensor is designed to measure dynamic forces in machines. The mounting of this type of sensor is fairly easy since it has a hole similar to a washer as shown in Figure 6[13].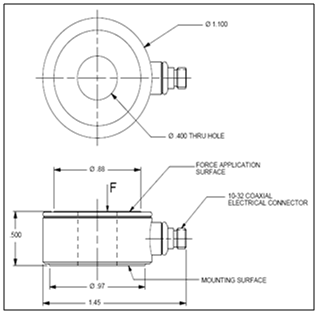 | Figure 6. Force sensor model series1203V5 |
The output signal of these sensors is a voltage mode signal scaled directly in millivolts per newton. The selected sensor has the sensitivity of 0.5 millivolts per newton (i.e. 1V = 8896.44 N). The headform was cut, drilled and tapped as per the sensor’s dimensions at the selected impact locations. The groove prepared for the sensor can be seen in Figure 7. The force sensor was held on the aluminium head by means of a steel bolt. 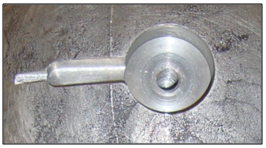 | Figure 7. Sensor’s groove on the headform |
The developed test rig can be viewed in Figure 8. 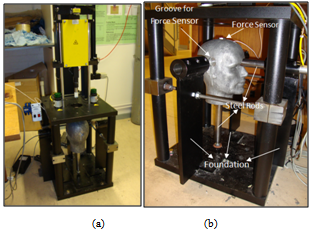 | Figure 8. Different views of the helmet test rig (a) front view (b) side view |
6. Development of Method for Data Collection and Data Processing
During an impact two separate systems were used simultaneously for data recording and processing.1. Impulse data acquisition system 2. Low impedance voltage mode system
6.1. Impulse Data Acquisition System
The Instron uses the Dynatup ImpulseTM data acquisition system which can collect and analyse the data both graphically and numerically[4, 14]. The impulse data acquisition systems (IDAS) with the Dynatup 8200 drop weight impact testing instrument have been used to record impact testing results.IDAS consists of the following[4]: ● impulse software;● national instrument data acquisition board;● signal conditioning unit;● cables;● velocity detector block;● velocity flags.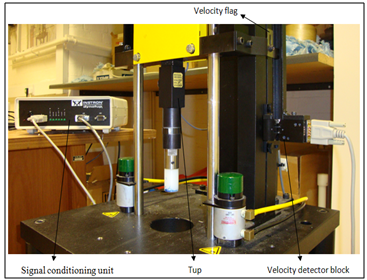 | Figure 9. Impulse data acquisition system |
The data acquisition system consists of hardware to amplify and capture the dynamic transducer output from an impact event and software to analyse, display, report and store these data[4]. This is a built-in system with the Dynatup 8200 impact testing instrument and Figure 9 shows the system composition. The load cell has a maximum range of 2224 N (5000lbs).
6.2. Low Impedance Voltage Mode System
A system has been developed for data collection at the headform. This low impedance voltage mode system (LIVMS) consists of the following[15]: ● Dytran force sensor;● coaxial cable;● the DC power source;● NI USB data acquisition device (DAQ);● Lab View signal express software.The force sensor model 1203v5 contains quartz crystals which after produces an output voltage exactly analogous to the dynamic force. This voltage mode signal is directly scaled in millivolts per newton. The schematic diagram of the setup from the manufacturer[13] is shown in Figure 10.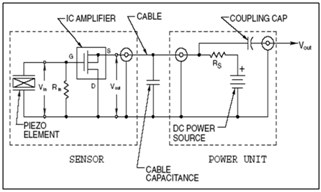 | Figure 10. LIVM sensor and power unit schematic diagram |
Lab View Signal Express software was used to collect and analyse data both graphically and numerically[16]. The manufactured system in the laboratory is shown in Figure 11. There was no option available for simultaneous triggering of both the software (IDAS and LIVMS), therefore LIVMS was turned ON before the impact and turned OFF after the impact. This is how the data were extracted from the LIMVS, whereas the IDAS processed the data automatically from the impulse software during an impact. 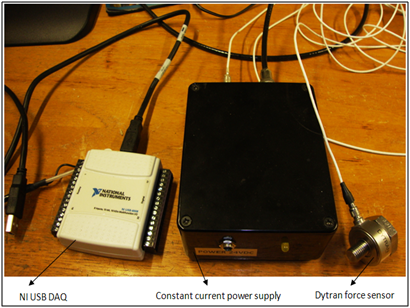 | Figure 11. Low impedance voltage mode system |
6.3. Calibration of the system
The IDAS and LIVMS were manually triggered and the separate data were extracted and exported to Microsoft Excel. Calibration of the two different systems was necessary. The easiest way to calibrate the two was to perform an impact on the anvil without any specimen and compare the forces detected by the two different systems. Ideally in an impact without any specimen, the peak impact force measured using IDAS should be equal to the transmitted peak force (reaction force) measured by LIVMS. Figure 12 shows an impact directly on the anvil without a specimen. The two curves follow the same path but the peaks do not match to a certain value. This seems to be due to the different responsivities of the two sensors and also due to the developed test rig setup as they are subjected to different impact conditions. The main purpose is to adjust the peak value. Several impact test results without specimen shows that test rig geometry has an influence on the magnitude of transmitted force (reaction force). Due to this method a little energy is absorbed by the test rig and causing less reaction force (transmitted force) in impact test without specimen. In order to overcome this problem, the reading of the transmitted force was corrected according to the reading of the impact force. Correcting factors have been introduced. In order to obtain the correcting factors at three different locations on the anvil (top, side and the back), a multiple series of impact tests (without a specimen) at three different impact energy levels (around 5J, 15J and 25J) were carried out, and the correcting factors were calculated accordingly. These impact energies were selected due to the responsivities of the IDAS system otherwise the peaks having greater than 25kN force will be limited of by the system. 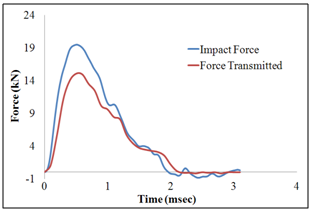 | Figure 12. Impact force and force transmitted curves at 25.6J impact (without specimen) |
7. Testing Procedure
The following procedure was established in the laboratory for impact testing.
7.1. Pre-Test Preparation
Few actions were necessary before conducting the test namely, adjusting the drop weight height, setting selection of drop weight mass, and velocity detector. The drop weight mass and the drop weight height determine the impact energy just before the impact.
7.2. Conducting a Test
As discussed earlier that there is no mechanism available for simultaneous triggering of IDAS and LIVMS, the following sequence was carried out before dropping the mass on to the specimen. First the ‘Impulse Data Software’ was switched ON and necessary data were input such as mass of drop weight assembly, and then the ‘Lab View Signal Express Software’ was switched ON. The impact test was then carried out by releasing the drop weight from the release button. The data from the Lab View Signal Express reads continuous signals so, after the impact, continuous data signals from the Lab view signal express were switched OFF.
7.3. Capturing the Data and Analysis
Two separate sets of data were captured: one from the ‘Instron Dynatup data acquisition system’ and other from the ‘Low impedance voltage mode system’. After the impact, raw data has been exported to Microsoft Excel and analysed.
8. Collection of Data from the Developed Test Rig
The following discussions will be focused on the fundamental data processing procedures from IDAS and LIVMS, which include the fundamentals of the drop weight impact test, the concept of force attenuation and its evaluation, the behaviour of the transmitted force and the estimation of energy absorption.
8.1. Fundamentals of Drop Weight Impact Test
The conversion of potential energy into kinetic energy depends on the impactor’s drop height and mass. The velocity of the impactor when the impactor head first touches the specimen can be calculated as per Equation discussed in literature review. The ratio of the energy absorbed by the specimen to the impact energy carried by the impactor is used as the measure of the specimen’s energy absorption performance.
8.2. Force Attenuation and Evaluation
The embedded sensor in the headform is capable of detecting the force transmitted Ft and the load cell in the Instron drop tester weight provides the impact force Fi. Force-blocking effectiveness, which is commonly expressed as the attenuation factor, fatt, for each impact can be calculated using the equation:  | (3) |
where, Ft is the transmitted force collected from the inner surface of helmet;F is the impact force acting directly on the anvil without any specimen.Force attenuation has been studied by many authors[17-20]. A higher value of attenuation factor corresponds to less force being transmitted through the specimen, and a lower value of attenuation factor indicates that much of the impact force has been transmitted through the specimen (100% means no force transmitted and 0% means all forces transmitted).
8.3. Behaviour of Transmitted Force
Figure 13 shows the result from the test rig when impacting on a single-layer flat composite with an input energy of 5J. The data were collected from the LIVMS. The first peak reflects the impact and the rest of the curve indicates the rebounding of the impact head. 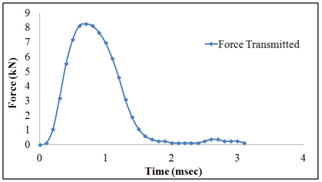 | Figure 13. Force transmitted curve for flat panel composite at 5.6J impact |
8.4. Computation of Energy Absorption
Energy absorption can be calculated by integrating the closed area of the load deflection curve[20]. Graphically, the area beneath the load displacement curve gives the absorbed energy. In the current study, the trapezoidal method was used to calculate the energy absorption from the load displacement curve. In doing this, the curve up to the maximum load was divided into many smaller trapezoids. The total sum of the areas of the small trapezoids gives the energy absorption value of a particular curve.  | (4) |
where, E is the absorbed energy, Si is the trapezoidal area, Fi is the contact force applied on the specimen which can be calculated from Equation (4) and Yi is the displacement increment at each time-fixed interval caused by the impact force.
9. Experimental Results from the Manufactured Test Rig
The experimental results will be published in the future papers. However, in order to give a glimpse for the test rig working status some of the results are discussed.The developed helmet shells were impacted with impact energy of 5.6 Joules at the top, back and side impact locations on the helmet shell. Figure 14 shows the impact at the helmet shell top location. 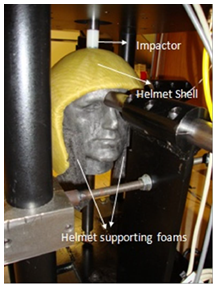 | Figure 14. Impact on top location at riot helmet shell |
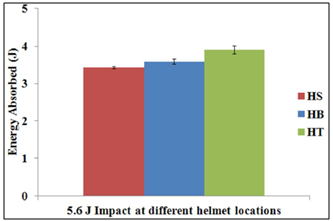 | Figure 15. Energy absorption at different locations on single-piece helmet shells for 5.6J impact |
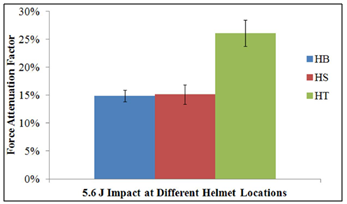 | Figure 16. Force attenuation factor at different locations on single-piece helmet shells for 5.6J impact |
The energy absorbed was calculated from the method discussed above in section 8.4. Also, the force attenuation factor was calculated from the method discussed in section 8.1. In Figure 15 and Figure 16, HS represents the impact at helmet side location, HB represents the impact at the helmet back location and HT represents the impact at the helmet top location. The results show that the helmet top impact location is absorbing more impact energy than the helmet side location and helmet back location for impact energy of 5.6 Joule. Further, force attenuation factor for helmet top location is also much higher than the other two impact location for 5.6 Joule impact. Energy absorption results and the force attenuation results show that the helmet top location has better properties as compared to the helmet side and helmet back location against impact energy of 5.6 Joules.
10. Conclusions
In this paper a detailed procedure for manufacturing a test rig for helmet testing has been described. Successful manufacturing of a test rig provides sufficient capability for the impact testing of the developed continuously reinforced helmets. Moreover, a procedure for conducting impact testing using IDAS and LIVMS simultaneously has been established. With the developed test rig helmet, impact testing can be carried out on the side, back and top locations of the helmets. Initial impact testing on the developed test rig results shows that for an impact having impact energy of 5.6 joules the helmet shells behaves better impact properties at the top helmet shell location. Riot helmets have double curvature surfaces. Due to sufficient abilities of testing helmets at different impact position with the developed test rig, force blocking effectiveness at different helmet locations can be calculated and the behaviour of the transmitted force at different impact locations can be understood. Furthermore, energy absorption at different impact location can also be studied.
ACKNOWLEDGEMENTS
This study was financially supported by NED University of Engineering and Technology, Karachi, Pakistan.
References
| [1] | Zahid, B. and X. Chen Manufacturing of single-piece textile reinforced riot helmet shell from vacuum bagging. Journal of Composite Materials, DOI: 10.1177/0021998312457703. 2012. |
| [2] | Zahid, B. and X. Chen Properties of 5-layer angle-interlock Kevlar-based composite structure manufactured from vacuum bagging. Journal of Composite Materials, DOI: 10.1177/0021998312463457. 2012. |
| [3] | Abrate, S., Impact on composite structures Cambridge University Press. 1998. |
| [4] | Instron, Instron Dynatup model 8200 drop weight impact testing instrument - operating instructions. 2004. |
| [5] | RS Components-Electronic and Electrical components. http://docs-europe.electrocomponents.com/webdocs/0bae/0900766b80bae13c.pdf. cited 2011. |
| [6] | US Department of Justice, NIJ standard for riot helmets and face shields, in National Institute of Justice. 1984. |
| [7] | Malbon, C. and J. Croft, PSDB protective headwear standard for UK police (2004) public order helmets, in Police Scientific Development Branch. 2004. |
| [8] | Shanahan, D., CAN/CSA-Z611-02 Riot helmets and faceshield protection-A national standard of Canada (approved June 2003). Publisher. 2003. |
| [9] | The European Standard, Headform for use in the testing of protective helmets. . 2006. |
| [10] | Becker. Guided fall impact test devices http://www.smf.org/docs/articles/dot_reply_08/mo_tw2.pdf. cited 2011. |
| [11] | Mills, N.J., Protective capability of bicycle helmets. Publisher group.bmj.com, 24. 2011. |
| [12] | Mills, N.J. and A. Gilchrist, Oblique impact testing of bicycle helmets. Publisher International journal of impact engineering, 35. 2008. |
| [13] | Dytran Instrument Inc.http://www.dytran.com/products/1203V.pdf. cited 2008. |
| [14] | Instron. http://www.instron.co.uk/wa/products/impact/model_8200.aspx. cited 2011. |
| [15] | Dytran Instrument Inc.http://www.dytran.com/go.cfm/en-us/content/index. cited 2010. |
| [16] | National Instrument. http://www.ni.com/. cited 2011. |
| [17] | Maach, I.E., et al., Forces resulting from bat impact on the chest of adult human hybrid do not depend on the torso inertia, Med-Eng Systems, Ottawa, Ontario, Canada. 2004. |
| [18] | Robinovitch, S.N., et al., Hip protectors: Recommendations for biomechanical testing — an international consensus statement (part I). Publisher Osteoporosis International, 20. 2009. |
| [19] | Dionne, J.P., et al., Performance of crowd management shin guards subjected to ball and baseball bat impacts, Med-Eng Systems, Ottawa, Ontario, Canada. 2002. |
| [20] | Gong, X., Investigation of different geometric structure parameter for textile honeycomb composites on their mechanical performance, The University of Manchester. 2010. |


 Abstract
 Reference
 Full-Text PDF
 Full-text HTML