-
Paper Information
- Paper Submission
-
Journal Information
- About This Journal
- Editorial Board
- Current Issue
- Archive
- Author Guidelines
- Contact Us
International Journal of Stroke Research
2016; 4(1): 1-9
doi:10.5923/j.stroke.20160401.01

Microparticle Signature for Acute Coronary Syndrome (ACS) by Polarization Flow Cytometry
 Abstract
 Reference
 Full-Text PDF
 Full-text HTML
Puspita Das Roy 1, Sounik Sarkar 1, Anjan Kr Dasgupta 1, Pradipta Guha 2, Pradip Sarkar 3
1Department of Biochemistry, University of Calcutta, Kolkata, West Bengal, India
2Department of General Medicine, Calcutta National Medical College & Hospital, Kolkata, West Bengal, India
3Cardiology Department, Calcutta Medical College & Hospital, Kolkata, West Bengal, India
Correspondence to: Anjan Kr Dasgupta , Department of Biochemistry, University of Calcutta, Kolkata, West Bengal, India.
| Email: |  |
Copyright © 2016 Scientific & Academic Publishing. All Rights Reserved.
This work is licensed under the Creative Commons Attribution International License (CC BY).
http://creativecommons.org/licenses/by/4.0/

Microparticles have been of keen interest in biomedical science for last few decades. The correlation of microparticles with different disease profiles, e.g. platelet mediated blood cell disorder, is well known. In this study we aim to use a microparticle based disease marking system based on pro-activator like properties of nanoparticles. Challenging platelet cells with nanoparticles changes their microparticle release profile. The extent of this release can in turn serve as a disease marker for Acute Coronary Syndrome (ACS) patients. Age and sex matched ACS and non-ACS patients have been chosen as subjects. Platelet rich plasma from both case and control groups have been isolated and allowed to interact with gold nanoparticle. For quantification of data a parallel computational method is employed using Matlab Engine. The analysis helped image based representation of the ACS specific microparticle release and their modulation by gold nanoparticle. The polarization flowcytometry is used as label free microparticle marker. The analyses reveal a significant difference in the microparticle population between ACS and non-ACS individuals. The differential of the release is further amplified in presence of gold nanoparticles. It has been observed that there is some significant difference (p value= 0.036) in the production of microparticles between ACS and non-ACS individuals after GNP incubation and this difference between cases and controls can be used further as a signature for ACS. To our knowledge the imaging aided flowcytometric method has for the first time enabled micropatricle classification based on polarization scattering.
Keywords: Acute Coronary Syndrome, Platelets, Nanoparticle, Microparticle, Polarization Flow Cytometry, Image Presentation of data
Cite this paper: Puspita Das Roy , Sounik Sarkar , Anjan Kr Dasgupta , Pradipta Guha , Pradip Sarkar , Microparticle Signature for Acute Coronary Syndrome (ACS) by Polarization Flow Cytometry, International Journal of Stroke Research, Vol. 4 No. 1, 2016, pp. 1-9. doi: 10.5923/j.stroke.20160401.01.
Article Outline
1. Introduction
- The ground zero of designing disease markers is combining various diagnostic methods and not depending on a single one. This is particularly true for acute coronary syndrome (ACS) which is a leading cause of death in affluent [1] as well as in poorer countries like India [2]. The challenges in ACS is that it is an umbrella term in which there is either a reversible (unstable angina) or irreversible stoppage of blood supply to heart (myocardial infarction). The wide spectrum of symptoms associated with ACS and their diverse manifestations need integrating new technological routes for the diagnosis. In this paper we use a combination of nanotechnology [3-5] and image- analysis aided flow cytometry to design a quantifiable ACS marker.
1.1. Nanoprobes as Disease Marker
- Understanding of biological processes on the nanoscale level is a strong driving force behind the development of nanotechnology. Nanotechnology has the potential to interfere with basic biological mechanisms because of their integral properties like tunable electronic, magnetic and optical properties, extremely small size and the advancement in characterization, surface modification and synthesis [3-5] make it a potent tool in different medical applications [6-9]. This simple size comparison gives an idea of using nanoparticles as very small probes that would allow us to explore the cellular machinery without introducing too much interference. Biomedical opportunities for nanotechnology include targeted drug delivery, the development of improved imaging contrast agents, and treatment of cancer etc. Most of the drugs or drug delivery agents and also the imaging contrast agents are administered through blood; therefore it will be important to study the response of blood components with nano-forms.As platelets are the most sensitive cells in the blood and plays a critical role during myocardial infarction it is obvious that the nano effect will be remarkable in case of platelets especially when we use nano particles as marker of ACS. Till now there are some reports about the effect of nanoparticles on platelets but the special property that can make nanoparticle to act as disease marker may be an important question in the nano-medical context.
1.2. Platelet Derived Microparticles
- Fundamental questions about formation and role of microparticles in relation to human disease are just beginning to be investigated and understood. More recent studies have demonstrated that platelet microparticles function as a transport and delivery system for bioactive molecules, participating in hemostasis and thrombosis, inflammation, malignancy infection, transfer, angiogenesis, and immunity [10]. Plasma-derived microparticles were first identified as an activity supporting thrombin generation in platelet poor plasma and were referred to as `platelet dust' [11]. Subsequent marker studies demonstrated that plasma-derived microparticles can originate from leukocytes, erythrocytes, or endothelial cells as well as platelets. These microparticles are defined primarily on the basis of their surface antigens and the antibodies. After activation of platelets with certain stimuli, there is a release of platelet microparticles. The membranes of microparticles contain platelet GPs Ib, IIb, and IIIa as well as P-selectin and thrombospondin [12, 13]. Elevated levels of microparticles have been detected in patients with disseminated intravascular coagulation, unstable angina, myocardial infarction, coronary angiography, transient ischemic attacks, and diabetes mellitus and during cardiopulmonary bypass. Conversely, a deficiency of platelet microparticle generation leads to a bleeding disorder with isolated prolonged bleeding time. In addition to their procoagulant effect, microparticles may interact with components of the vessel wall, which contributes to their pro-thrombotic activities [14]. There are good evidences in literature on the close relationship between the ACS and the microparticle release profile [15, 16].
1.3. Nanoparticle Induced Microparticles
- Our group has recently observed that nanoparticles can alter microparticle formation and this key observation led us to a detailed investigation of how artificial microparticle release by nanoparticle can be associated with ACS. The superiority of the microparticle profile with nano-inducer and its potential to serve as disease signature is investigated using a specialized flow cytometric technique that in principle detects particles in the micron range.
1.4. Microparticle Characterization using Polarization Flow Cytometry
- The advantage of characterizing microparticles (as compared to nanoparticles) is however challenged by the difficulties in standardization [17]. The dependence of the gated microparticle population on the calibration procedure and instrument make encouraged us to adapt a different route of characterization. A polarization flow cytometry has been employed for this purpose. In such a technique depolarized orthogonal light scattering appears as a separate parameter. We may symbolically express the light intensity I as a function of electric field,
 | (1) |
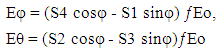 | (2) |
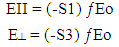 | (3) |
 | (4) |
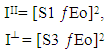
 Or,
Or,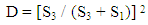 | (5) |
 | (6) |
1.5. The Skeleton of the Combination Approach
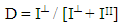
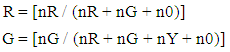
- The approach conceived by us needs integration of large data sets involving inclusion of polarization flow cytometric profiles from control and disease and filtering the gated populations that corresponds to the microparticle population. The quantification of the comparative nature of the microparticle profile can be performed if we do the following simple trick. We may grid the III - I┴ data into an image Im. We can choose image planes R and G (B plane being null) in which R plane shows the polarization profile (say, III - I┴) of the control and G plane shows similar profiles of the disease prone individual (ACS in our case). As a result we can construct an RGB image with overlapping population colored yellow, exclusive control is red and exclusive disease given by green. The pixel ratio of the green and red plane (R and G) can be expressed by:
 | (7) |
 | (8) |
2. Materials and Methods
2.1. Subjects and Sample Collection
- Acute Coronary Syndrome (ACS) otherwise known as myocardial infarction encompasses a spectrum of unstable coronary artery disease from unstable angina to transmural myocardial infarction. All have a common etiology in the formation of thrombus on an inflamed and complicated atheromatous plaque; these plaques can rupture and present sites for unwanted platelet binding. Following this, events occur which lead to formation of abnormal thrombus which blocks an intact blood vessel.Patients who come with severe chest pain are advised to admit in the hospital. At zero hour of admission they are administered with medicines aspirin and clopidogrel and then ECHO and ECG done of those patients. On the basis of the results of these tests patients are diagnosed as different type of myocardial infarction.Blood samples were collected from both patients with acute coronary syndrome [ACS] (n=24) and non-ACS (n=22) individuals. Ethnicity and particular age bar was maintained during blood collection. Patients with ACS were under the medication of anti-platelet drugs for 4-5 days and the non-ACS individuals were without any bleeding disorder. Family history of disease was collected from cases and controls along with their disease history.
2.2. Ethics Statement
- The study was approved by the Bio Ethics Committee for Animal and Human Research Studies, University of Calcutta and all subjects gave written informed consent.
2.3. Platelet preparation & Synthesis of Gold Nanoparticle (GNP/AuNP)
- The detailed description of platelet preparation and synthesis of gold nanoparticles [19] along with their characterization and selection of most reliable GNP [20] is described in the supplementary section.
2.4. Sample Preparation for Flowcytometry
- Platelet rich plasma (PRP) was prepared from both ACS patients and non-ACS controls individuals. Each plasma samples was then divided into two parts in a cuvette containing 250 µl of PRP. After this separation gold nanoparticle was added to one cuvette (final concentration 8μM) of each individual’s PRP and allowed to incubate at 37°C for overnight. The other cuvette with only PRP was treated as control against gold nanoparticle and allowed to incubate at the same temperature and time.As the ACS patients were containing medicines for maximum of 4-5 days and non-ACS individuals were without any anti platelet medication therefore, to rule out any interference of drug-effect in the result of above mentioned procedure we had separated 5ml blood from each non-ACS individual previously and incubated with aspirin (purchased from SIGMA) [final concentration of aspirin in blood is 5mM]. PRP was prepared from each non-ACS aspirin incubated blood [21]. The samples were then run through Becton-Dickinson influx cell sorter on the next day of the Incubation. Forward and side scattering signals have been recorded for each sample in logarithmic mode and the data were analyzed by Flowjo software (www.flowjo.com). In the second mode of analysis an overall distribution of the flow cytometric data could be realized by superposing the control and experimental data on a single image plane (R plane) that corresponded to the control and the (G plane) that corresponded to the experimental set. The blue image plane (B) was padded with zero [22]. For polarization cytometry which has four independent fluorescence label free parameters such image representation also helped in finding out the parameter P defined in equation (8).The polarization flow cytometry [23] has been a tested and used to detect cell types with complex granularity. We have used the parameters of parallel and perpendicular polarized flow cytometry (see equations). BD influx (US) was employed to determine FII, F┴ representing the forward scattering with 0° and 90° polarization and SII and S┴ representing the depolarized and polarized side scattering. The incident polarized laser excitation was performed at 488 nm. For each experiment 10000 events points were chosen. The initial data analysis was performed using FLOWJO LLC (US). MATLAB engine R14, Mathworks Inc was used using a cluster computational environment in which 12 nodes are connected.
3. Result
3.1. Demography of Retrospective Study
- All patients and controls were living in and around the city of Kolkata, located on the eastern region of India. Most of the patients and healthy controls belonged to low-income group (family income <100 US$ per month) and had similar nutritional status. None of the patients and controls was exposed to specific occupational or environmental stress so environmental effects were similar. Average age of both case group and control group was 56.8+2 years.
3.2. Characterization of Gold Nano-Particles
- We have prepared AuNP1, AuNP2, AuNP3, and AuNP4 by citrate reduction method. The prepared nanoparticles are then subjected to characterization which includes Plasmon peak, hydrodynamic radius and zeta potentials. We have chosen AuNP1 (diameter ~20nm, at atomic concentration 40 μM of gold) for further experiments as it shows the most proaggregatory effect. Figure S1 and S2 represent UV-VIS spectroscopic measurements and hydrodynamic radius & Zeta potential respectively of AuNP1.
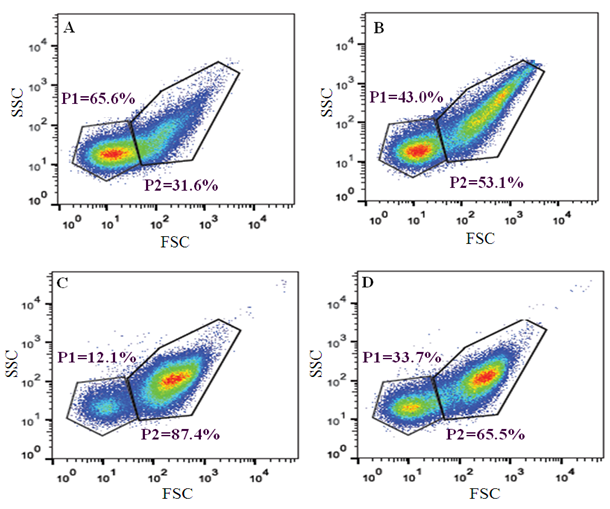 | Figure 1. Forward and side scattering signal measurements of PRP of ACS sample and non-ACS sample. P1 indicates the percentage of microparticle population and P2 indicates the percentage of platelet population. (A), (B) represents the signal of PRP of ACS without incubation and with overnight incubation of GNP respectively. (C), (D) represents the signal of PRP of non-ACS without incubation and with overnight incubation of GNP respectively |
3.3. Identification of Signature for ACS from Flowjo
- It would be interesting to find any signature marker which can be used to detect ACS patients from the population following interaction with GNP. Since previous studies had already established that there is a difference in the microparticle population between ACS and non-ACS individuals (Figure S3). Figure 1 shows the Flowjo based analysis when we get the signals of Forward and Side scattering in logarithmic scale. Gated population at the left bottom is considered as microparticle population [24] the rest being the platelet population. The analyses also indicate some differences in the population of microparticles when treated with gold nanoparticle in ACS individual (Figure 1a & 1b). It follows that after overnight incubation with GNP the percentage of microparticle population decreases from 65.6% to 43% and the platelet population increases from 31.6% to 53.1%. In control individual, the scenario is just opposite (Figure 1c & 1d). Here, after incubation with GNP the percentage of microparticle population increases from 12.1% to 33.7% and platelet population decreases from 87.4% to 65.5%. The above figures represent the difference in percentage of microparticle and platelet population for single ACS and non-ACS individuals. When we measure the difference of microparticle (MP) population after incubation of GNP in all the ACS and non-ACS samples, there has been shown a significant difference (p value= 0.036) between these cases and controls (Figure 2). We have emphasized only on the difference of microparticle population between cases and control after GNP incubation because the difference of platelet population does not show any significant differences between ACS and non-ACS individuals. Interestingly, it has been observed that there is some significant difference in the production of microparticles between ACS and non-ACS individuals after GNP incubation and this difference between cases and controls can be used further as a signature for acute coronary syndrome.
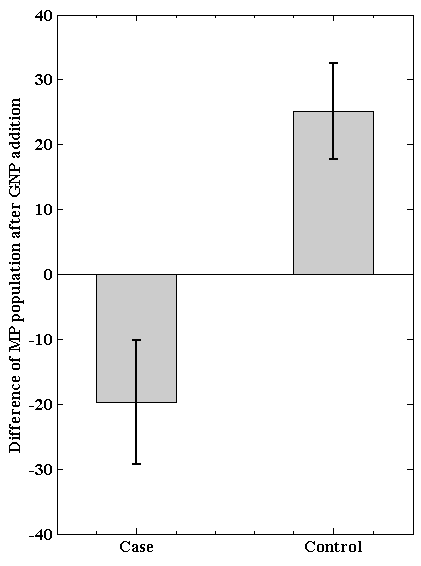 | Figure 2. Difference of microparticle population after incubation of GNP between ACS (case) and non-ACS (control) individuals |
3.4. ACS Signature from Image Representation of Polarization Flow Cytometry
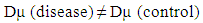
- Figure 3a summarizes the image based representation of the polarization flow data, red and green pixels respectively represents the control and ACS points, yellow pixels representing the overlap. The upper and lower panel of Figure 3a represents experiments in absence and presence of GNP. As seen in the lower panel (gold nanoparticle induced microparticle) of Figure 3a, the green pixels are much higher in the lower panel. The important suggestion is that microparticle population in the left bottom corner has ACS specific signature in presence of gold nanoparticle. The P values for the upper panel of Figure 3a are, -0.0463 -0.0425 0.0198 -0.0355 the corresponding lower panel values being 0.0476 0.0058 -0.0013 0.0047. In the upper panel of Figure 3b the red color represents absence and green color represent presence of gold nanoparticles. The righter panel of Figure 3b shows that there are higher gold nanoparticle sensitivity of ACS population and accordingly has P values 0.0196 and 0.1135 respectively.
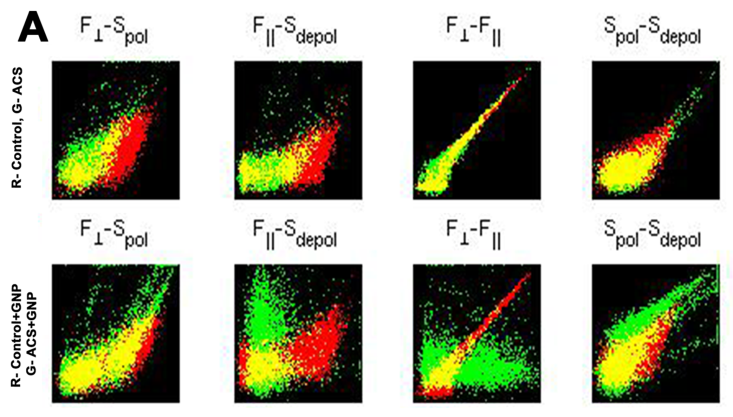 | Figure 3A. Upper panel represents the forward (F) and side scattering (S) signals of ACS (Green dots) and control group (red dots) and the lower panel represents the dot plot of GNP incubated ACS (Green dots) and control group (red dots) at different mode of acquisition (perpendicular, parallel, polarized, depolarized) in flow cytometry. Yellow dots indicate the overlapping population of red and green dots. The population has been chosen from the gated region of Figure 1 |
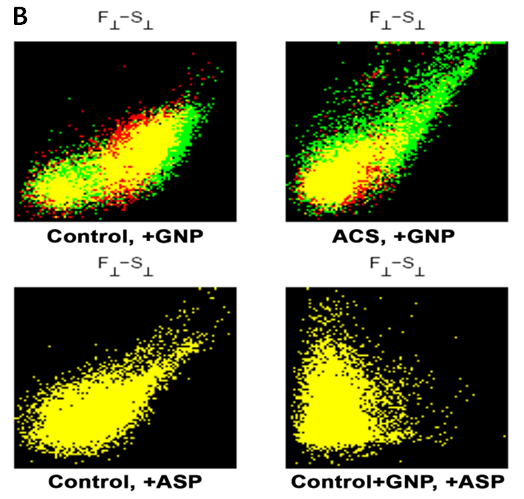 | Figure 3B. (Upper panel) Represents the population distribution of control and ACS group with and without GNP incubation. Here, the red and green populations respectively indicate without and with GNP incubation to control and/or ACS group. Yellow population is the overlapping region of green and red. The lower panel represents dot plot profile of Aspirin added control group with and without GNP. Here, yellow population is the overlapping region of the red (control and/or control+GNP) and green (Asp incubated control and/or Asp incubated control+GNP) populations |
3.5. In Vitro Study of Aspirin Effect on Microparticle Production
- When we obtain the difference in microparticle population after incubation with GNP between cases and controls, to detect any effect of anti platelet drug that can play a significant role behind the difference this in vitro study of aspirin has been designed. It has been clearly seen from the flow cytometric analysis of the non-ACS individual with aspirin incubation that there is no interference of the drug in the production of microparticle population as the P1 population (quadrant Q4) remains similar before and after aspirin incubation (Figure S4).
4. Conclusions
- Many cells which are circulating continuously in the blood stream, including platelets, endothelial cells, leukocytes, and erythrocytes, shed small (0.1-1 µm) fragments of their plasma membranes into the circulation. There is increasing evidence that these fragments with a submicron level, termed microparticles, have important physiological roles. The microparticles which are specific for platelets are the most abundant in the bloodstream [25-27]. Platelet microparticles have been implicated in thrombus formation and in the pathogenesis of atherosclerosis as well as the regulation of angiogenesis [28, 29]. Despite their apparent participation in important physiological and pathological processes, fundamental aspects of platelet microparticle physiology remain unexplored. We have tried to use these microparticles production as a disease marker on the basis of microparticle-nanoparticle interaction. It has been studied that microparticle populations correlated with history of myocardial infarction or peripheral vascular disease. An increasing number of studies indicate that microparticles contribute to intercellular communication [30]. While the physiological significance of this 'platelet dust' may have been overlooked for many years, recent work suggests that these tiny blebs from cells may play an important role in the transport and delivery of bioactive molecules and signals throughout the body. Microparticles may affect target cells either by stimulating them directly via surface-expressed ligands [31] or by transferring surface receptors from one cell to the other [32, 33]. Since platelet microparticles are highly procoagulant, it has been proposed that they may contribute to the pathogenesis of arterial thrombotic disease. Several studies have suggested that circulating microparticles provide a potential prognostic marker for atherosclerotic vascular disease [34]. P-selectin and CD63-exposing platelet microparticles reflect platelet activation in peripheral arterial disease and myocardial infarction [35]. Some studies have demonstrated increased levels of platelet microparticles in survivors of myocardial infarction [36]. It has also been demonstrated a significant independent association between large platelet microparticles and plasma thrombin-antithrombin complexes in patients with myocardial infarction, but not in healthy controls. To our knowledge the imaging aided flow cytometric method has for the first time enabled micropatricle classification based on polarization scattering. The higher value of S┴ (Figure 3a leftmost upper panel) in the ACS, implies that its depolarization ratio is distinctive from control. The control experiment in Figure 3b shows that the effect of drug like aspirin may not be the reason for the ACS specific signature as revealed by the P values for data in Figure 3a. Notably the P values are null in both the left bottom panel and right bottom panel of Figure 3b (both representing control in presence and absence of aspirin). The right bottom panel of Figure 3b (for which P=0) further implies that the gold nanoparticle also does not interfere when aspirin is present.
ACKNOWLEDGEMENTS
- We would like to sincerely acknowledge Indian Council of Medical Research (ICMR), Government of India [Sanction no. 45/16/2013/Nan-BMS] for supporting the research work.
Supplimentary Section
- Platelet preparation 10 ml blood was drawn from normal individuals as well as from Acute Coronary Syndrome (ACS) patients responding positively to clopidogrel to block the low-affinity ADP receptor P2Y12 and Aspirin to block the high-affinity ADP receptor P2Y1. A total of 9.5 ml of blood was mixed in sodium citrate anticoagulant 3.2% (final ratio 9:1 whole blood/citrate) and 0.5 ml of blood was mixed with EDTA for subsequent analysis of platelet counts, mean platelet volume and platelet width distribution, using an automated cell counter (SysmexSF3000). Platelet Rich Plasma (PRP) was obtained after centrifuging blood at 200 g for 10 min. Platelet Poor Plasma (PPP) served as an appropriate blank and it was obtained by centrifugation of blood at 1500 g for 10 min.Synthesis of Gold nanoparticle (GNP/AuNP)AuNPs were prepared by the citrate reduction of HAuCl4 (19). In short an aqueous solution of HAuCl4 (496μM, 6.25 ml) was brought to boiling condition and stirred continuously by automatic stirrer; different concentrations (380μl, 250μl, 156μl and 140μl from 20mM stock solution) of tri sodium citrate solution was then added quickly, resulting in a change in solution colour. The colour varies from orange red to deep violet. After the colour change, the solution was refluxed for an additional 10minutes and then, allowed to cool at room temperature. The diameters of AuNPs in the resultant solution were found to be in the range from 20nm to 70nm. For size dependence studies AuNP1, AuNP2 AuNP3 & AuNP4 were used with size (18± 2, 43.8±2, 54.7±2 68 ±2nm). Most of the experiments were performed using AuNP (i.e. AuNP1 with diameter ~20nm) at atomic concentration 40 μM of gold, as this showed the most pronounced pro-aggregatory effect. In further discussions the concentration of gold will be considered as the atomic concentration (40 μM).Characterization of Nano-particlesWe have prepared AuNP1, AuNP2, AuNP3, and AuNP4 by citrate reduction method. The prepared nanoparticles are then subjected to characterization through optical measurements. We have chosen AuNP1 (diameter ~20nm, at atomic concentration 40 μM of gold) for further experiments as it shows the most proaggregatory effect (20).Optical measurementsA. The plasmon peak of the GNP was measured using Thermo Scientific, Evolution 300 UV-VIS. B. The hydrodynamic radius was measured using Malvern NanoZS. This instrument (Malvern NanoZS) was also used to measure the zeta potential (ζ) of the AuNPs’ colloidal suspension.
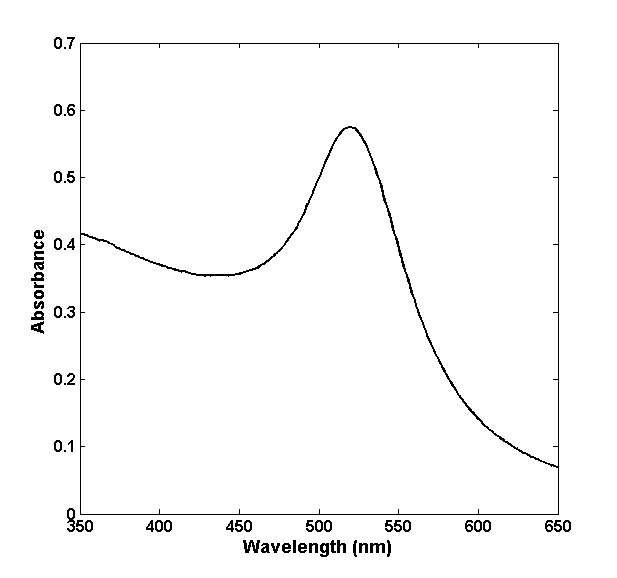 | Figure S1. UV-VIS spectroscopic measurement gives the plasmon peak of GNP1 that appears at 520 nm |
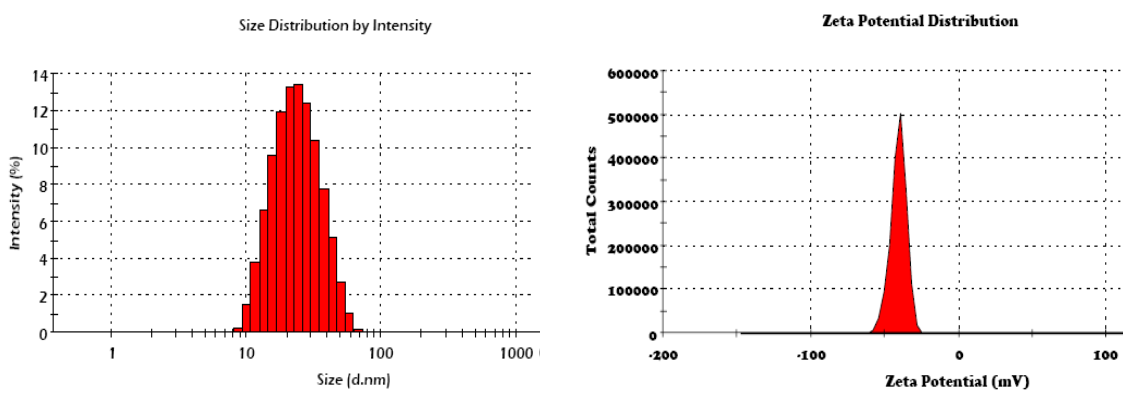 | Figure S2. Hydrodynamic radius and Zeta potential of GNP1 were measured by dynamic light scattering (DLS). The size of GNP1 appears ~20nm and the Zeta potential appears ~38mV |
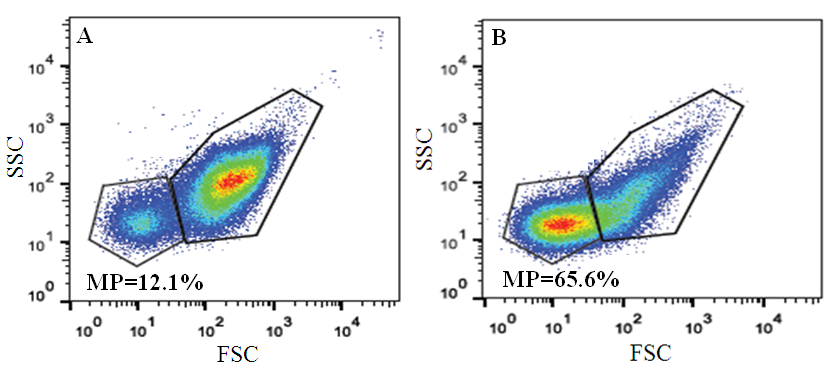 | Figure S3. Represents the difference in microparticle population between (A) non-ACS (control) and (B) ACS individuals. MP indicates the percentage of microparticle population which is 12.1% for control and 65.6% for ACS |
 | Figure S4. Represents the forward and side scattering signals of platelet rich plasma of non-ACS individual. (A) Platelet rich plasma of non-ACS individuals without any aspirin (B) Platelet rich plasma of non-ACS individuals with aspirin incubation (C) Overlapping image of A and B |