Shimin Chen1, 2
1School of Mathematics and Statistics, Guilin University of Technology, Guilin 541006, China
2Guangxi Colleges and Universities Key Laboratory of Applied Statistics, Guilin, 541004, China
Correspondence to: Shimin Chen, School of Mathematics and Statistics, Guilin University of Technology, Guilin 541006, China.
| Email: |  |
Copyright © 2026 The Author(s). Published by Scientific & Academic Publishing.
This work is licensed under the Creative Commons Attribution International License (CC BY).
http://creativecommons.org/licenses/by/4.0/

Abstract
Traditional multivariate process control methods typically rely on the normality assumption, which is often violated in real-world manufacturing data, leading to poor monitoring efficiency. To address this issue, this paper proposes a novel multivariate cumulative sum control chart based on the multivariate sign test, denoted as MSCUSUM, for monitoring location shifts in multivariate processes from the elliptical distribution family. By transforming the observation vectors to follow a uniform distribution on the unit p-dimensional sphere, the proposed method is distribution-free and robust against non-normal distributions within elliptical distribution family. Simulation studies compare the MSCUSUM chart with the multivariate sign-based exponentially weighted moving average (MSEWMA) chart under various non-normal scenarios, including the multivariate t-distribution and Gamma distribution, across different dimensions. Results show that the MSCUSUM chart performs significantly better than the MSEWMA chart for small to moderate shifts under non-normal scenarios, particularly in the single-component shift scenario. Finally, a real case study from an aluminum electrolytic capacitor manufacturing process is adopted to illustrate the effectiveness and practicality of the proposed MSCUSUM chart.
Keywords:
Affine-Invariant, Non-parametric Procedure, MCUSUM, Robust Monitoring, Multivariate Process
Cite this paper: Shimin Chen, Robust Monitoring for Multivariate Processes with Unknown Distributions, International Journal of Statistics and Applications, Vol. 16 No. 2, 2026, pp. 39-51. doi: 10.5923/j.statistics.20261602.01.
1. Introduction
With the development of automated data acquisition technology, simultaneous monitoring of multiple quality characteristics in production processes has become commonplace. This approach is referred to as Multivariate Statistical Process Control (MSPC) in modern quality control theory. One of the primary tasks in MSPC is to promptly detect shifts in the location parameters of multivariate processes. In early research on multivariate process monitoring, Hotelling’s control chart was commonly used to detect shifts in the process location parameters; see [1], [2], and [3]. However, it is sensitive only to large shifts, not to small and moderate shifts. To overcome this drawback, multivariate cumulative sum (MCUSUM) and multivariate exponentially weighted moving average (MEWMA) control charts have been developed; see, e.g., [4,5,6], and [7].Most existing MSPC methods are established on the premise that process data follow a multivariate normal distribution. Nevertheless, practical production data often deviate from the normal distribution, and the underlying distribution of quality characteristics is generally unknown. Consequently, control charts designed under the normality assumption may lead to reduced monitoring efficiency. Under such circumstances, nonparametric or robust control charts tend to exhibit more favorable monitoring performance. [8] proposed a multivariate cumulative sum procedure based on the cross-sectional anti-ranks statistics of the measured components. [9] developed a distribution-free monitoring framework utilizing support vector machines. [10] and [11] extended the data-depth theory proposed by [12] to nonparametric multivariate process monitoring. [13] designed a class of nonparametric control charts grounded in the sign statistic. [14] applied the bootstrap method to multivariate process monitoring. [15] incorporated the spatial sign-rank method into the EWMA scheme, enhancing robustness in high-dimensional settings. Moreover, the multivariate sign test also serves as a highly effective monitoring approach, see, e.g., [16,17,18,19].Process monitoring with control charts is divided into Phase I and Phase II. The objective of Phase I is to estimate process parameters and evaluate process stability using an in-control historical dataset, whereas Phase II focuses on real-time monitoring to rapidly detect abnormal changes. Therefore, prior to conducting Phase II monitoring, it is necessary to obtain in-control process parameters and determine the corresponding control limits. For a multivariate normal population with mean vector µ, the multivariate location parameter is identical to µ. For data distributions that violate the normality assumption, such as the prevalent elliptical distribution family, the multivariate location parameter must be derived via an iterative estimation procedure. To address this issue, this paper focuses on this distribution family and combines the iterative algorithm of [20] with the multivariate cumulative sum (MCUSUM) control chart of [5] for multivariate process monitoring. The proposed chart is theoretically distribution- free over the elliptical distribution family and robust to heavy-tailed and skewed data. The remainder of this paper is structured as follows: Section 2 briefly introduces the multivariate sign-based cumulative sum method. Section 3 investigates its numerical performance. Section 4 applies the proposed control chart to a real dataset from the manufacturing process of aluminum electrolytic capacitors. Section 5 draws conclusions and discusses future research directions.
2. Methodology
We describe the proposed control chart in four parts. In Section 2.1, the monitoring problem of multivariate processes is introduced. Then, a brief introduction of the multivariate sign test is presented in Section 2.2. A new multivariate CUSUM control chart combined with the multivariate sign test is derived in Section 2.3. Practical guidelines for design and computation are given in Section 2.4.
2.1. The Problem of Monitoring Multivariate Processes
Assume that the  observation
 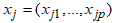 collected over time comes from a multi- variate change-point model. This model can be described as:
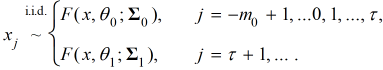 | (1) |
where  is a given multivariate distribution function with location parameter
  and scale parameter
  ;
;  is an unknown change point at which the process shift occurs, and
  denotes the number of historical in-control observations. This model implies that product quality characteristics are described by the distribution function. When the process is out of control, its location parameter or scale parameter change accordingly. In practical production processes, engineers expect an alarm signal to be triggered immediately after a process change takes place, that is, they need to quickly detect abnormal changes in the location parameter or scale parameter.The out-of-control state of a process may result from a shift in the location parameter or a change in the scale parameter, which can further lead to production line shutdowns. This paper mainly focuses on the monitoring problem under location parameter shifts; that is, to continuously monitor the in-control location parameter
  and issue an alarm signal immediately when the process location parameter changes, i.e.,
  . Furthermore, the elliptical distribution family data is widely encountered in actual production processes, and industrial quality characteristics frequently deviate from normality assumption. Nevertheless, most existing process monitoring methods are established based on the normality assumption, leading to limited applicability for processes with an elliptical distribution. Accordingly, this paper addresses the online monitoring of location parameters under the elliptical distribution family.
2.2. A Brief Review of Multivariate Sign Test
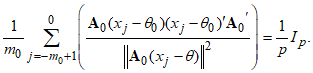
In multivariate process monitoring, traditional methods often rely on the normality assumption, which is frequently violated in real-world data. To overcome this limitation, we adopt the affine-invariant multivariate sign test proposed by [18]. This approach does not require the data to follow a specific distribution and is inherently robust against non-normality distributions. Its core idea is to transform the original observation vectors onto the unit sphere, thereby removing the effects of scale and correlation while retaining only directional information.Specifically, let  be a sample from a continuous p-dimensional distribution. Through a data-driven transformation, the matrix
  is transformed into a positive definite symmetric
  matrix with its trace satisfying
 . For any matrix
  that satisfies
  , the following equation holds:
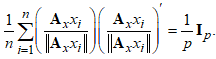 | (2) |
where  denotes the Euclidean norm and
  denotes the
  identity matrix. The transformed unit vectors
  are uniformly distributed on the unit p-sphere, with a fixed covariance structure
  . Based on this transformation, the test statistic
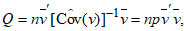 | (3) |
where 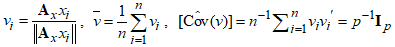 . It can be seen that for the elliptically symmetric directional distribution family, the is distribution-free. It performs better than Hotelling's
  test and other multivariate nonparametric tests when the underlying distribution is non-normal. Therefore, we consider using this multivariate sign test to tackle the monitoring problem in multivariate processes.
2.3. Control Chart for Monitoring the Multivariate Process
The proposed monitoring scheme contains two steps. First, it is necessary to estimate the multivariate location parameter  and the transformation matrix
  from the historical in-control sample of size
  . In this paper, we adopt the iterative algorithm proposed by [20] to compute the multivariate location parameter
  and the transformation matrix
  , and the resulting estimators satisfy the optimal solution defined by the following equations:
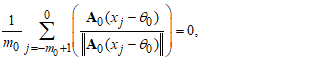 | (4) |
 | (5) |
where  is multivariate location parameter of
  , and
, and  is a
is a  upper triangular positive-definite matrix with a one in its upper-left element. It is worth noting that when the sample follow a multivariate normal distribution with mean
  and covariance matrix
  , the multivariate location parameter
  obtained by iterative estimation nearly coincides with the theoretical mean
  , and the matrix
  satisfies
 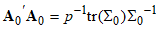 . Unless otherwise specified, we use
  rather than
  in what follows.Next, we transform the observation
  to obtain a unit vector
  whose variance-covariance structure is similar to that of a random variable uniformly distributed on the unit p-sphere. The transformation formula is given as follows:
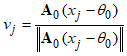 | (6) |
when the process is in an in-control state,  is uniformly distributed on the unit p-sphere, with a mean of 0 and a covariance matrix
  , where
  denotes the p-dimensional identity matrix. To improve the monitoring sensitivity to small and moderate shifts, this paper constructs a MCUSUM control chart, and the definition of the corresponding MCUSUM statistic is presented as follows
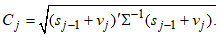 | (7) |
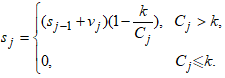 | (8) |
where the reference value  , and the initial cumulative vector is set as
  . Thus, the alarm condition for triggering the MCUSUM control chart is given by
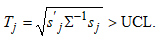 | (9) |
where the control limit  is determined via simulation to achieve a specified in-control average run length (IC ARL).For the choice of the reference value
  , [5] pointed out that the optimal value is half the process magnitude measured by the noncentrality parameter
  , i.e.,
  . The noncentrality parameter
  is defined as
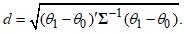 | (10) |
where  and
and  denote the in-control and out-of-control location parameter vectors, respectively, and
  is the covariance matrix of the unit vectors
  . This parameter quantifies the standardized magnitude of the original location shift
  . Importantly, this value of
  is optimized to achieve optimal detection for a shift of size , but it does not restrict the actual process shift to be exactly
  .
.
2.4. Design of the Proposed Approach
For simplicity, the proposed approach based on multivariate sign test is denoted as MSCUSUM. According to the theory of [16], affine-invariant statistics are distribution-free over the family of elliptical directional distributions. Consequently, the corresponding control limits are identical for all distributions within this family. Accordingly, the control limits in this paper are determined based on the multivariate standard normal distribution with an in-control sample size of m0 = 30, 000. For different dimensions p and reference values k, Monte Carlo simulation is adopted to calculate the control limits of the MSCUSUM control chart when the target in-control average run length (IC ARL) is 200. The detailed results are presented in Table 1.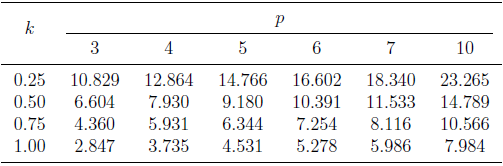 | Table 1. Control Limits of the MSCUSUM chart with IC ARL = 200 under continuous p-variate distributions |
Typically, the size of historical in-control samples affects the accuracy of parameter estimation. To investigate this issue, Monte Carlo simulations are performed to evaluate how the parameters θ0 and A0, estimated from sample sizes m0 = 50, 100, 200, and 500, impact the IC ARL values when the target IC ARL is set to 200. The results are presented in Table 2. The simulation results indicate that when the in-control sample size is small, e.g., m0 < 100, it tends to lead to inaccurate parameter estimation. Therefore, this paper assumes the historical in-control sample size is sufficiently large (e.g., m0 > 100) to ensure the estimation error is negligible.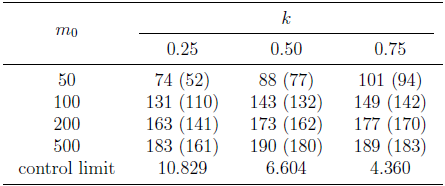 | Table 2. IC ARL and SDRL values with various in-control sample  . Numbers in parentheses are SDRL values . Numbers in parentheses are SDRL values |
3. Simulation Studies
In this section, we evaluate the performance of the proposed MSCUSUM control chart under both in-control (IC) and out-of-control (OC) conditions, with a focus on detection ability under OC conditions. To verify its performance advantages, this chart is compared with the MSEWMA control chart developed by [19]. First, we generate  historical IC samples to estimate the process parameters
  and
and  . For illustration, only the experimental results with the target IC ARL of 200 are presented in this paper, and all ARL results are obtained based on 100,000 replicate simulations. Following the robustness analysis framework of [19], three distribution scenarios are considered: (i) Multivariate standard normal distribution, which corresponds to the distribution under ideal conditions; (ii) Multivariate t-distribution with
  degrees of freedom, denoted as
  , which has heavy-tailed characteristics; (iii) Multivariate Gamma distribution with shape parameter
  and scale parameter 1, denoted as
  , which has asymmetric characteristics.In all the above distribution scenarios, the covariance matrix is uniformly set as
  , where the diagonal elements satisfy
  , and off-diagonal elements follow the exponential decay rule
  for
for  . Furthermore, all simulations are conducted for both the low-dimensional case with and the high-dimensional case with
  to evaluate the monitoring performance and explore the influence of variable dimension on detection effectiveness. In the simulation study, two shift scenarios are considered as follows: (I) Single-component shift scenario:
 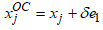 , where
  is a unit vector. This design is used to evaluate the ability of the proposed control chart to detect local component shifts; (II) Multi-component joint shift scenario:
 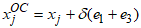 , where
  . This design is used to assess the detection performance of the control chart when multiple components shift simultaneously. This simulation codes are available from the author upon email request.
3.1. Comparison Under the Normality Assumption
In this subsection, the simulated samples are generated from the multivariate standard normal distribution  . The simulation results of the MSCUSUM chart with reference values
  and the MSEWMA chart with smoothing parameters
  for dimensions
  and
and  are summarized in Table 3 and Table 4, respectively. Each table presents the out-of-control average run length (OC ARL) and the standard deviation of run length (SDRL) under different shift scenarios to fully characterize the distribution of run length.
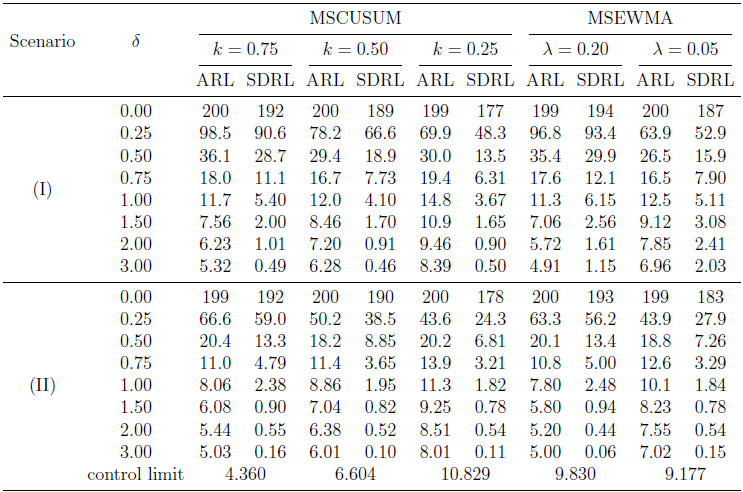 | Table 3. OC ARL and SDRL values with multinormal distributions (p = 3) |
As shown in Table 3, under the in-control condition  , the ARL values of all control charts remain stable around the target value of 200. In Scenario (I), the detection performance of the MSCUSUM chart varies with the parameter
  : for
: for  , the ARL under some parameter settings (e.g.,
  ) is slightly higher than that of the MSEWMA chart with
  , but remains competitive compared with the MSEWMA chart with
  . For
. For  , the MSCUSUM and MSEWMA charts exhibit negligible differences in performance. Both methods are capable of detecting moderate shifts quickly, with comparable overall performance. In Scenario (II), the MSCUSUM chart still exhibits good adaptability. Compared with the MSEWMA chart with
  , it yields lower ARL values in the shift with
  , exhibiting faster detection capability. Its overall performance for
  is comparable to that of the MSEWMA chart with
  . Furthermore, the MSCUSUM chart presents smaller SDRL values across most shift sizes, indicating a more concentrated run-length distribution and higher detection stability.Further examining the high-dimensional scenario in Table 4, the detection performance of the MSCUSUM chart is overall superior to that of the MSEWMA chart with
  and comparable to that of the MSEWMA chart with
  , with better performance observed at certain shift sizes under scenario (I). In Scenario (II), the MSCUSUM chart maintains faster detection of small shifts
  than the MSEWMA charts. Furthermore, the MSCUSUM chart consistently yields lower SDRL values, indicating a more concentrated run-length distribution and higher detection stability. In summary, the MSCUSUM chart exhibits good adaptability in monitoring multivariate normal processes across different dimensions and shift scenarios, and its lower SDRL values ensure more stable monitoring performance.
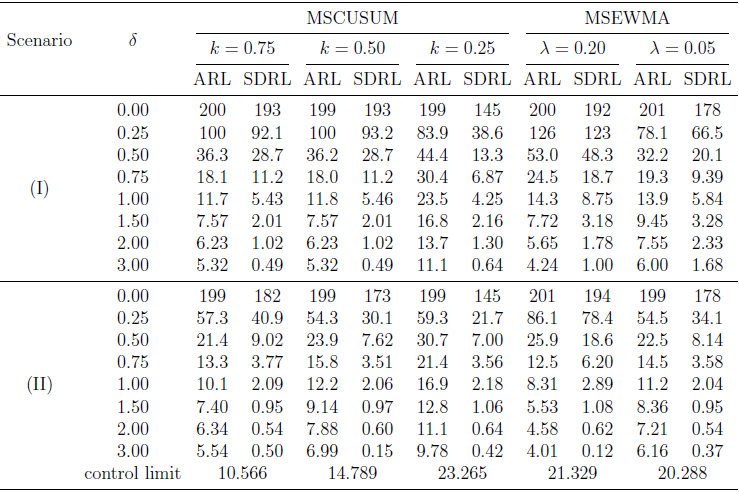 | Table 4. OC ARL and SDRL values with multinormal distributions (p = 10) |
3.2. Comparison Under the Non-Normality Assumption
In the previous subsection, all simulated data were generated from the multivariate normal distribution. However, the normality assumption is often violated in numerous practical applications. Accordingly, this subsection investigates the performance of the proposed method under non-normal conditions. Two typical non-normal distributions are adopted herein: the multivariate t-distribution with 5 degrees of freedom and the multivariate Gamma distribution with a scale parameter of 2. The former is characterized by heavy tails, while the latter presents obvious skewness. The generation method of random observations from the multivariate Gamma distribution can be referred to [21]. All other experimental settings remain consistent with those in Section 3.1.Table 5 and Table 6 present the OC ARL results under the multivariate t-distribution for  and
and  , respectively. In Table 5, for small shifts with
  under Scenario (I), the OC ARL values of the MSCUSUM chart with different are almost consistently lower than those of the MSEWMA chart. Taking
  as an example, the corresponding ARL values of the MSCUSUM chart are 25.4, 22.5, and 23.9, while the corresponding ARL values of the MSEWMA chart are 38.7 and 28.1. For moderate shifts with
  , the MSCUSUM charts with
  and
and  achieve nearly the same performance as the MSEWMA chart with
  , and both evidently outperform the MSEWMA chart with
  . In Scenario (II), the performance of the MSCUSUM chart with
  and
and  is overall comparable to that of the optimal MSEWMA chart with
  .
. | Table 5. OC ARL values under the multivariate t distribution of  |
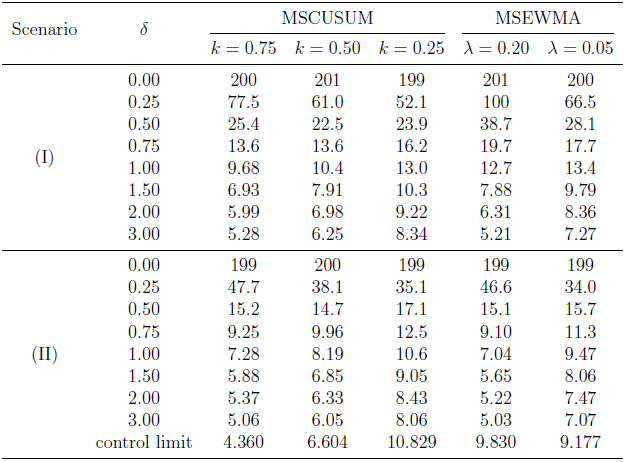
In Table 6 under Scenario (I), the MSCUSUM chart with  and
and  also maintains excellent detection performance for small shifts with
  . For instance, when
  , the MSCUSUM chart with
  yields an ARL of 29.0, which is substantially lower than that of the MSEWMA chart. This demonstrates its strong adaptability to heavy-tailed data. For moderate shifts with
  , the MSCUSUM chart with
  achieves the best monitoring performance, and its effectiveness does not deteriorate as the dimension increases. In Scenario (II), the performance of the MSCUSUM chart is consistent with the conclusions in Table 5 for
  . Overall, the proposed MSCUSUM chart outperforms the MSEWMA chart under the multivariate t-distribution. It is worth noting that such superiority is not obvious under the multivariate normal distribution, which further illustrates the favorable applicability of the MSCUSUM chart for heavy-tailed data.
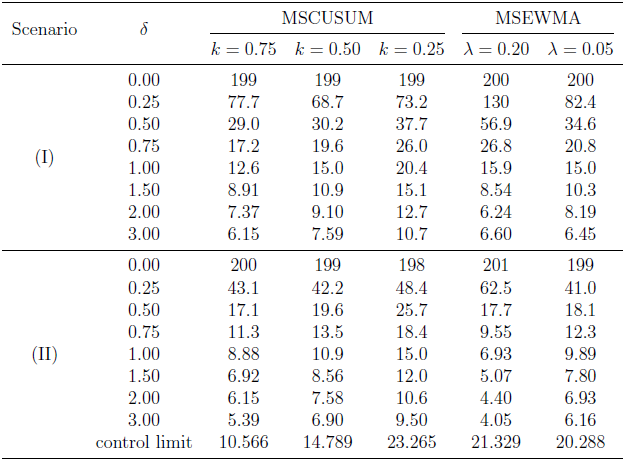 | Table 6. OC ARL values under the multivariate t distribution of 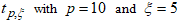 |
To intuitively observe the changing trend of the ARL values, we compare the results of the MSCUSUM chart with k = 0.75, 0.50 and the MSEWMA chart with λ = 0.05. Figure 1 plot the ln(ARL) curves under Scenario (I) and Scenario (II), where panels (a)-(b) correspond to p = 3 and p = 10 in Scenario (I), and panels (c)C(d) correspond to p = 3 and p = 10 in Scenario (II), respectively. For p = 3, the ln(ARL) values of both MSCUSUM charts are consistently lower than those of the MSEWMA chart across the entire range of δ, indicating faster detection of process shifts. For p = 10, the MSCUSUM chart with k = 0.75 significantly outperforms the MSEWMA chart at all shifts sizes. In contrast, the MSCUSUM chart with k = 0.50 is slightly worse than that of the MSEWMA chart at moderate shifts.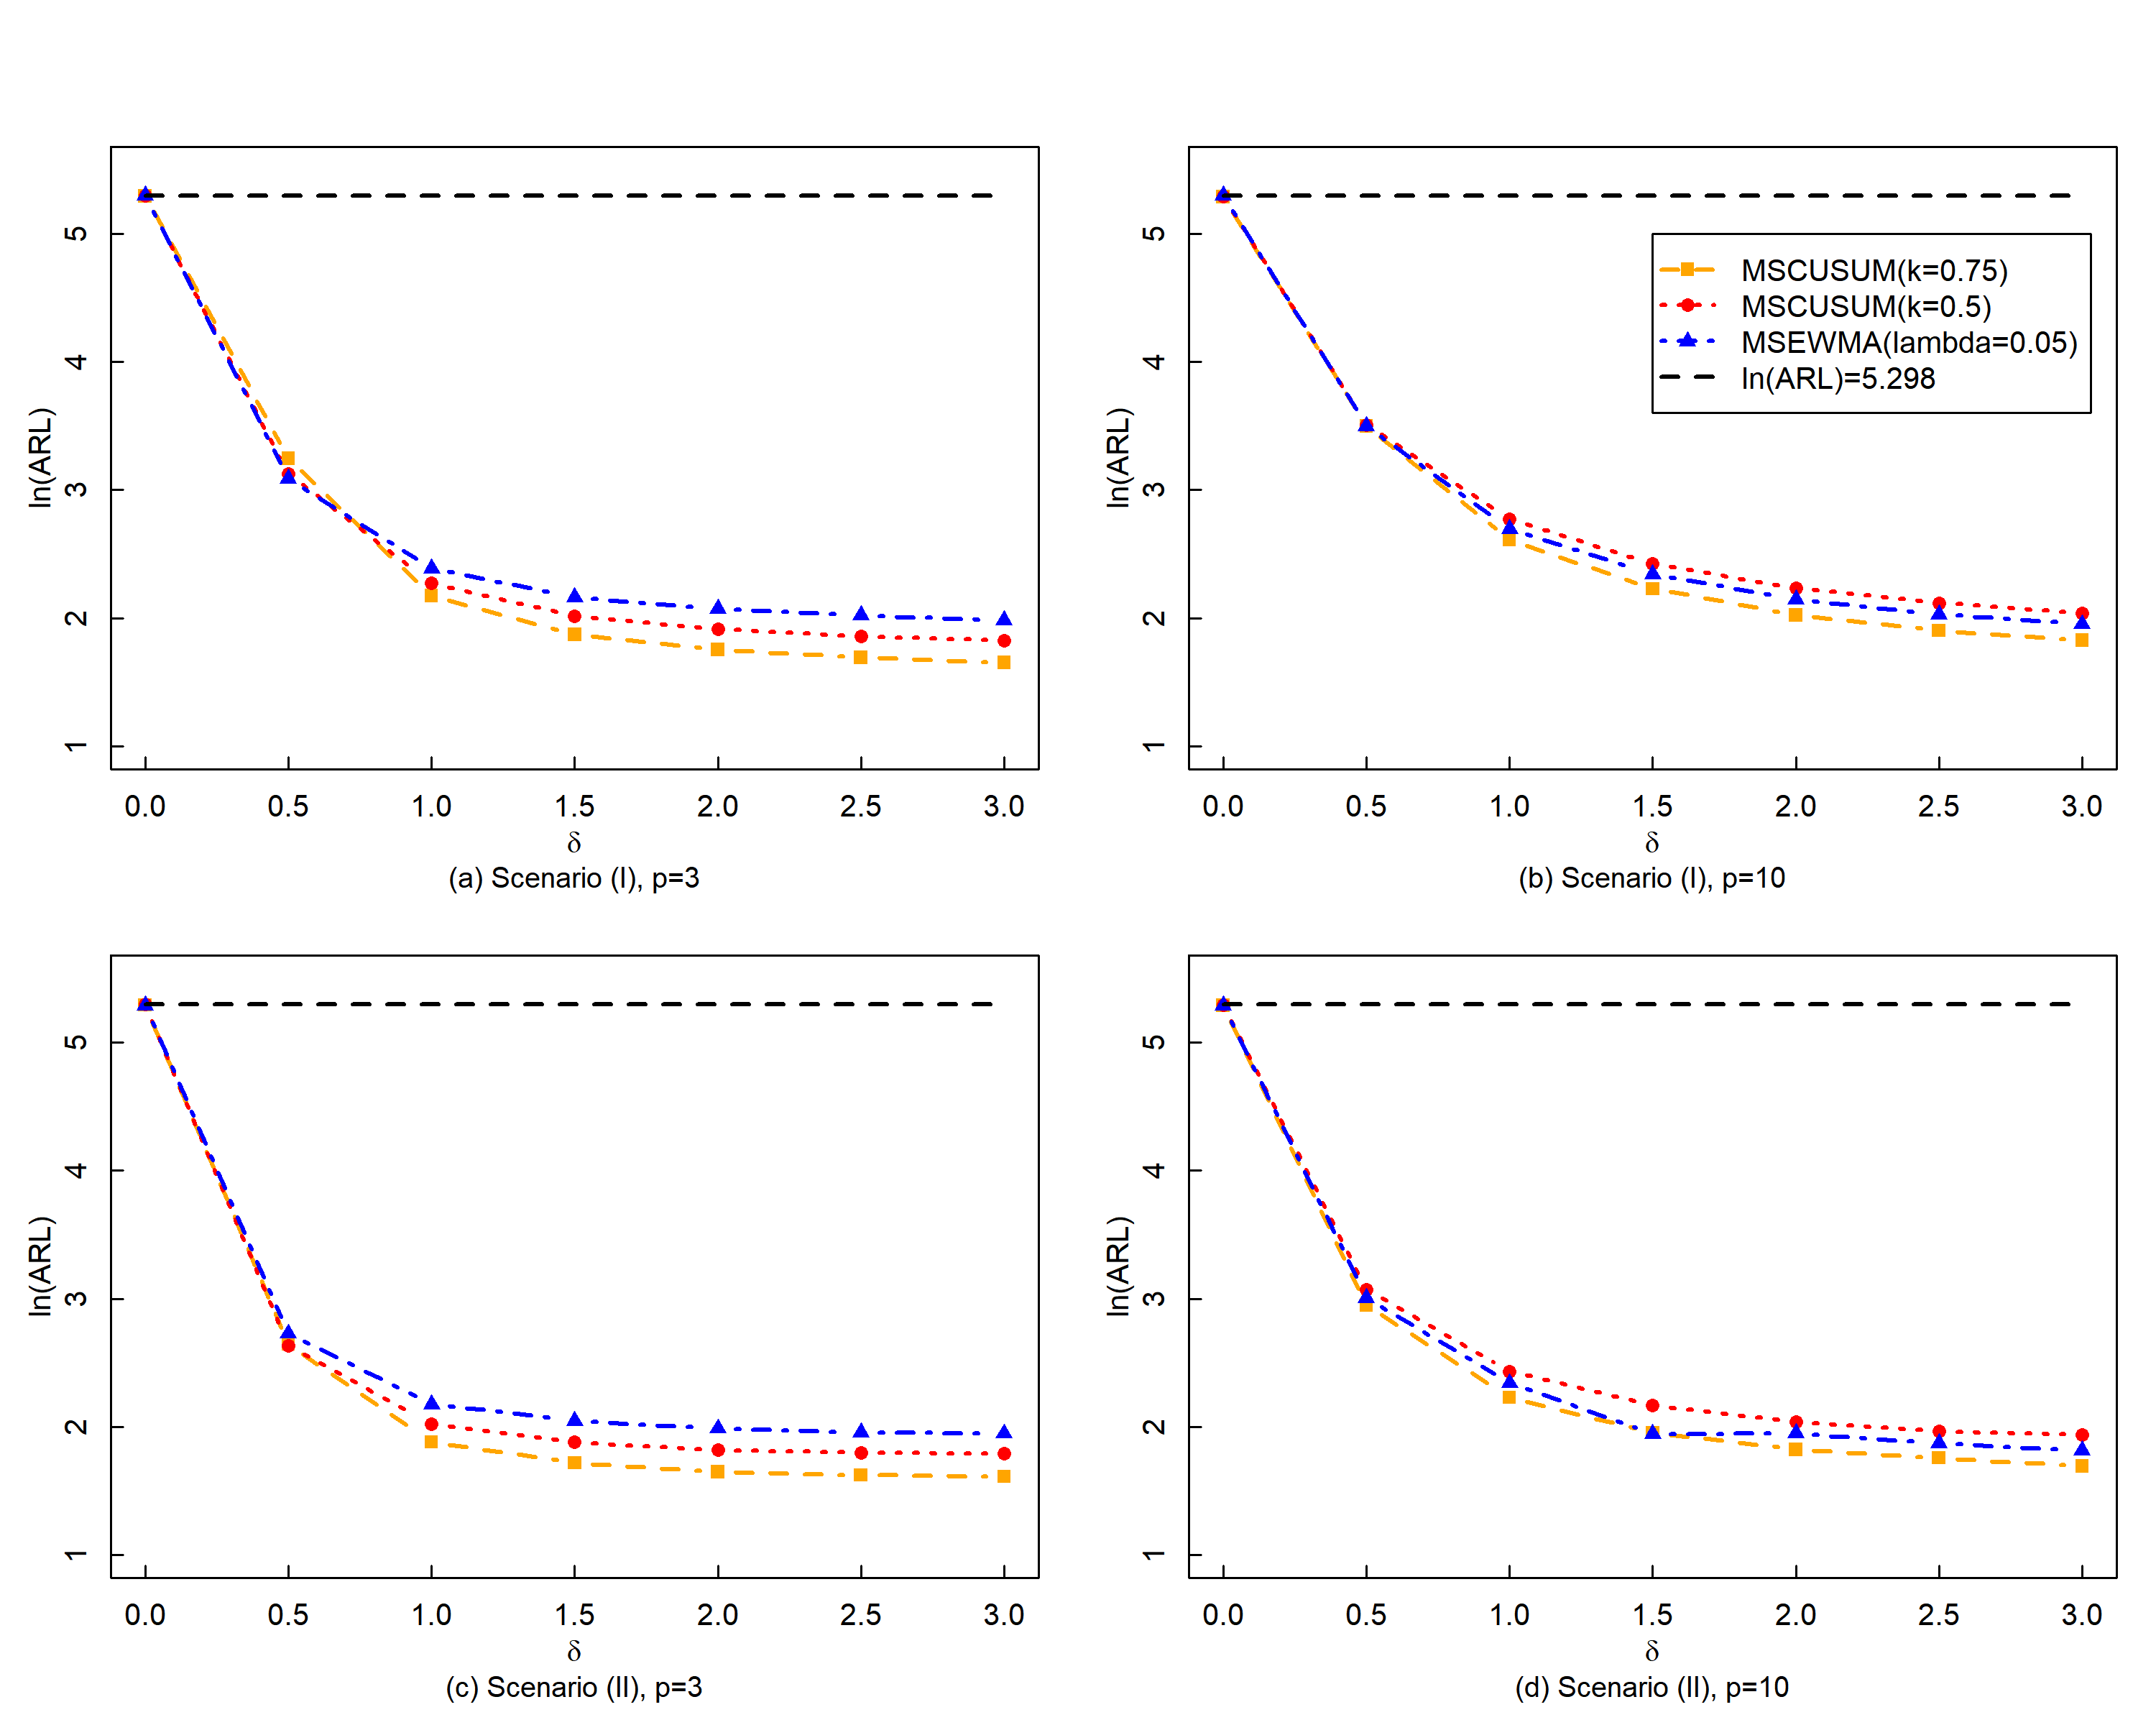 | Figure 1. OC ARL comparison of the MSCUSUM and MSEWMA charts under  |
Table 7 presents the IC ARL results for the multivariate Gamma distribution under p = 3 and p = 10. For p = 3, the IC ARL values of the MSCUSUM chart can remain steadily around the target value of 200 with minor fluctuations. When the shape parameter ξ = 1, 2, 3, the MSCUSUM chart achieves considerably better monitoring performance than the MSEWMA chart. Taking ξ = 1 as an example, the IC ARL values of the MSCUSUM chart are 194, 199, 199 and 199, while those of the MSEWMA chart are 187, 190 and 191. The ARL values of MSCUSUM are closer to the target level, reflecting superior in-control stability. As the shape parameter ξ increases, the performance of the MSCUSUM and MSEWMA charts gradually converges, with both remaining stable near 200. In particular, the MSCUSUM chart with k = 0.50 consistently yields ARL values close to 200 and exhibits the smallest fluctuations across different shape parameters, thereby demonstrating remarkable robustness. For p = 10, the performance of the MSCUSUM chart is consistent with that for p = 3, indicating that the proposed method maintains satisfactory in-control performance even under high-dimensional skewed distributions. Overall, the MSCUSUM chart delivers outstanding monitoring performance for skewed distributions. Its detection advantage is particularly prominent when the shape parameter is small. Meanwhile, the proposed control chart exhibits desirable robustness across different dimensional settings and shape parameters. | Table 7. IC ARL values with a multivariate Gamma distribution of  |
Then, we fix the shape parameter  , and the resulting OC ARL values for different dimensions are presented in Table 8 and Table 9. As shown in both tables, the MSCUSUM chart exhibits excellent monitoring performance in both shift scenarios under the skewed multivariate Gamma distribution. In Scenario (I), the MSCUSUM chart significantly outperforms the MSEWMA chart in detecting moderate shifts
  In Scenario (II), at
  , the performance of the MSCUSUM chart with
  is comparable to that of the best-performing MSEWMA chart for shifts with
  . However, as the dimension increases to
  , its performance becomes slightly inferior to that of the optimal MSEWMA chart. Overall, the MSCUSUM chart still exhibits good robustness under skewed distributions.
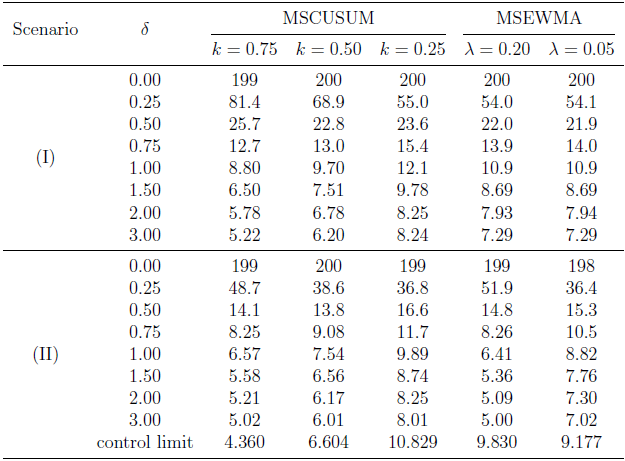 | Table 8. OC ARL values under the multivariate Gamma distribution of 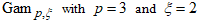 |
 | Table 9. OC ARL values under the multivariate Gamma distribution of  |
Figure 2 displays the ln(ARL) curves of the MSCUSUM chart with  and the MSEWMA chart with
  under the multivariate Gamma distribution with the shape parameter
  . Panels (a) and (b) correspond to Scenario (I) for
  and
and  , respectively, while panels (c) and (d) correspond to Scenario (II) for
  and
and  . For
. For  , in both scenarios, the ln(ARL) curves of both MSCUSUM charts are consistently lower than those of the MSEWMA chart across all
  values, indicating faster detection speeds for process shifts of varying sizes. For
  , the MSCUSUM chart with
  remains superior to the MSEWMA chart in both scenarios. The MSCUSUM chart with
  performs comparably to the MSEWMA chart for small shifts, but its ln(ARL) values become slightly higher than those of the MSEWMA chart at larger shifts (e.g.,
  ), showing a minor performance disadvantage in this range. These results are broadly consistent with the findings under the multivariate t-distribution, further verifying the robustness and applicability of the MSCUSUM chart in non-normal scenarios.
 | Figure 2. OC ARL comparison of the MSCUSUM and MSEWMA charts under  |
4. A Real Data Application
To further validate the application of the proposed MSCUSUM chart in practical industrial scenarios, this section illustrates its implementation process using a real dataset from the aluminum electrolytic capacitor manufacturing process and details the complete implementation procedure. The dataset, which describes the manufacturing process of aluminum electrolytic capacitors, includes three key quality characteristics: namely capacitance, dissipation factor and leakage current level. The dataset consists of 200 observation vectors, and partial detailed information is presented in the following Table 10.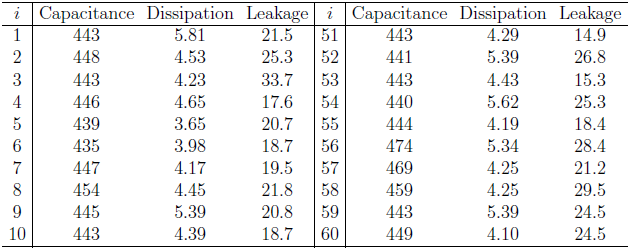 | Table 10. Partial AEC Dataset |
During the parameter estimation phase, the first 170 observation vectors are selected as the historical in-control sample to estimate the key in-control parameters θ0 and A0. To test the normality of the sample, normal Q-Q plots are drawn for capacitance, dissipation factor and leakage, and Shapiro-Wilk tests are performed accordingly. The results are presented in Figure 3 and Table 11. As illustrated in Figure 3, the data points of the three variables deviate obviously from the diagonal line of the Q-Q plots. Combined with the Shapiro-Wilk test results in Table 11, it is concluded that the dataset violates the normality assumption, which provides a prerequisite for the applicability of the proposed method.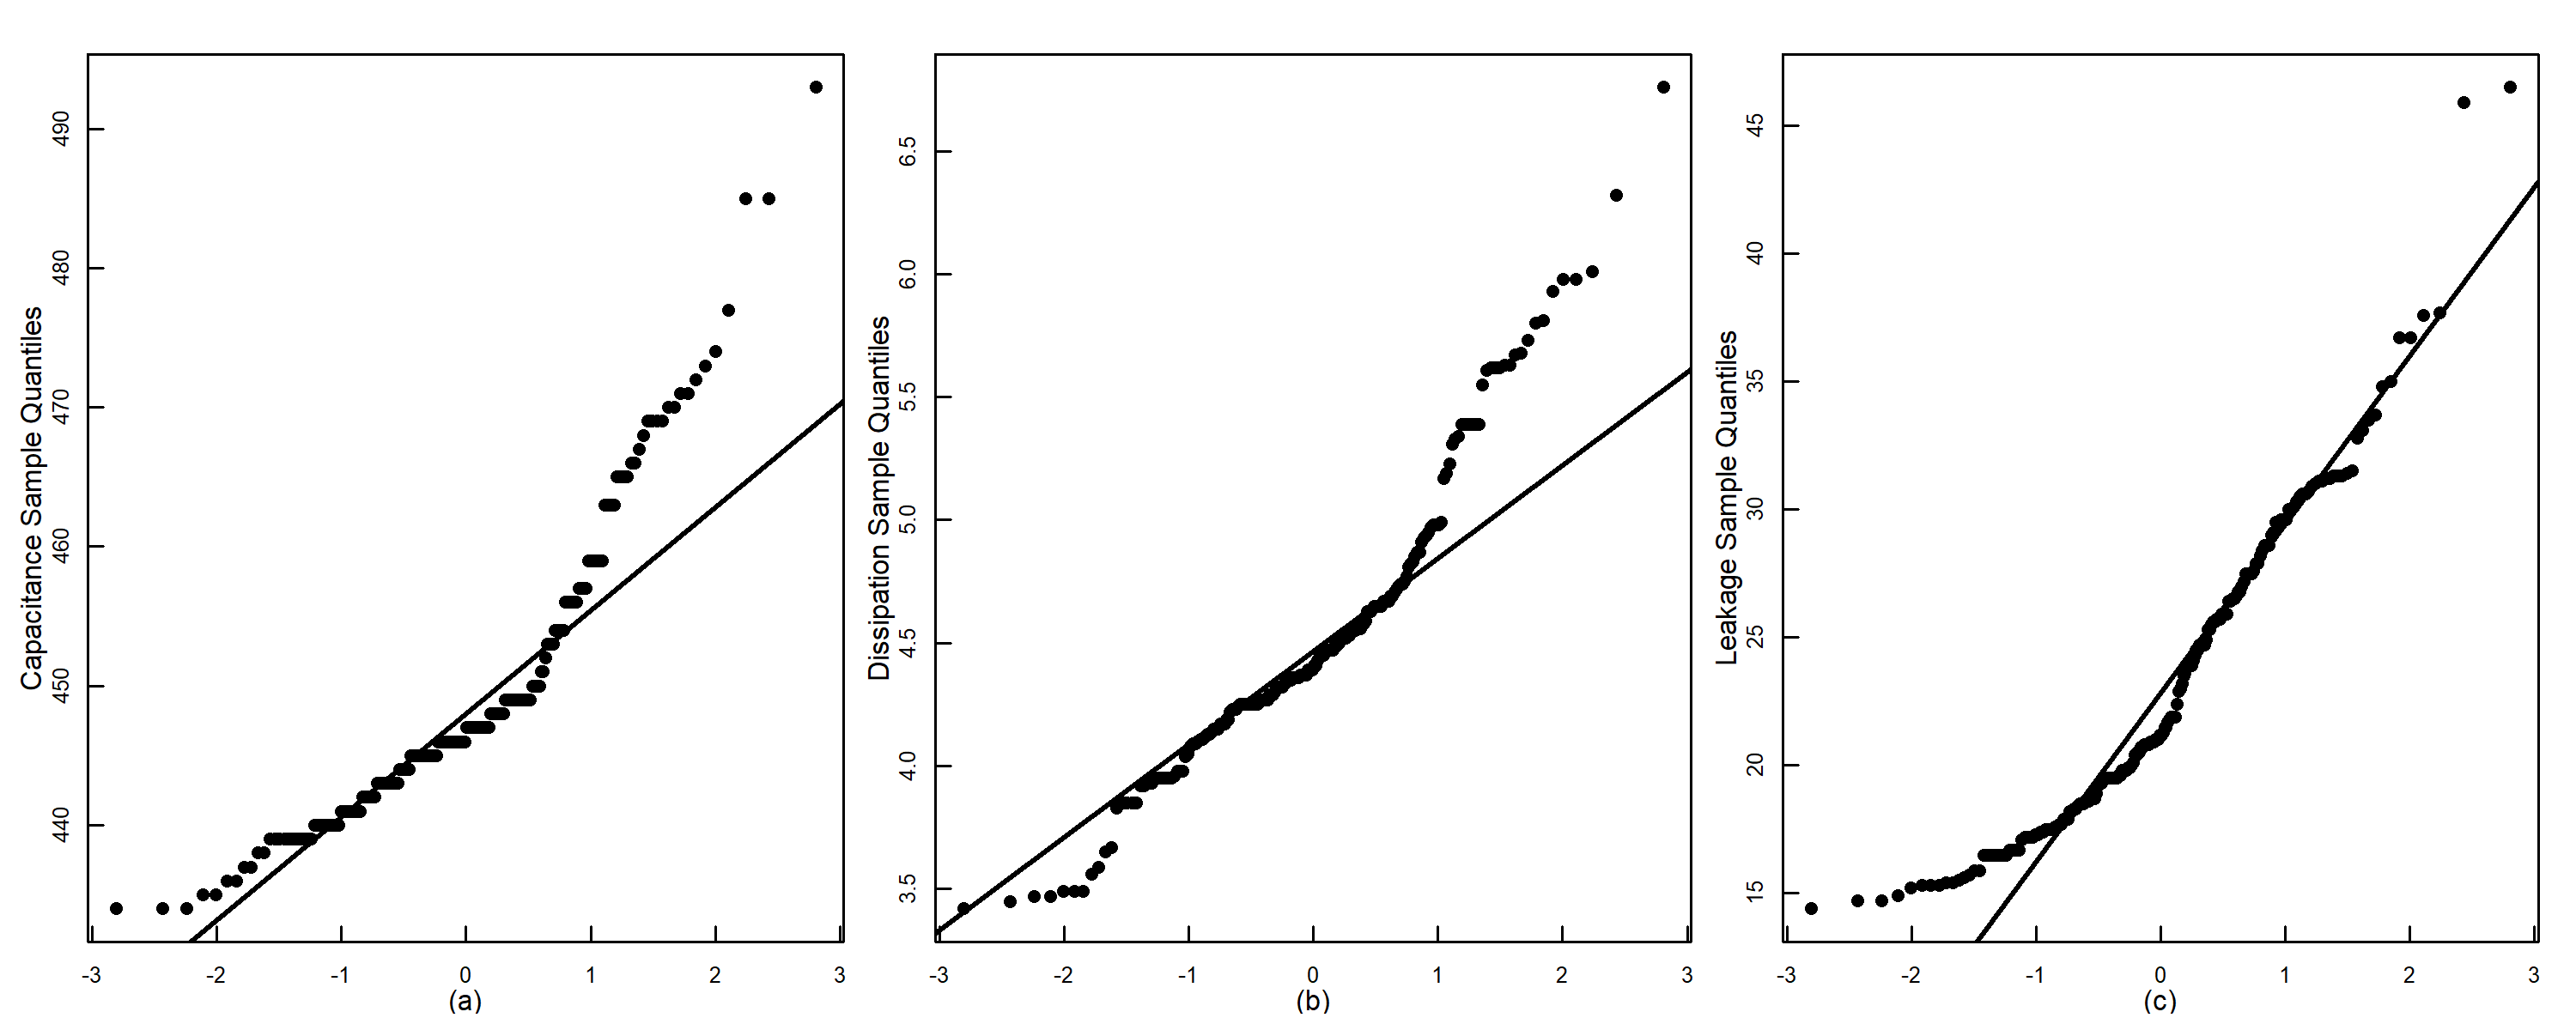 | Figure 3. Normal Q-Q Plots of the AEC Dataset |
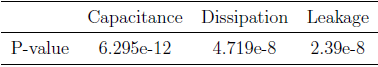 | Table 11. Shapiro Wilk Test Results |
After estimating the in-control parameters θ0 and A0 using the in-control data, we fix the in-control average run length at 200 and set the reference value to k = 0.50. Consequently, the upper control limit (UCL) in this section is determined as 6.604, with detailed control limit information listed in Table 1.Figure 4 illustrates the variation trends of the monitoring statistics for the MSCUSUM and MSEWMA charts, respectively, to judge whether the practical process remains in a stable in- control state. As observed from the two figures, both control charts trigger an out-of-control signal at the 187th observation, demonstrating that the MSCUSUM control chart is compa- rable to the MSEWMA chart in terms of out-of-control detection timeliness. In conclusion, the proposed MSCUSUM chart possesses competitive monitoring performance and can serve as a reliable and desirable alternative to the MSEWMA control chart for practical process monitoring.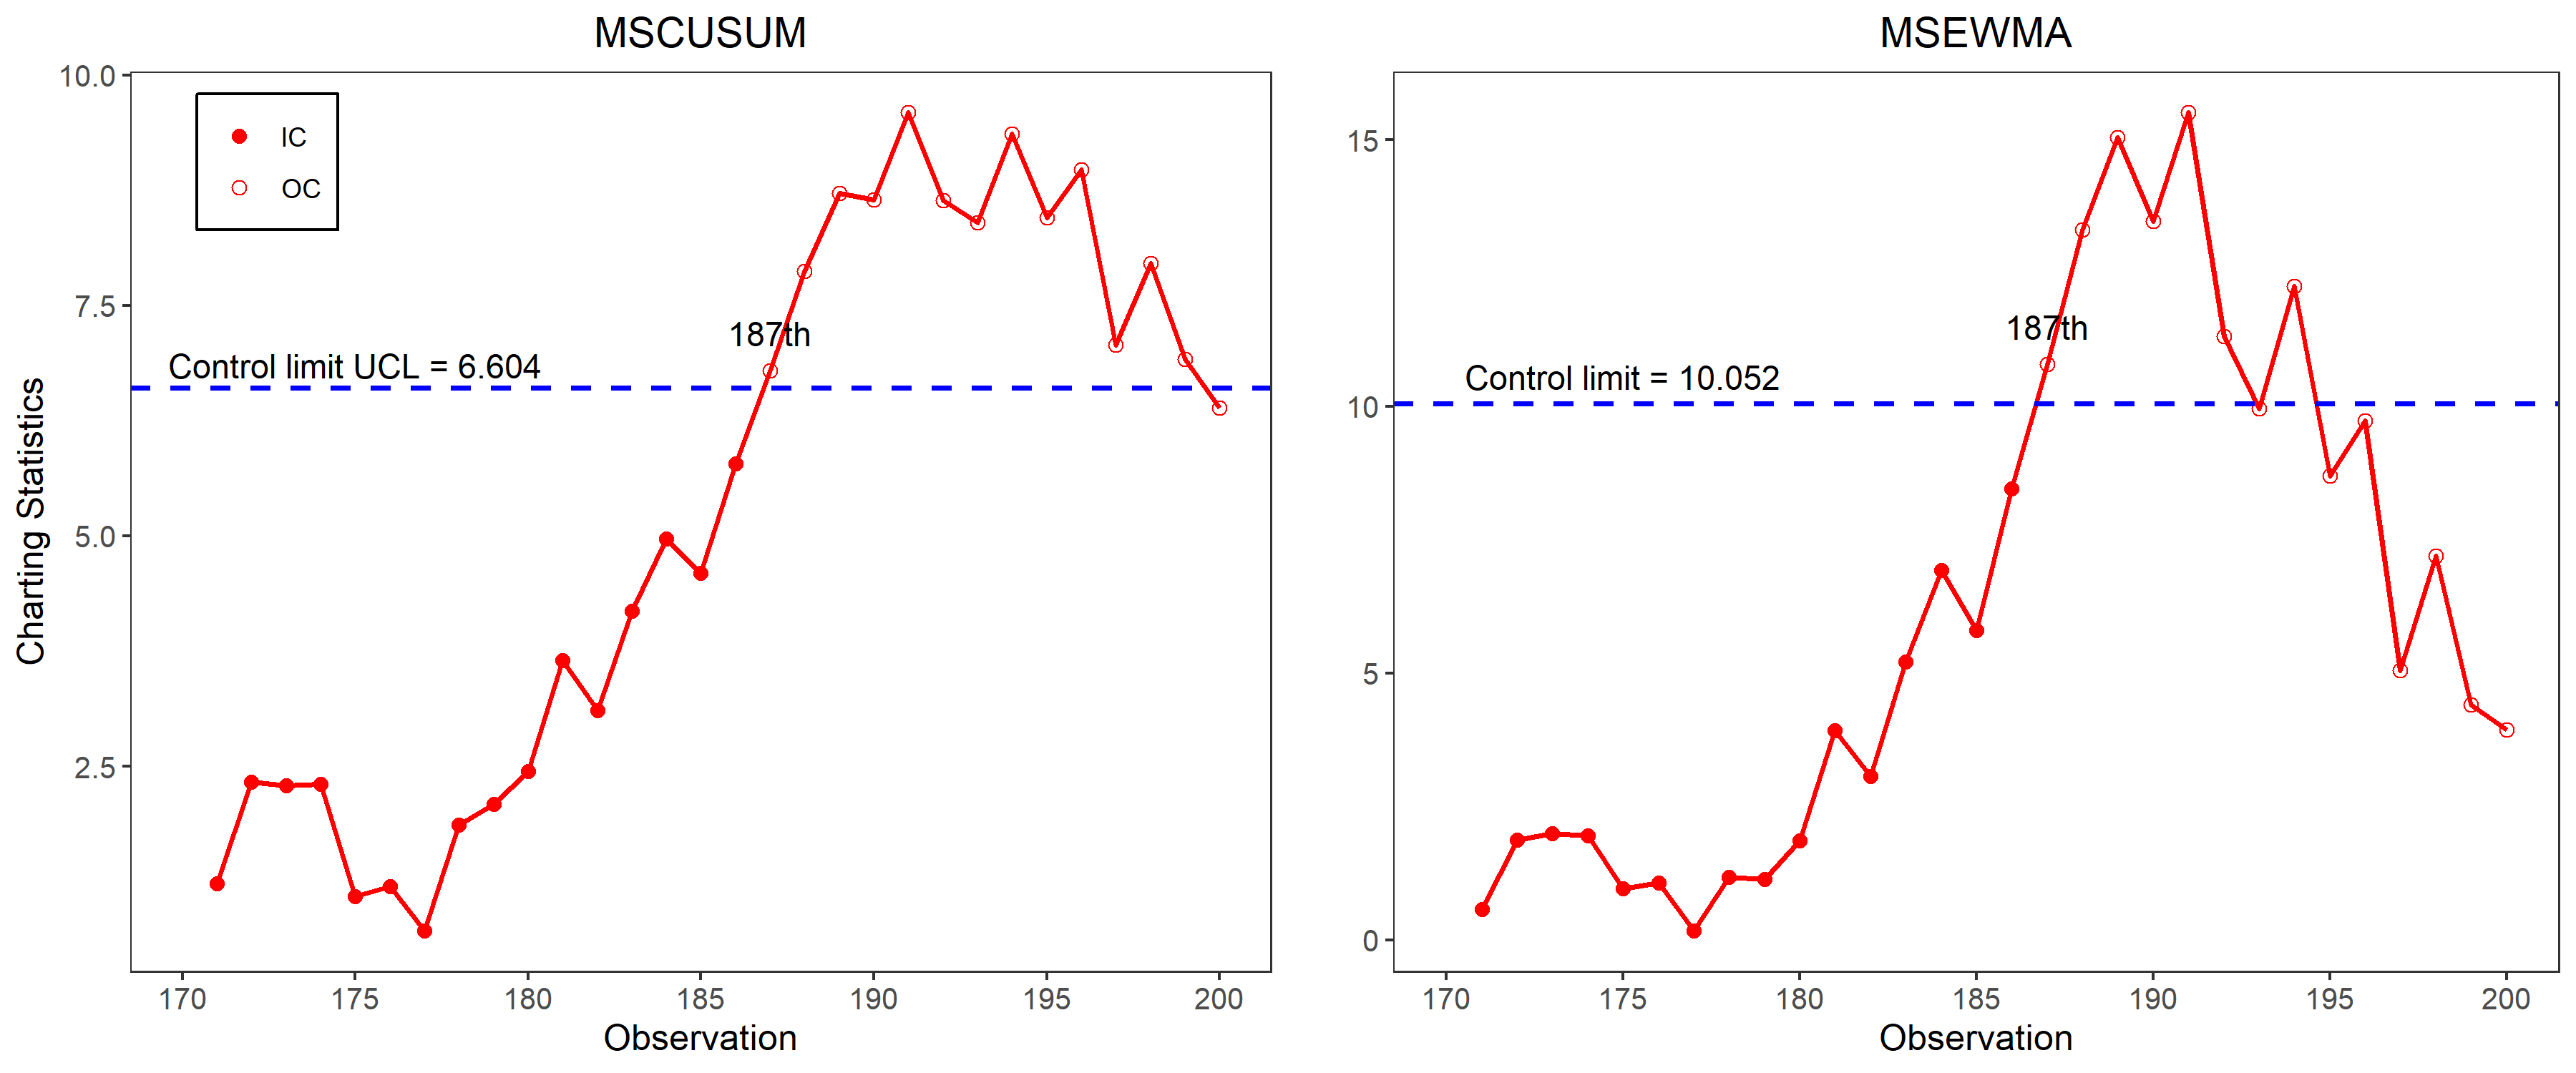 | Figure 4. MSCUSUM and MSEWMA Charts for Monitoring the Aluminum Electrolytic Ca- pacitor Manufacturing Process |
5. Conclusions
In this paper, we develops a novel robust multivariate sign-based CUSUM chart (abbreviated as the MSCUSUM chart) for monitoring location shifts in multivariate processes. By transforming the observation vectors to follow a uniform distribution on the unit p-dimensional sphere, the proposed method is particularly suitable for non-normal data from the elliptical distribution family. Simulation studies show that the MSCUSUM chart outperforms the MSEWMA chart in detecting small to moderate shifts under Scenario (I) with single-component shift for non-normal processes, especially when the dimension is p = 3. Under Scenario (II) with multicomponent simultaneous shifts, the MSEWMA chart is more efficient in detecting moderate shifts. Overall, the MSCUSUM chart with k = 0.75 achieves competitive performance for moderate shifts. Real-world applications further confirm that the MSCUSUM chart can serve as a reliable and desirable alternative to the MSEWMA chart for real-time non-normal process monitoring.In summary, the MSCUSUM monitoring framework provides a flexible, efficient and robust solution for non-normal multivariate process monitoring. Nevertheless, this study mainly focuses on the monitoring and detection of location parameter shifts, while leaving aside complex scenarios involving scale parameter shifts and simultaneous shifts in both location and scale parameters. Moreover, fault diagnosis under complicated operating conditions remains a challenging issue. The above limitations highlight the necessity of further research on multivariate statistical process control, so as to explore more effective monitoring strategies and technical approaches.
ACKNOWLEDGEMENTS
The work was supported by the Guangxi Natural Science Foundation Program (2021GXNSF- BA220013), the Doctoral Research Foundation of Guilin University of Technology, China (GUTQDJJ2020119).
References
| [1] | H Hotelling. Multivariate quality control illustrated by air testing of sample bombsights. Techniques of statistical analysis, page 111, 1947. |
| [2] | William H Woodall and Matoteng M Ncube. Multivariate cusum quality-control procedures. Technometrics, 27(3): 285–292, 1985. |
| [3] | Nola D Tracy, John C Young, and Robert L Mason. Multivariate control charts for individual observations. Journal of quality technology, 24(2): 88–95, 1992. |
| [4] | John D. Healy. A note on multivariate cusum procedures. Technometrics, 29(4): 409–412, 1987. |
| [5] | Crosier and B. Ronald. Multivariate generalizations of cumulative sum quality-control schemes. Technometrics, 30(3): 291–303, 1988. |
| [6] | Douglas M Hawkins. Multivariate quality control based on regression-adiusted variables. Technometrics, 33(1):61–75, 1991. |
| [7] | Cynthia A. Lowry, William H. Woodall, and Champ Steven E. Rigdon. A multivariate exponentially weighted moving average control chart. Technometrics, 34(1): 46–53, 1992. |
| [8] | Peihua Qiu and Douglas Hawkins. A rank-based multivariate cusum procedure. Technometrics, 43(2): 120–132, 2001. |
| [9] | Ruixiang Sun and Fugee Tsung. A kernel-distance-based multivariate control chart using support vector methods. International Journal of Production Research, 41(13): 2975–2989, 2003. |
| [10] | Regina Y. Liu. Control charts for multivariate processes. Journal of the American Statistical Association, 90(432): 1380–1387, 1995. |
| [11] | Regina Y. Liu, Kesar Singh, and Julie H. Teng. Ddma-charts: Nonparametric multivariate moving average control charts based on data depth. Allgemeines Statistisches Archiv, 88(2): 235–258, 2004. |
| [12] | Regina Y Liu and Kesar Singh. A quality index based on data depth and multivariate rank tests. Journal of the American Statistical Association, 88(421): 252–260, 1993. |
| [13] | Raid W. Amin, Marion R. Reynolds, and Bakir Saad. Nonparametric quality control charts based on the sign statistic. Communications in Statistics, 24(6): 1597–1623, 1995. |
| [14] | Poovich Phaladiganon, Seoung Bum Kim, Victoria CP Chen, Jun-Geol Baek, and Sun-Kyoung Park. Bootstrap-based t2 multivariate control charts. Communications in Statistics Simulation and Computation®, 40(5): 645–662, 2011. |
| [15] | Changliang Zou, Zhaojun Wang, and Fugee Tsung. A spatial rank-based multivariate ewma control chart. Naval Research Logistics (NRL), 59(2): 91–110, 2012. |
| [16] | Ronald H Randles. A distribution-free multivariate sign test based on interdirections. Journal of the American Statistical Association, 84(408): 1045–1050, 1989. |
| [17] | Biman Chakraborty, Probal Chaudhuri, and Hannu Oja. Operating transformation retransformation on spatial median and angle test. Statistica Sinica, 8(3): 767–784, 1998. |
| [18] | Ronald H. Randles. A simpler, affine-invariant, multivariate, distribution-free sign test. Publications of the American Statistical Association, 95(452): 1263–1268, 2000. |
| [19] | Changliang Zou and Fugee Tsung. A multivariate sign ewma control chart. Technometrics, 53(1): 84–97, 2011. |
| [20] | Thomas P. Hettmansperger. A practical affine equivariant multivariate median. Biometrika, 89(4): 851–860, 2002. |
| [21] | Zachary G. Stoumbos and Joe H. Sullivan. Robustness to non-normality of the multivariate ewma control chart. Journal of Quality Technology, 34(3): 260–276, 2002. |

 Abstract
 Reference
 Full-Text PDF
 Full-text HTML