-
Paper Information
- Paper Submission
-
Journal Information
- About This Journal
- Editorial Board
- Current Issue
- Archive
- Author Guidelines
- Contact Us
International Journal of Statistics and Applications
p-ISSN: 2168-5193 e-ISSN: 2168-5215
2025; 15(2): 29-39
doi:10.5923/j.statistics.20251502.01
Received: Nov. 19, 2025; Accepted: Dec. 10, 2025; Published: Dec. 13, 2025

Geographical Inequalities in Teenage Pregnancy in Nigeria: Evidence from the Nigeria Demographic and Health Survey
 Abstract
 Reference
 Full-Text PDF
 Full-text HTML
Loveday Acheseinimie Acheseinimie1, Essi Isaac Didi1, Oluchi Mildred Ndudim2, Anthony Ike Wegbom2, Salome Amarachi Ike-Wegbom2
1Department of Mathematics, Rivers State University, Port Harcourt, Port Harcourt, Nigeria
2Department of Public Health Sciences, College of Medical Sciences, Rivers State University, Port Harcourt, Nigeria
Correspondence to: Anthony Ike Wegbom, Department of Public Health Sciences, College of Medical Sciences, Rivers State University, Port Harcourt, Nigeria.
| Email: |  |
Copyright © 2025 The Author(s). Published by Scientific & Academic Publishing.
This work is licensed under the Creative Commons Attribution International License (CC BY).
http://creativecommons.org/licenses/by/4.0/

Teenage pregnancy remains a major public health and socio-economic challenge in Nigeria, with persistent inequalities across socio-demographic groups and regions. This study assessed the prevalence, socioeconomic distribution, and determinants of teenage pregnancy between 2013 and 2018, focusing on rural–urban and regional disparities. The study employed a cross-sectional analytical design using nationally representative data from the 2013 and 2018 Nigeria Demographic Health Survey. The study population comprised adolescent girls aged 15–19 years. Data from 16,328 female adolescents aged 15–19 years were drawn from the 2013 and 2018 NDHS. The Erreygers normalized concentration index (ECI) and concentration curves were used to quantify and visualize the magnitude of geographical inequality in teenage pregnancy. Decomposition analysis following Wagstaff et al. (2003) and Erreygers (2009) was conducted to identify factors contributing to the observed inequalities. All analyses were weighted using NDHS sampling weights to ensure national representativeness. The findings showed a consistent pro-poor concentration of teenage pregnancy across both survey years, with higher prevalence among adolescents in poorer households and rural areas. Geographical analysis showed pronounced regional disparities, with the North-West and North-East regions recording the highest rates of teenage pregnancy, while the South-West exhibited the lowest. Decomposition results indicated that educational attainment, household wealth, and marital status were the dominant contributors to the observed geographical and socioeconomic inequalities. Although the magnitude of inequality slightly declined between 2013 and 2018, disparities remained substantial. The study highlights persistent geographical and socioeconomic inequalities in teenage pregnancy in Nigeria, predominantly disadvantaging adolescents in poor and rural communities. Targeted interventions aimed at improving girls’ education, economic empowerment, and access to adolescent-friendly reproductive health services are essential to reduce these disparities and achieve equitable reproductive health outcomes across regions.
Keywords: Teenage Pregnancy, Geographical Inequalities, Reproductive Health, Decomposition analysis, Contraceptive use
Cite this paper: Loveday Acheseinimie Acheseinimie, Essi Isaac Didi, Oluchi Mildred Ndudim, Anthony Ike Wegbom, Salome Amarachi Ike-Wegbom, Geographical Inequalities in Teenage Pregnancy in Nigeria: Evidence from the Nigeria Demographic and Health Survey, International Journal of Statistics and Applications, Vol. 15 No. 2, 2025, pp. 29-39. doi: 10.5923/j.statistics.20251502.01.
Article Outline
1. Introduction
- Teenage pregnancy, defined as pregnancy among girls aged 15–19 years, remains a significant global public health and socio-economic concern. Each year, approximately 21 million girls in developing regions become pregnant, with 16 million giving birth [1,2]. These pregnancies contribute substantially to maternal and child morbidity and mortality, with complications of pregnancy and childbirth remaining the leading cause of death among adolescent girls worldwide [3,4]. Beyond health risks, teenage pregnancy often leads to school dropout, limited economic opportunities, and intergenerational cycles of poverty, thereby hindering global progress toward the Sustainable Development Goals (SDGs) [5,6].In sub-Saharan Africa, teenage pregnancy is particularly prevalent, accounting for nearly half of adolescent births worldwide [7,8]. The high rates in this region are linked to entrenched poverty, gender inequality, early marriage, and limited access to reproductive health services [9]. In many communities, adolescent fertility is normalized, reflecting cultural expectations around marriage and childbearing. This regional burden has wide-ranging implications for human capital development and socio-economic growth [10,11].Nigeria, the most populous country in Africa, exemplifies the challenges posed by adolescent fertility. According to the 2018 Nigeria Demographic and Health Survey (NDHS), 19% of adolescent girls aged 15–19 years had begun childbearing, 14% had given birth, and 4% were pregnant with their first child [12]. However, this national average conceals stark geographical inequalities. In the North West, nearly one-third (29%) of adolescents had begun childbearing, compared with only 6% in the South West [13,14]. Similarly, rural adolescents (27%) were almost three times more likely to have begun childbearing than their urban counterparts (10%). These disparities demonstrate the strong influence of geography, region, and place of residence on adolescent fertility patterns in Nigeria [15,16].The implications of these inequalities are far-reaching. Teenage mothers in high-prevalence regions, particularly in rural and northern Nigeria, face greater barriers to healthcare, education, and economic opportunities. Their children are also at higher risk of neonatal mortality, malnutrition, and poor educational outcomes [17,18]. Persistent geographical disparities in adolescent fertility not only undermine health equity but also slow Nigeria’s progress toward SDGs 3 (health), 4 (education), and 5 (gender equality) [19,20]. Despite various government and non-governmental interventions, including efforts to expand contraceptive access and promote girls’ education [21,22], teenage pregnancy rates remain high, with inequalities largely unchanged [2]. While previous studies have highlighted the overall prevalence of teenage pregnancy, fewer have systematically examined its geographical dimensions using nationally representative datasets. Therefore, this study assessed geographical inequalities in teenage pregnancy in Nigeria using evidence from the Nigeria Demographic and Health Survey to understand how teenage pregnancy varies across regions and between rural and urban populations, which is critical for designing targeted, context-specific interventions.This conceptual framework illustrates how socioeconomic and regional factors interact to influence teenage pregnancy in Nigeria. Grounded in the Social Determinants of Health perspective, it posits that adolescents’ reproductive outcomes are shaped by the socioeconomic conditions in which they live [1]. Socioeconomic factors, such as household income, parental education, and employment opportunities, affect access to schooling, autonomy, and reproductive health information, thereby shaping vulnerability to early pregnancy [5]. Regional factors, particularly urban–rural disparities, cultural norms, and infrastructural differences, further condition adolescents’ exposure to risk. Rural areas often experience limited access to contraception and adolescent-friendly services [12].The framework also highlights the mediating role of access to sexual and reproductive health services, education, peer influences, and policy implementation, which help explain how broader social and regional inequalities translate into adolescent fertility patterns [19]. Teenage pregnancy emerges as the final outcome of these intersecting determinants, with well-documented consequences such as school dropout, health complications, and intergenerational poverty [15]. The framework reveals that teenage pregnancy is not merely a product of individual behavior but a reflection of structural and contextual inequalities, underscoring the need for multisectoral interventions that address both socioeconomic deprivation and regional disparities.
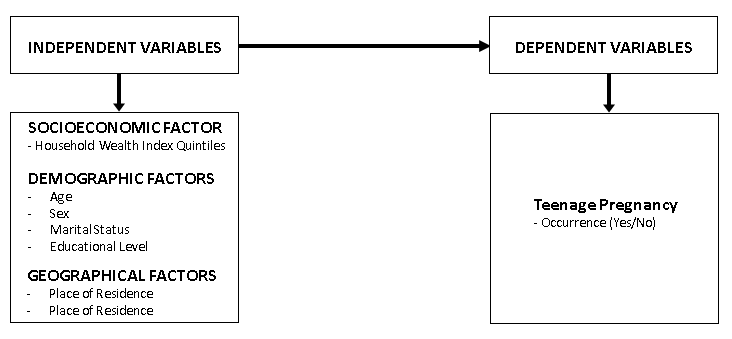 | Figure 1. Conceptual framework. Source: Author's illustration based on literature review |
2. Methods
2.1. Study Area, Data, and Data Source
- The study area is Nigeria, with an estimated population of 198 million in 2018 [23]. About 70% of the population resides in rural areas, while only about 30% live in urban areas. With 32.4% of the population below the age of 18 years and over 23% adolescents/teenagers, Nigeria has a large youth population [2]. Administratively, the country is divided into six geopolitical zones: North Central, North East, North West, South East, South West, and South South. Among these geopolitical zones in Nigeria, the southern states had the highest youth literacy rate, while the northern states had the lowest. Approximately 21.3% of youths aged 15–19 had never been to school [2]. Data for this study were obtained from the 2013 and 2018 Nigeria Demographic and Health Survey (NDHS) women recode files (IR), conducted by the National Population Commission (NPC) in collaboration with ICF. The NDHS employed a multi-stage, stratified two-stage cluster sampling design, involving the selection of enumeration areas (EAs) based on probability proportional to size, followed by systematic sampling of households within each EA. These surveys are widely recognized for their methodological rigour, national representativeness, and comparability across years. The datasets are well-suited for inequality analysis as they contain detailed information on health outcomes, socioeconomic status, and demographic characteristics.The final analytic sample comprised 16,328 adolescent girls aged 15–19 years drawn from the 2013 and 2018 NDHS datasets. The study focused on examining geographical inequalities in teenage pregnancy among this population group in Nigeria.
2.2. Study Variables
- The variables for the study are classified into two independent variables and dependent variable. The independent variables include socioeconomic factors such as household wealth index quintiles (poorest to richest), demographic factors such as age, sex, and marital status (married/cohabiting, single, widowed/divorced), educational level (none, primary, secondary, higher), and geographic factors including place of residence (urban or rural) and region. Socioeconomic ranking is derived from the household wealth index in the NDHS dataset, constructed through principal component analysis (PCA) using information on asset ownership, housing characteristics, and access to basic services. Households are ranked from poorest to richest and classified into quintiles for analysis. The dependent variable is teenage pregnancy.
2.3. Data Analysis and Statistical Technique
2.3.1. Measuring Socioeconomic Inequalities in Teenage Pregnancy
2.3.1.1. Concentration Index (CI)
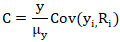
- The empirical analysis follows two main stages: measurement of inequality using the Erreygers Normalized Concentration Index (ENCI) and decomposition analysis to attribute the observed inequality to specific socioeconomic and demographic determinants. The health variable under consideration is bounded within the range [0, 1], making the ENCI the appropriate measure instead of the standard concentration index (CI). The explanatory variables include socioeconomic, demographic, and geographic characteristics theoretically and empirically relevant to health inequality analysis.Also, the computation of the standard concentration index (C) for the bounded health outcome is computed using:
 Where:
  = mean of y.
 = health outcome for individual i.
 = fractional rank of individual iii in the socioeconomic distribution.
2.3.1.2. Erreygers Normalized Concentration Index (ENCI)
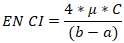
- The general formula for Erreygers (2009) proposed a normalized Concentration Index is given by:
 Where:
  is the average health variable. C is the standard concentration index. Also, a, and b are the minimum and maximum bounds of the variable (for proportions, a=0, b=1).
2.3.1.3. Decomposition of ENCI
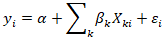
- The decomposition is based on the linear additive model:
 Where:
 is the health outcome for individual i.
 are the k explanatory variables.
 are the coefficients from regression.
 is the error term.Also, the concentration index for y (C y) can be expressed as:
 Where:
 is the mean of
 is the mean of y.
 is the concentration index for
 is the generalized concentration index of the residual.For the ENCI, the decomposition applies as:
 . The contribution of each determinant k to the ENCI is:
  The dataset was weighted using the sampling weight provided in the NDHS to obtain estimates that are representative of all teenagers in Nigeria. Data analysis was conducted using Stata version 17.0, applying appropriate statistical techniques to examine the extent and determinants of inequality in teenage pregnancy. Descriptive statistics such as frequencies and percentages were first generated to summarize the characteristics of respondents and to describe the distribution of teenage pregnancy across key socioeconomic and demographic groups.To measure and visualize inequality, concentration indices and concentration curves were computed using the conindex command in Stata. The analysis employed the Erreygers normalized concentration index to account for the binary nature of the outcome variable. Furthermore, the decomposition of the concentration index was carried out following the approaches proposed by Wagstaff et al. (2003) and Erreygers (2009).
3. Results
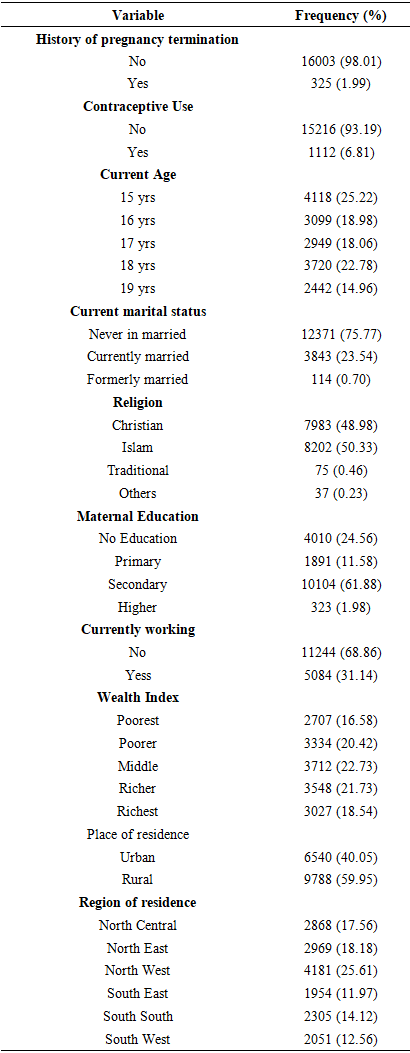
- Table 1: Distribution of Socio-Demographic Characteristics of RespondentsThe table below presents the distribution of socio-demographic characteristics of female adolescents aged 15–19 years in Nigeria, based on data obtained from the Nigeria Demographic and Health Survey (NDHS). The results show the majority of the respondents, 16,003 (98.01%), reported no history of pregnancy termination, while only 325 (1.99%) indicated that they had ever terminated a pregnancy. Concerning contraceptive use, the findings showed that the majority of respondents, 15,216 (93.19%), were not using any contraceptive method at the time of the survey, whereas only 1,112 (6.81%) reported that they were currently using a method of contraception.In terms of age distribution, the results show that 4,118 (25.22%) of the respondents were aged 15 years, 3,099 (18.98%) were aged 16 years, 2,949 (18.06%) were aged 17 years, 3,720 (22.78%) were aged 18 years, and 2,442 (14.96%) were aged 19 years. The data reveal that the largest proportion of respondents were in the lower adolescent age category, with a gradual decline in representation as age increased.The current marital status of respondents indicates that a majority, 12,371 (75.77%), had never been married, while 3,843 (23.54%) were currently married, and 114 (0.70%) were formerly married. Religion plays a significant role in Nigeria’s social context, and the data indicate that 8,202 (50.33%) of respondents identified as Muslims, while 7,983 (48.98%) identified as Christians. A smaller proportion, 75 (0.46%), practiced traditional religion, and 37 (0.23%) belonged to other religious groups. Educational attainment among respondents varied considerably. The findings show that 4,010 (24.56%) had no formal education, 1,891 (11.58%) had completed primary education, 10,104 (61.88%) had secondary education, and only 323 (1.98%) had higher education. The majority of adolescents were therefore found to have attained at least secondary-level education, although a considerable number had little or no formal schooling.In terms of employment, most respondents, 11,244 (68.86%), were not currently working, while 5,084 (31.14%) were engaged in one form of work or another. The wealth index distribution showed that 2,707 (16.58%) of respondents were in the poorest category, 3,334 (20.42%) in the poorer category, 3,712 (22.73%) in the middle, 3,548 (21.73%) in the richer, and 3,027 (18.54%) in the richest category. With respect to place of residence, 6,540 (40.05%) of the respondents lived in urban areas, while 9,788 (59.95%) resided in rural areas. Finally, the regional distribution of respondents reveals that 2,868 (17.56%) were from the North Central region, 2,969 (18.18%) from the North East, 4,181 (25.61%) from the North West, 1,954 (11.97%) from the South East, 2,305 (14.12%) from the South South, and 2,051 (12.56%) from the South West. The North West had the largest proportion of adolescent respondents, while the South East had the smallest representation. See Table 1 below.
|
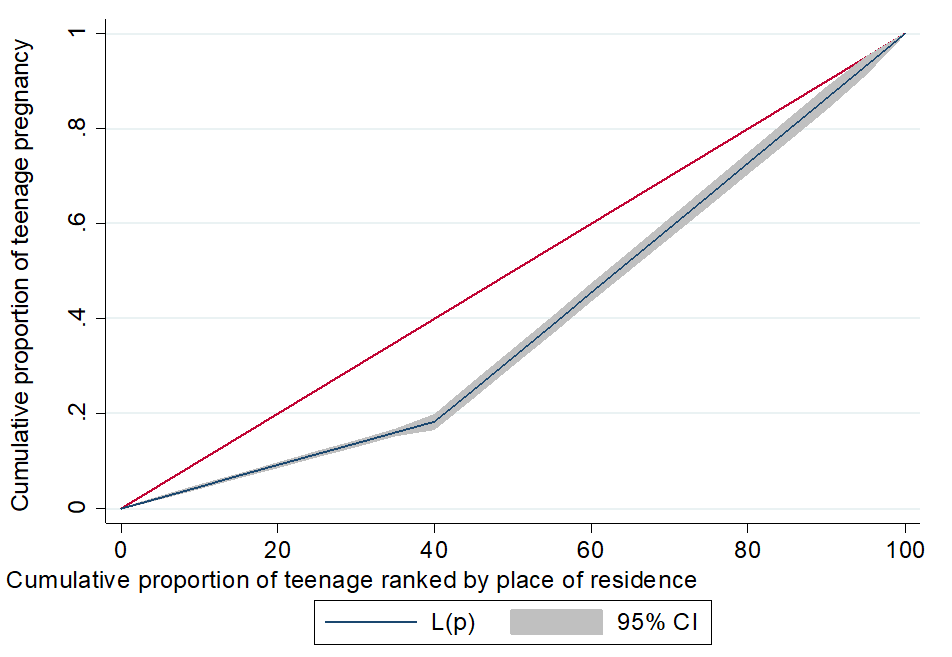 | Figure 2. Concentration curve for teenage pregnancy by place of residence |
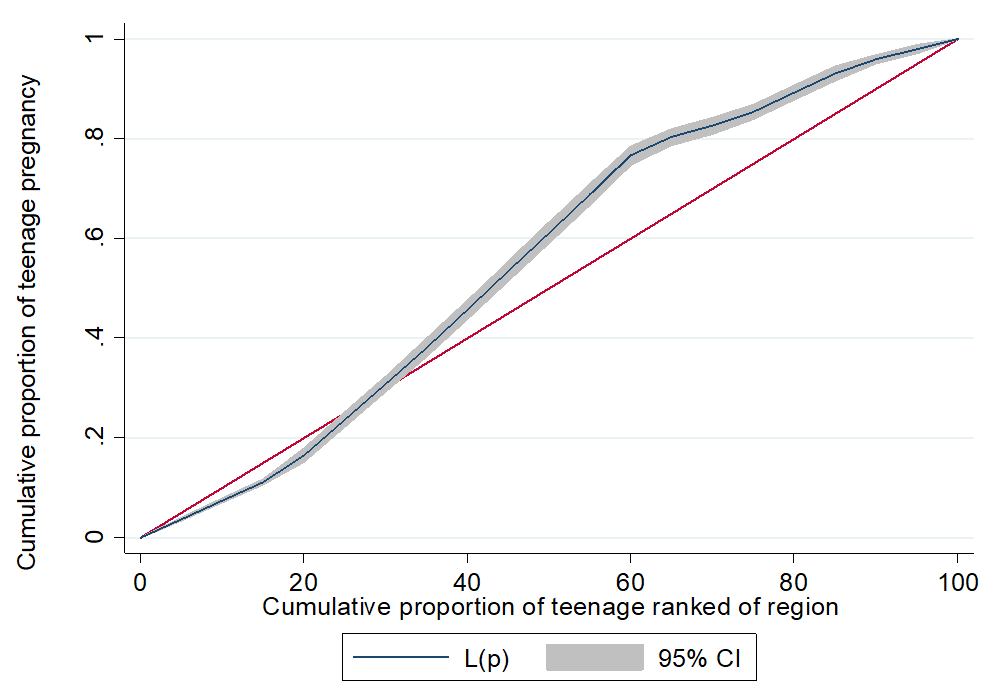 | Figure 3. Concentration curve for teenage pregnancy by region of residence |
|
|
|
|
4. Discussion
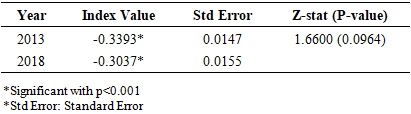
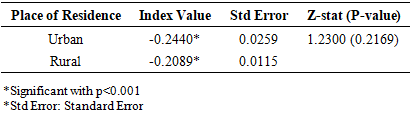
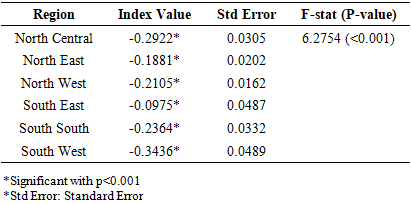
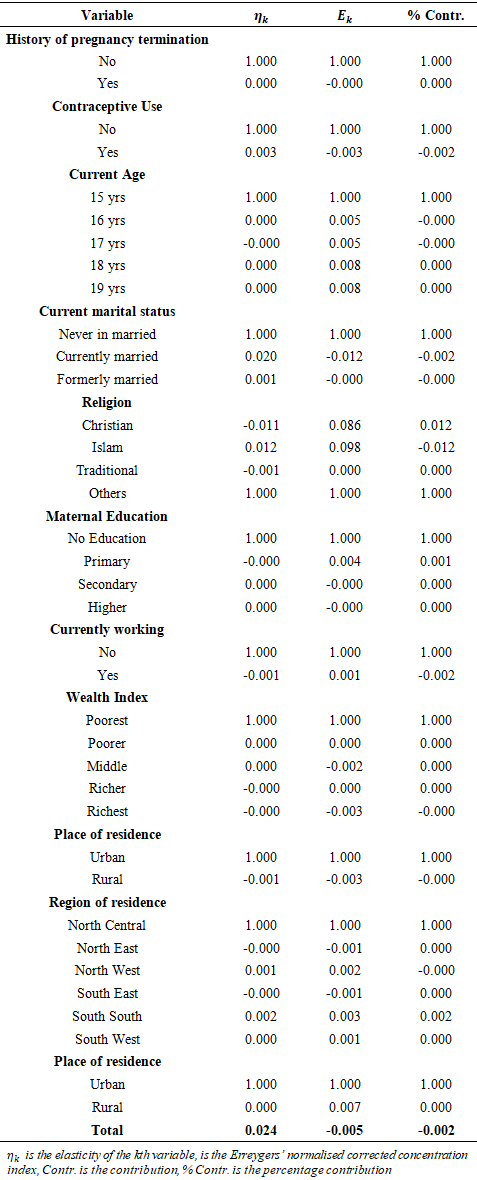
- In Figure 2, both the urban and rural curves lie below the line of equality, confirming that teenage pregnancy is more concentrated among the poorer households, irrespective of residence. However, the urban curve lies further from the line of equality compared to the rural curve, indicating greater inequality in the distribution of teenage pregnancy among urban adolescents. These spatial variations echo findings from a multilevel logistic regression analysis of NDHS data, emphasizing regional heterogeneity in adolescent pregnancy [14]. These findings are also consistent with those of Okoli et al. [2] in Nigeria and Temane et al. [24] in South Africa, who reported that teenage pregnancy is concentrated among the poorest wealth quintiles due to limited access to education and reproductive health services. Similarly, Nshutiyukuri et al. [25] confirmed that adolescents from low-income households and with little education were more likely to experience early pregnancy. Lai et al. [26] further emphasized increasing urban inequality, aligning with the current finding that urban poor adolescents face greater vulnerability. Conversely, Asmamaw et al. [5] found that teenage pregnancy was more prevalent in rural areas due to early marriage and limited educational opportunities, while Osborne et al. [27] suggested that socioeconomic inequality in adolescent fertility was less distinct in urban settings because of better access to information and services.In summary, the present study reinforces that poverty remains a key determinant of teenage pregnancy, but highlights a growing urban inequality, where the poorest adolescents in cities are most affected. Figure 3 displays regional concentration curves, illustrating how teenage pregnancy is distributed across different regions relative to socioeconomic status. From the patterns observed, all regional curves lie below the line of equality, again confirming a pro-poor distribution of teenage pregnancy in every region. However, the degree of inequality varies across regions: The South-West curve is the furthest below the line, indicating the highest inequality, and the South-East curve is closest to the line, implying less severe inequality. The findings are consistent with those of Bolarinwa et al. [28] and Mbulu et al. [29], who used NDHS data and similarly discovered that teenage pregnancy is heavily concentrated among poorer households across all geopolitical zones.Additionally, Ahinkorah et al. [19] reported that adolescent fertility in sub-Saharan Africa is strongly linked to poverty, emphasizing that regional factors such as education levels, cultural norms, and health infrastructure influence inequality. The Erreygers normalised concentration indices show that teenage pregnancy in Nigeria remains disproportionately concentrated among poorer households in both survey years. Although the degree of inequality slightly reduced between 2013 and 2018, teenage pregnancy continues to affect the poorest segments more severely. This modest improvement suggests that progress has been made, possibly due to national adolescent reproductive health programs, expanded access to family planning, and increased awareness, but socioeconomic disparities persist.The findings are consistent with Crooks et al. [30] and Nduhuye et al. [31] in Rwanda, who reported that teenage pregnancy and early childbearing are more common among adolescents from poorer, rural, and less-educated backgrounds. Similarly, Li et al. [32] and Singh et al. [33] found that socioeconomic disadvantage strongly predicts teenage pregnancy in sub-Saharan Africa. Educational attainment plays a pivotal role, as low education contributes to inequality, consistent with Njeru et al. [34] and Okoli et al. [2]. Marital status also contributes notably, as many teenage pregnancies occur within marriage, particularly in regions where child marriage is culturally accepted [35,36].Regional and rural–urban inequalities further reinforce this pattern. Teenage pregnancy is more common in rural areas and northern regions, where access to education, contraception, and adolescent-friendly health services is limited [37]. This north–south divide mirrors findings from Onakalu et al. [38], who observed that rural and northern adolescents face compounded disadvantages due to poverty, restrictive gender norms, and weak health infrastructure.
5. Conclusions
- This study examined geographical inequalities in teenage pregnancy in Nigeria using data from the 2013 and 2018 Nigeria Demographic and Health Surveys (NDHS) and applied the Erreygers normalised concentration index and decomposition analysis to quantify and explain disparities. The findings reveal a persistent pro-poor inequality in teenage pregnancy across both survey years, indicating that adolescent girls from poorer households continue to bear a disproportionate burden of early childbearing. Although the overall magnitude of inequality showed a slight decline between 2013 and 2018, progress has been marginal, underscoring the resilience of structural and contextual determinants.The analysis further highlights that wealth, education, and marital status are the leading drivers of teenage pregnancy inequality in Nigeria, while regional and rural–urban disparities remain evident. Inequality was most pronounced in the South-West and North-Central regions and least severe in the South-East, reflecting the interplay of socioeconomic development, cultural norms, and access to reproductive health services. The concentration of teenage pregnancy among the poorest urban adolescents also suggests widening inequities within cities, likely tied to urban poverty, informal settlements, and limited youth-friendly reproductive health services.These findings underscore the need for context-specific, equity-oriented interventions to reduce teenage pregnancy and its associated socioeconomic consequences. Efforts should prioritize girls’ education, economic empowerment, delay of early marriage, and expanded access to modern contraceptive methods, especially among poor and rural populations. Strengthening adolescent sexual and reproductive health policies and integrating regional and community-level programming will be crucial to achieving inclusive progress toward the Sustainable Development Goals (SDGs), particularly SDG 3 (Good Health and Well-being) and SDG 5 (Gender Equality). This ensures that improvements in teenage pregnancy are captured among the most vulnerable groups and that no region or socioeconomic group is left behind.In conclusion, despite modest improvements, teenage pregnancy in Nigeria remains deeply rooted in socioeconomic and geographical inequality. A comprehensive approach that simultaneously addresses poverty, education, and sociocultural barriers is essential to close the inequality gap and ensure that every Nigerian adolescent, regardless of where she lives or her economic background, has the opportunity to achieve healthy reproductive outcomes and a better future. Policymakers should prioritise regions and states identified with the highest levels of inequality by expanding adolescent-friendly reproductive health services through mobile clinics, community health extension programmes, and youth-friendly service corners in primary healthcare centres.
Limitations
- This study has several limitations. First, the data are drawn from cross-sectional surveys, which provide only a snapshot in time and do not allow for causal inferences; therefore, it is not possible to determine whether poverty directly causes higher teenage pregnancy or whether other unmeasured factors play a role. Second, the data are self-reported, which may introduce recall bias or underreporting, particularly given the social stigma associated with teenage pregnancy. Third, the socioeconomic ranking used in the concentration index is based primarily on household wealth and may not fully capture other dimensions of disadvantage, such as education, access to reproductive health services, or broader social determinants. Finally, unmeasured contextual factors, including cultural norms, family structure, and peer influence, could also affect teenage pregnancy but are not accounted for in the index, potentially limiting the comprehensiveness of the inequality assessment.
ACKNOWLEDGEMENTS
- We thank the MEASURE DHS project for the approval and access to the original data.