-
Paper Information
- Paper Submission
-
Journal Information
- About This Journal
- Editorial Board
- Current Issue
- Archive
- Author Guidelines
- Contact Us
International Journal of Statistics and Applications
p-ISSN: 2168-5193 e-ISSN: 2168-5215
2025; 15(1): 14-22
doi:10.5923/j.statistics.20251501.02
Received: Sep. 12, 2025; Accepted: Sep. 30, 2025; Published: Oct. 9, 2025

A Composite Indicator of Africans’ Trust in Institutions: Insights from Afro-barometer Data
 Abstract
 Reference
 Full-Text PDF
 Full-text HTML
Hillary Muhanguzi1, Onkabetse Vincent Mabikwa2
1Department of Statistical Methods and Actuarial Sciences, Makerere University, Uganda
2Department of Mathematics and Statistical Sciences, Botswana International University of Science & Technology (BIUST)
Correspondence to: Hillary Muhanguzi, Department of Statistical Methods and Actuarial Sciences, Makerere University, Uganda.
| Email: |  |
Copyright © 2025 The Author(s). Published by Scientific & Academic Publishing.
This work is licensed under the Creative Commons Attribution International License (CC BY).
http://creativecommons.org/licenses/by/4.0/

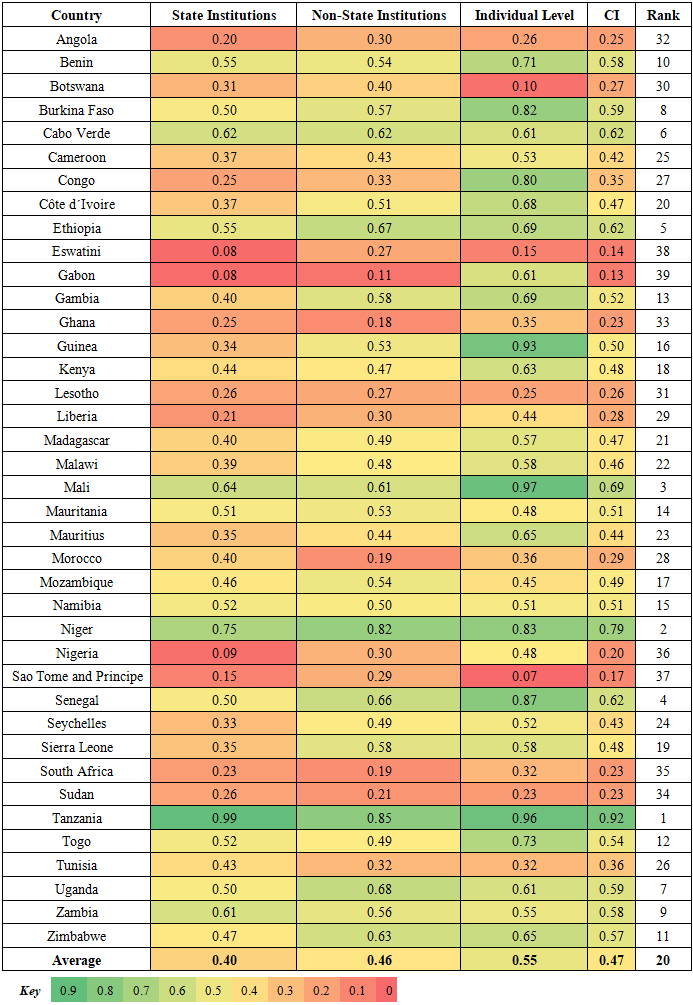
This study constructed a composite indicator to assess trust in institutions across 39 African countries using Afro-barometer Round 9 data. Trust in institutions is crucial for effective governance, compliance, crime reduction, and nation-building. The study categorizes and weights trust into three dimensions: state institutions (40% weight), non-state institutions (40%), and individual-level trust (20%). It incorporates 17 elementary indicators, including trust in the presidency, courts, police, religious leaders, and family. A minimax normalization scheme and multiplicative aggregation were applied to generate the scores and rankings, which were confirmed to be robust. Findings show an average trust score of 47% across Africa. Individual-level trust is highest at 55%, likely due to strong cultural ties, while trust in state institutions is 40% and in non-state institutions is 46%. Tanzania ranks highest (94%), followed by Niger (79%), while Sao Tome and Principe (12%) and Eswatini (12%) rank lowest. The composite indicator is negatively correlated to population size, unemployment rates, GDP per capita, and the time the head of state has spent in power. This bivariate relationship is only significant with the unemployment rate (p-value = 0.001 < 0.05). Trust in Francophone countries averages 45%, slightly higher than in Anglophone countries (43%). Regionally, East Africa leads with 65%, followed by West Africa (45%), Southern Africa (39%), and North Africa (35%). The findings indicate a significant lack of trust in essential state institutions throughout the continent, highlighting the governance challenges that many African nations face in their efforts toward nation-building and fostering social cohesion. This study offers a comprehensive assessment of institutional trust, a multifaceted phenomenon, while effectively acknowledging that formal state institutions coexist with informal ones in a condition of continual development. The composite indicator enables inter- and intra-country comparisons, providing policymakers and scholars with significant insights into continental governance and legitimacy.
Keywords: Composite indicator, Trust, Institutions, Africa
Cite this paper: Hillary Muhanguzi, Onkabetse Vincent Mabikwa, A Composite Indicator of Africans’ Trust in Institutions: Insights from Afro-barometer Data, International Journal of Statistics and Applications, Vol. 15 No. 1, 2025, pp. 14-22. doi: 10.5923/j.statistics.20251501.02.
Article Outline
1. Introduction
- Trust may be defined as dependence or faith on the integrity, competence, or certainty of an individual or entity. [1] asserts that trust is an expectation derived from a group’s cooperative behaviour grounded in shared norms. Trust connects citizens to their representatives and state institutions established to serve them, making its attainment challenging in practical terms. These points of view highlight several critical aspects of the acts, actors, expectations, and the demand and supply that must all be aligned for trust to be established. This relationship demands a thorough understanding of both supply and demand in order to effectively predict and engage in trust-related activities.Globally, citizens obtain services from institutions- mostly state institutions. In Africa, non-state institutions such as religious organizations, traditional leaders, and neighbours play a significant role in shaping individual and social outcomes. As a result, it is acceptable for these institutions to command trust, and for their service recipients to have confidence in them. Trust signifies democracy, and democratic governments encourage economic success, stability, peace, civic responsibility, and lawful behaviour. This position resonates with [2] who opine that trust is perhaps the fundamental component of social capital, essential for social integration, economic efficiency, and a predictable, democratic existence. Consequently, we may all agree that increasing trust in institutions, particularly governmental institutions, has various benefits for both individuals and society. Initiatives to build trust are crucial, but so are appropriate assessments, which reveal strengths and weaknesses, aiding in the assessment and prediction of political and social outcomes for specific groups or nations. Relatedly, governments and non-state entities have increasingly sought to assess the overall level of trust in institutions. Since the 1950s, institutional trust has been assessed and analyzed [3] as a crucial element of citizens' well-being. In Europe, various authors have assessed trust in European institutions utilizing Eurobarometer data. [4] have constructed a formula that assesses net trust, by subtracting the percentage of those who trust from those who do not trust the institution. This still yields distinct elementary indicators. The Afro-barometer conducts cross-sectional surveys throughout Africa, serving as a significant source of various metrics on trust. However, measuring trust holistically is still complex, as current metrics fail to fully encapsulate the concept's elusive, multi-dimensional, and dynamic nature. Additionally, distinguishing between active distrust and mere lack of trust is challenging [5] as it is also difficult to ascertain whether citizens in various countries interpret the underlying concepts of trust similarly. This presents significant issues in contextualizing trust and the impact that autocratic or democratic administrations may exert on survey response patterns. As such, [2] contends that metrics may be skewed when citizens lack the requisite knowledge to assess the functioning of public institutions and incumbent leaders. In our view, trust is a multidimensional construct that is influenced by both exogenous and endogenous factors, as well as cultural norms, normative perspectives, and judgments of institutional efficacy. As a result, trust functions as a component within a system of interrelated aspects targeted at the effective operation of governance, and we quantify it using a composite indicator. Individual, cultural, state, or non-state variables, as well as foreign influences, may be included in the numerous components inside a system, and their individual and collective measures are critical to understanding the multidimensional nature. This is justifiable as composite indicators (CIs) are frequently employed for longitudinal and cross-sectional performance monitoring, comparisons, communication, and policy analysis as previously observed in [6,7,8,9]. This paper offers a unique contribution to the body of knowledge by demonstrating a comprehensive assessment of a multi-faceted construct—trust—while effectively capturing the diverse sources of authority within African contexts. This holds significant importance in Africa, where formal state institutions frequently exist alongside informal or traditional ones, and are in a state of ongoing development. A composite indicator of institutional trust in Africa offers a thorough, context-aware, and comparable measure that encompasses both formal and informal institutions, thereby providing policymakers and scholars with a more nuanced perspective on governance and legitimacy throughout the continent. This study builds a composite indicator of trust in Africa utilizing the Afro-barometer round 9 dataset gathered from 39 nations. We correlate the scores with established country metrics, like the corruption perception index, as a part of external validation of the findings. This article is structured into five sections. Section two outlines the conceptual framework for the composite indicator, whilst Section three outlines the methods utilised in this study. Section four presents the results, whereas section five is the discussion and conclusion of the article.
2. Conceptual Framework for a Composite Indicator of Trust
- We categorized trust into three components: trust in state institutions, trust in non-state organizations, and individual-level trust. State institutions are defined as entities that derive financial resources from the national budget and are obligated to provide services to all citizens, irrespective of political affiliation, creed, beliefs, or ethnicity. They constitute the government and are authorized to govern a nation. These institutions are anticipated to deliver services consistently and impartially, in accordance with established national laws and mandates, demonstrating a degree of permanence and universality in minimal operational criteria. In our analysis, we classify the presidency, parliament, judiciary, police, military, local governments, and election commission as state institutions. We view non-state institutions as entities that do not receive financial support from the government but are established organizations that enhance and impact governmental operations by significantly contributing to service delivery, social cohesion, and development. They are not included in the official governmental framework and may consist of traditional leaders, religious authorities, the ruling party, and the opposition. At the individual level, we examine persons themselves (interpersonal trusts), which typically manifest as naturally occurring structures such as ethnicity, religion, neighborhood, and familial relations. Incorporating them into the measurement model is essential, as the primary unit of a state is a household comprised of individuals. Events occurring at the family level mirror those at the collective national level. Researchers such as Arrow and Rudziewicz, as cited by [10] assert that numerous developing countries and enterprises are unable to expedite economic development due to a deficiency of mutual trust, thereby justifying the inclusion of its variables as a dimension in the composite indicator. The conceptual framework is shown in Figure 1.
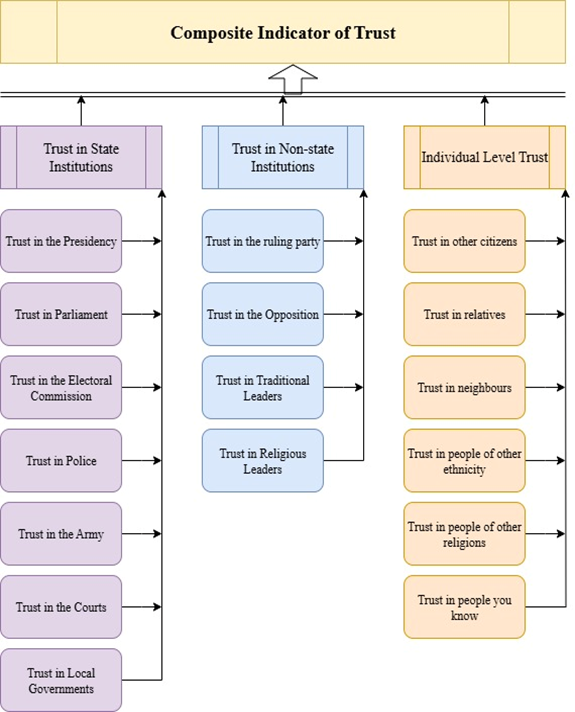 | Figure 1. Conceptual Framework for the Composite Indicator of Trust |
3. Methods
3.1. Source of Data
- We utilized the Afro-barometer Round 9 data set to construct the CI. Afro-barometer is a Pan-African, non-partisan survey research network that delivers dependable statistics on African experiences and assessments of democracy, government, and quality of life. The survey comprises a nationwide probability sample of 1,200 to 2,400 persons (aged 18 and older) that produces country-level estimates. Data are gathered via in-person interviews and are adjusted to provide national representativeness. The data for the 39 countries is derived from 53,444 interviews. The data employed to create this composite indicator were previously analyzed and obtained from MS Excel applications through the Afro-barometer analysis tool available on the Internet (https://www.afrobarometer.org/data/data-sets/. The survey included the question: “To what extent do you trust each of the following, or are you insufficiently informed to provide an opinion?” We queried and combined the nationwide percentage of respondents who answered either “somewhat” or “a lot” to derive the values utilized in this study. Seventeen (17) elementary indicators, classified into three dimensions, were utilized in the initial stages of this investigation. In the inevitable instances of addressing missing data, we allocated the median value to the respective country for that variable.
3.2. Measurement Model
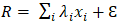
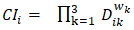
- The measurement model provides a linkage between the phenomenon to be measured (latent variable) and its indicators (elementary indicators) [12]. The CI construction is interpreted as an exploration for a latent variable, initiated from the observed variables. The application of an appropriate measurement model enhances the content validity of the CI and facilitates the accurate depiction of the structural relationships in which the constructs are situated [13]. Maggino, as referenced in [12], contends that a proper comprehension of the link between indicators and the latent variable enables the accurate identification of the technique for aggregating individual indicators. Accordingly, we employed a formative measurement model in which causality flows from the elementary indicators to the composite indicator, and a change in the phenomenon does not necessarily entail modifications in all its measures. The formative model is as presented in Equation 1.
 | (1) |
 is the coefficient capturing the effect of indicator Xi on R and
  is an error term. This model resulted in aggregation occurring in two phases, as the empirical behavior of the trust phenomenon indicated that alterations in the elementary indicators (according to the dimensions) would result in modifications to the trust CI values. However, a change in one dimension does not inherently induce a change in another dimension, which is a critical assumption of the formative model.NotationThe initial dataset is organized as records representing countries, with fields corresponding to indicators or variables, and their combination yielding observations or values. This study employs the following notation: Let the observation for indicator j (j=1, …, 17) belonging to country i (i=1, …, 39) be denoted as Xij which may be measured on ratio scale. Let wk denote a weight attached to a dimension k (k=1, …, 3) where,
  .
.3.3. Normalization, Weighting, and Aggregation
- Normalization was performed to render the data comparable prior to the application of weights. The variables were normalized via the minimax method, the formula for which is presented in Equation 2. Minimax normalization adjusts the variable to a range of [0,1] by removing the minimum value from the indicator value and dividing the result by the indicator range. This method does not reshape the distribution of the original variable.
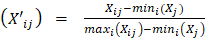 | (2) |
 | (3) |
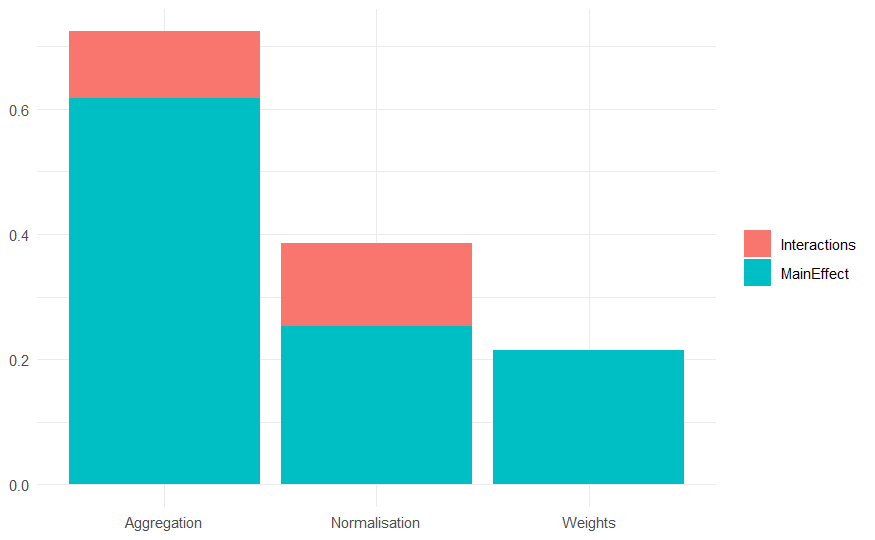
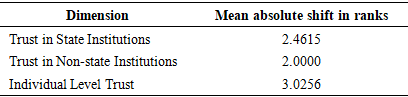
3.4. Robustness Tests
- Uncertainty analysis (UA) and sensitivity analysis (SA) were performed to assess the robustness of the CI. According to [14], UA focuses on how uncertainty in the input factors propagates through the structure of the composite indicator and affects the values of the CI while SA is an extra step (7) and studies how much each individual source of uncertainty contributes to the output variance. In this paper a comparison of conceivable scenarios at normalization (minimax and z-score), weighting (equal weights and budget allocation) and aggregation (additive and geometric) stages was performed and the absolute shifts in ranks noted.
4. Results
- In Africa, individual trust reaches a maximum of 0.55, followed by non-state institutions at 0.46, and state institutions at 0.40. This indicates that while individuals may have confidence in their community members, they exhibit greater skepticism towards formal institutions, particularly those operated by the state. Table 1 indicates that the top five performers are Tanzania (0.92), Niger (0.79), Mali (0.69), Senegal (0.62), and Ethiopia (0.62), respectively. These nations exhibit widespread trust across all three dimensions of institutions. Tanzania exhibits remarkably high ratings across all three dimensions: 0.99 (state), 0.85 (non-state), and 0.96 (individual), although Niger likewise demonstrates a well-balanced and robust trust profile. This performance suggests that nations with consistently high ratings, such as Tanzania, Niger, and Mali, may possess more cohesive societies and competent governance.
|
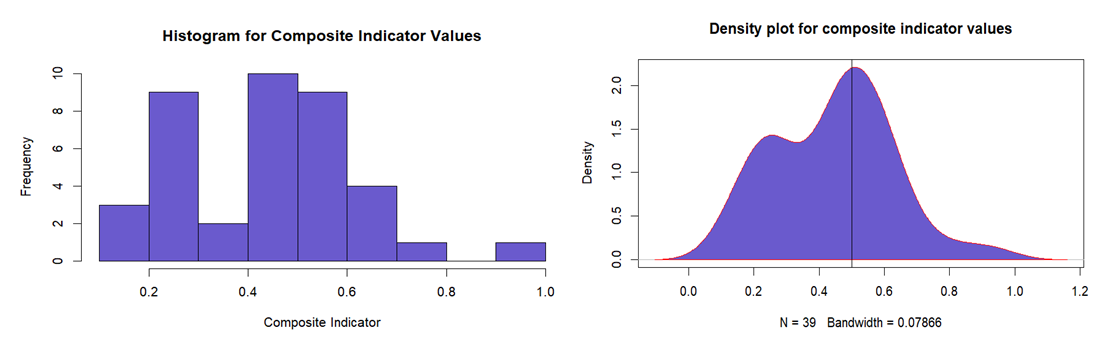 | Figure 2. Histogram, and density plot for the composite indicator |
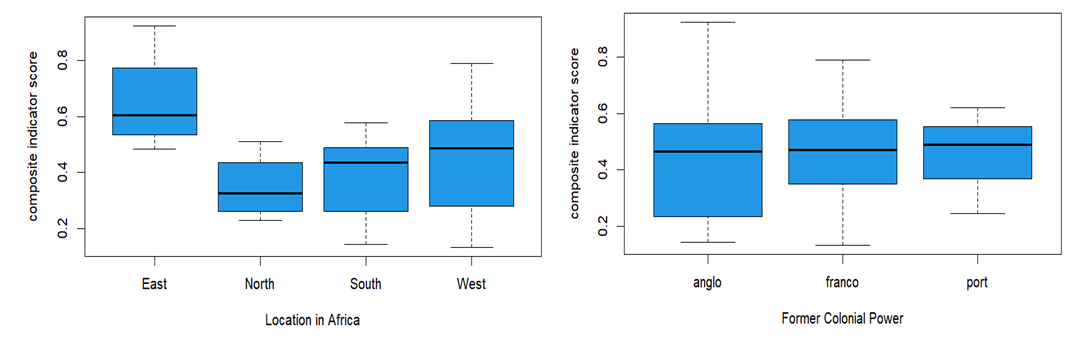 | Figure 3. Boxplots for regional location and former colonial power |
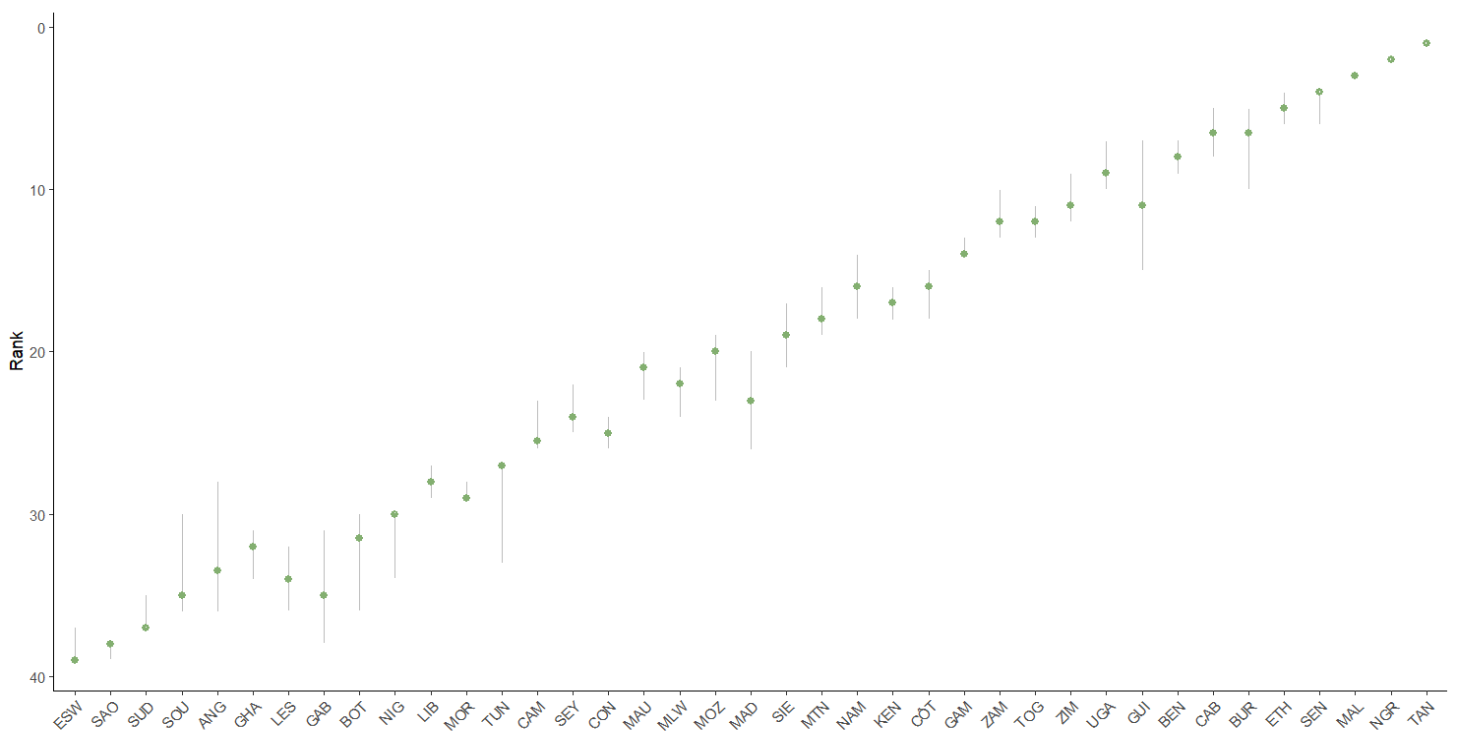 | Figure 4. Uncertainty intervals of the African countries' ranks |
 | Figure 5. Sensitivity Analysis results of the CI of trust |
|
|
5. Discussion and Conclusions
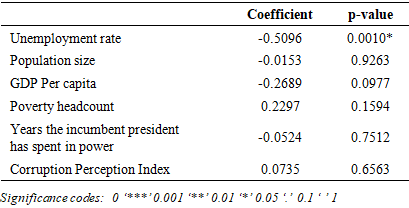
- Institutional trust in Africa is shaped not only by political institutions but also by customary authorities, religious bodies, NGOs, and international organizations. Accordingly, in this article we present a composite indicator to assess trust across three dimensions: state institutions, non-state institutions, and individual-level trust. This is based on proposals gathered through literature to integrate individual-level trust into comprehensive assessments of trust on the continent [15]. This work enhances the expanding literature on the utilization of composite indicators to assess multi-dimensional phenomenon such as trust. The accurate assessment of trust is crucial for the ambitions of a developing nation, as it indicates the legitimacy of the democratic transformations that countries undertake. This study conducts inter- and intra-country comparisons to identify potential reasons contributing to variations in trust levels. In contrast to numerous global governance indicators that frequently neglect informal institutions, a CI of trust for Africa encapsulates the hybrid governance systems present on the continent, encompassing both state and non-state authorities. This analysis recognizes the multiple sources of legitimacy that influence the lived experiences of citizens across the continent.This study revealed several fundamental issues, particularly the conceptual framework linking individual trust to both state and non-state institutions. In contrast to Afro-barometer reports that just give discrete performance indicators for state and non-state institutions [16], we assert that individual-level trust is equally significant and should be integrated into the measurement paradigm. Trust, being multi-dimensional, necessitates a meticulous clarification of its basic elements to enable thorough assessment. We originate from a mindset that posits, "if citizens cannot trust themselves, how can they trust institutions?" Consequently, institutions are established or dismantled by citizens (individually or collectively). The findings from this investigation can be generalized, as individual-level trust far surpasses institutional trust in most countries. For instance, nations such as Congo, Gabon, Guinea, and Burkina Faso exhibit high levels of individual trust but demonstrate low institutional trust. This situation indicates that, in the African context, interpersonal trust precedes institutional trust. This performance at individual level may be attributed to improved interactions and communications regarding the obligations of each participant, as well as interfaces that promote psychological safety and facilitate risk-taking. Whereas most citizens may possess sufficient information while interacting with other individuals, this is not necessarily true when engaging with institutions. Furthermore, in certain communities—particularly rural ones—the deficiency of sufficient information regarding institutional commitments and explicit experiences in addressing them influences their judgments, a phenomenon commonly observed in Africa.In the bi-variate association to validate the CI, our findings indicate a weak positive correlation (ρ=0.07) between the corruption perception index and our composite indicator of trust. These findings are compelling and contradict the positions of [17,18,19,20] that the degree of corruption significantly undermines public' trust in democratic institutions. Compared to the methods used in these studies, these results could be attributed to the aggregation of various components to form a singular estimate. The substitutability effect inherent in CIs implies that weak performance in one dimension is compensated for by strong performance in another. As a result, people may perceive formal institutions as corrupt but still trust them when mediated by informal authorities. This overlap may sustain institutional trust despite corruption perceptions. Nonetheless, these contentious outcomes may be ascribed to the data generation methodologies employed, wherein Afro-barometer recruits a diverse range of respondents through probabilistic selection, whereas Transparency International engages experts equipped with sufficient information to render accurate assessments of both direct and indirect corruption. Additionally, corruption has been normalised in some developing countries with weak institutions- as citizens perceive corruption as a necessary mechanism to swift service delivery. At that point, corruption may be ascribed to individuals rather than institutions as a whole. Likewise, the correlation between poverty head-count and trust levels is weak but positive. This outcome is rather unexpected; nonetheless, potential explanations may be linked to cultural, political, and measurement dynamics. Typically, individuals in lower socio-economic strata exhibit a pronounced dependence on institutions for their survival, which may result in a lack of objective assessments. Their expectations from governmental entities tend to be modest, hence influencing their trust levels. Furthermore, in less developed economies, poverty can exist alongside a robust sense of communal or institutional trust, as individuals often gravitate towards collective frameworks rather than market solutions. Additionally, we observe that the CI exhibits a negative correlation with the unemployment rate, GDP per capita, and population size of the countries. This indicates that nations characterized by elevated population levels, wealth per individual and unemployment rates tend to have diminished levels of trust overall. This is anticipated, particularly in regions where population increase does not correspond with the expansion of resources necessary to sustain the populace and generate work possibilities for the youth. In many instances, the limited chances present are not directly allocated to residents based on merit, hence fostering possible nepotism, psychological distress, and diminished trust in institutions. Notably, GDP per capita, as an indicator of economic progress, exhibits a negative correlation with the CI of trust, contrary to the assertions of writers such as [21] and [10], particularly in Western nations. The African nations excelling in GDP per capita include Seychelles, Botswana, South Africa, and Mauritius, among others, and they also rank highly in literacy rates. Informed citizens are said to understand the responsibilities of their institutions, thereby affecting their service-seeking behaviours and enabling them to make sound evaluations of institutional performance. Conversely, [22] assert that economic growth and trust are inversely correlated, attributing this to income inequality typically found in high-income countries. Growing wealth inequality heightens the likelihood of societal comparisons, which replace trust in individuals' utility functions. Moreover, wealth inequality undermines collaboration and social cohesion in favour of competitiveness, hence heightening the likelihood of social instability. In consistence with [4], our results show that the unemployment rate is the sole significant factor correlated with aggregated trust levels. Also, this finding aligns with several research, including those by [23]; [24]; and [25], indicating that individuals facing unemployment generally exhibit diminished faith in government and political institutions. This can be ascribed to sentiments of economic distress, employment instability, and a perception that the government is insufficiently meeting their needs or offering suitable assistance. Furthermore, a significant level of unemployment among the populace might engender a perception of crisis and instability, prompting residents to scrutinize the government's competency and efficacy.In conclusion, the low levels of trust across the continent necessitate the engagement of both state and non-state actors to reassess their operational methods and duties towards a people-centered governance. This diminished level of trust is self-sabotaging, resulting in decreased internal legitimacy and consequently restricted participation in governmental matters. Externally, it contributes to the increasing prevalence of afro-pessimistic attitudes that hinder investment, overall economic development, and misjudgment of Africans. Trend analysis of composite indicator values from the Afro barometer survey rounds as well as correlating the trust CI with more country variables awaits future research.