-
Paper Information
- Paper Submission
-
Journal Information
- About This Journal
- Editorial Board
- Current Issue
- Archive
- Author Guidelines
- Contact Us
International Journal of Statistics and Applications
p-ISSN: 2168-5193 e-ISSN: 2168-5215
2024; 14(3): 56-64
doi:10.5923/j.statistics.20241403.03
Received: Jul. 10, 2024; Accepted: Aug. 6, 2024; Published: Sep. 27, 2024

A Mean Descending Order of Ranking Approach of Finding an Initial Basic Feasible Solution of Transportation Problem
Stephen Chidi Duru, Akobi Emmanuel Ogar
Department of Mathematics and Statistics, University of Port Harcourt, Rivers State, Nigeria
Correspondence to: Akobi Emmanuel Ogar, Department of Mathematics and Statistics, University of Port Harcourt, Rivers State, Nigeria.
| Email: |  |
Copyright © 2024 The Author(s). Published by Scientific & Academic Publishing.
This work is licensed under the Creative Commons Attribution International License (CC BY).
http://creativecommons.org/licenses/by/4.0/

This paper centres on another method of solving transportation problems called a Mean Descending Order of Ranking Approach of Finding an Initial Basic Feasible Solution for a Transportation Problem. This is achieved by calculating the row and column mean and rank in descending order thereby allocating as much as possible within the restrictions of the rim conditions to the lowest cost cell in the row(s) or column(s) selected. This calculation is done effortlessly. Results from the numerical examples showed that the mean descending Ranking Approach method was very near optimal or with fewer iteration to optimality and having very few minutes from formulation stage to optimal stage. When compared with other methods, the new proposed algorithm does better in finding IBFS than the North-West Corner Method, Least Cost Method and Vogel’s Approximation Method.
Keywords: Transportation Problem, Transportation Table, Ranking, Initial Basic Feasible Solution, Transportation Cost, Time, Optimal Solution
Cite this paper: Stephen Chidi Duru, Akobi Emmanuel Ogar, A Mean Descending Order of Ranking Approach of Finding an Initial Basic Feasible Solution of Transportation Problem, International Journal of Statistics and Applications, Vol. 14 No. 3, 2024, pp. 56-64. doi: 10.5923/j.statistics.20241403.03.
Article Outline
1. Introduction
- Since the 18th century, when transportation difficulties were first formulated mathematically, they have been a well-known subject in operations research, and throughout World War I, their importance increased. During this phase of the war, plans were created to gather troops and the equipment they needed at strategic depots. These forces were then swiftly sent to the assigned location by making effective use of optimization in transportation issues. The achievement of an organization's social and economic objectives is significantly impacted by transportation. The last 20 years have seen a major contribution to the creation of a new generation of transportation systems that fit the value that each rapidly expanding business has to provide, with an emphasis on certain qualities like quality, flexibility, speed, dependability, or affordability. Because of the efficiency and growth of contemporary science and technology, the concepts of logistics in operations research continue to reap substantial benefits. Manufacturing firms aim to minimize their overhead expenses in order to maximize their product costs. For instance, transportation costs make up a sizable amount of the expenditures in the mining and energy sectors. Bienstock and Munoz (2015) state that as freight makes up between one-third and two-thirds of all logistics costs, even a little gain in transportation efficiency would boost the bottom line of the business. To find the best answer to a transportation problem, follow these fundamental steps: (Mohan and Gupta, 2003)Step 1: Mathematical formulation of the transportation problemStep 2: Determining an initial basic feasible solution Step 3: To test whether the solution is an optimal one. If not, improve it further till the optimality is achieved. Most of the time the initial basic feasible solution of transportation problem is calculated by using the methods of North West Corner Method, Row Minima Method, Column Minima Method, Least Cost Method or Vogel’s Approximation Method, and then finally the optimality is checked and calculated by MODI (modified distribution) method or Stepping Stone Method.
2. Related Literature Review
- George B. Dantzig first introduced the concept of linear programming in 1947 while serving as a mathematical advisor to the United States Air Force Comptroller. His work focused on creating a mechanized planning tool for time stage deployment, training, and logistical supply programs. Although the term “linear programming” was coined by Koopmans in 1948, it was Dantzig who published the simplex method for solving linear programming problems. Initially, linear programming was concerned with planning and scheduling related to training, logistics, and personnel deployment. Today, its applications have expanded to encompass all economic activities, including the transportation of raw materials and products, agricultural planning, and manufacturing processes like cutting paper rolls to customers specifications. The primary objective of linear programming is to optimize a linear function while adhering to constraints defined by linear inequalities or equalities. Luenberger (1973) noted that linear programming’s popularity stems from the relative ease of problem formulation compared to the complexity of solving them. This method is particularly effective in scenarios where multiple competing candidates seek to utilize limited resources efficiently. Dantzig (2016) and Murthy (2005) emphasized that linear programming is one of the most powerful and versatile decision-making tools available. Sultan (2014) pointed out its significant role in various military operations during critical conflicts. During the World War II, the necessity for effective resource management and planning became evident, highlighting the challenges of transporting personnel and equipment from various sources. Ahmed et al (2016a) described transportation modelling as a strategy for planning the distribution of supplies from multiple sources to various destinations. The primary goal of addressing transportation problems is to minimize distribution costs for goods or products moving from factories to warehouses or other destinations.
3. Proposed Approach to Find Initial Basic Feasible Solution
- Transportation modeling is an iterative procedure for solving problems that involve minimizing the cost of shipping products from a series of sources to a series of destination. Heizer and Render (2004) explained the steps for solving the problem as “Based on theory, after all needed data were arranged in tabular form, the next step of the technique is to establish an initial feasible solution to the problem and finally, iterate towards optimal solution using the u-v method or the stepping stone method”. In accordance to the transportation problem, the following steps are to be followed:The process of lowering the cost of moving goods from a number of origins to a number of destinations is known as transportation modeling, and it is an iterative process. As stated by Heizer and Render (2004), "Based on theory, after all needed data were arranged in tabular form, the next step of the technique is to establish an initial feasible solution to the problem and finally, iterate towards optimal solution using the u-v method or the stepping stone method." This is how the problem is solved. The following actions need to be taken in light of the transportation issue:Step 1: Form a transportation table (TT) from the given transportation problem.Step 2: Ensure that the transportation problem (TP) is balanced by
 . Step 3: Calculate
  for all rows and
  for all columns’.Step 4: Rank the rows in descending order based on higher
  value. Step 5: Rank the column in descending order based on higher
  value. If multiple columns or rows have equal higher
  or
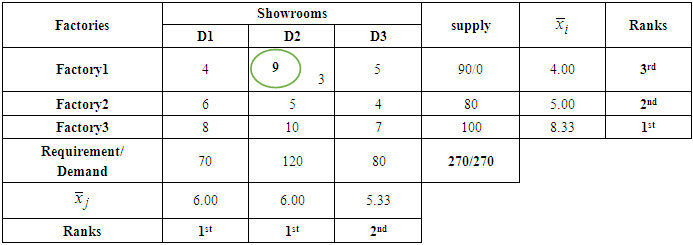
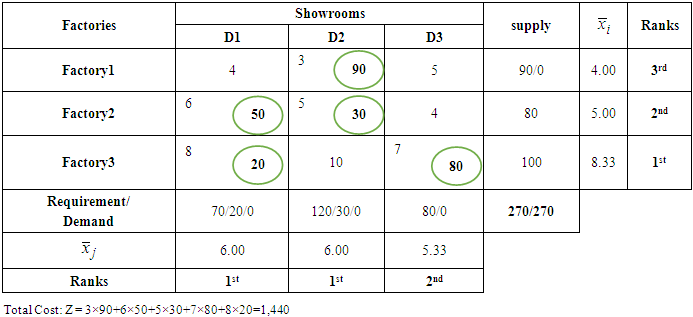
or  value, these columns or rows will appear in the same position in ranking. Step 6: Select 1st ranked row and 1st ranked column.Step 7: If two or more same ranked columns or rows are existed in the transportation table, select these also. Find the smallest cost cell from these row and column. Allocate as many units as possible to that cell. If the minimum cost exists in several cells, select a cell and allocate goods to satisfy the rim condition. Then eliminate the row or column in which supply or demand is exhausted.Step 8: If 1st column is eliminated, select the next ranked (2nd) column and also 1st row. Again, if 1st row is eliminated, select the next ranked (2nd) row and also 1st column then go to step7 to make allocation. Adjust the supply and demand and cross out the satisfied row or column. If a row and a column are satisfied simultaneously, either the row or column is crossed out and the remaining row or column is assigned a zero supply or demand. Any row or column with zero demand or supply should not be used in making future allocation. Step 9: Repeat the process with next higher
  value (rank) in rows or
  value (column) in columns and continue until the entire available supply at various sources and demand at various destinations is satisfied.Step 10: Compute the total transportation cost,
  .
.4. Numerical Illustrations of the Propose Method
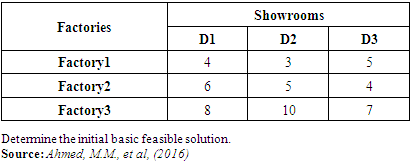
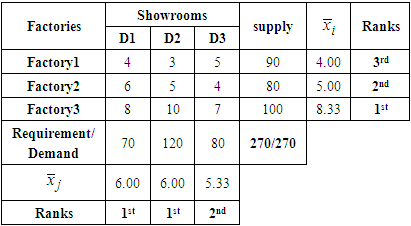
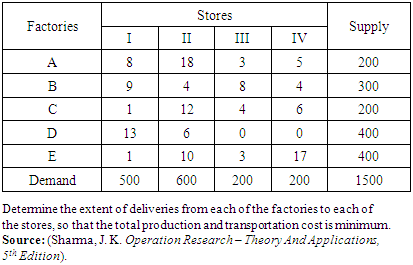
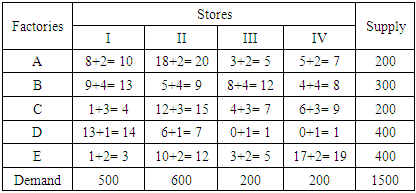
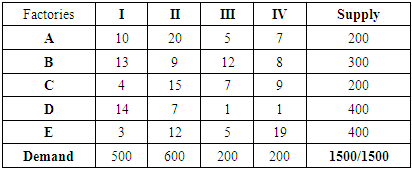
- We shall consider a few examples including small, medium and large size dimensions of transportation problem which will make clear the technique of formulation and the solutions of transportation problem. Example 1A company has three factories and three showrooms. The factories altogether have a surplus of 270 units of a given commodity, divided among them as follows
 The three showrooms altogether need 270 units of the commodity. Individual requirements at showrooms D1, D2, and D3 are 70, 120, and 80 units respectively. Cost of shipping one unit of commodity from factory
  to showroom
  in naira is given in the matrix below.
|
|
|
|
|
|
|
|
|
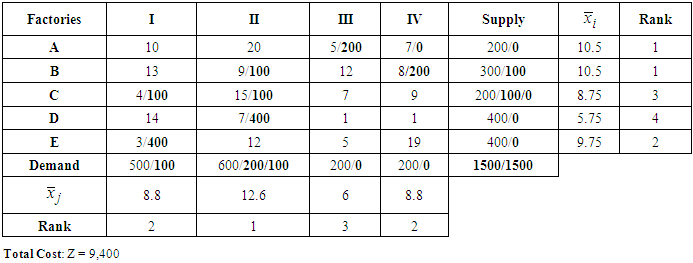
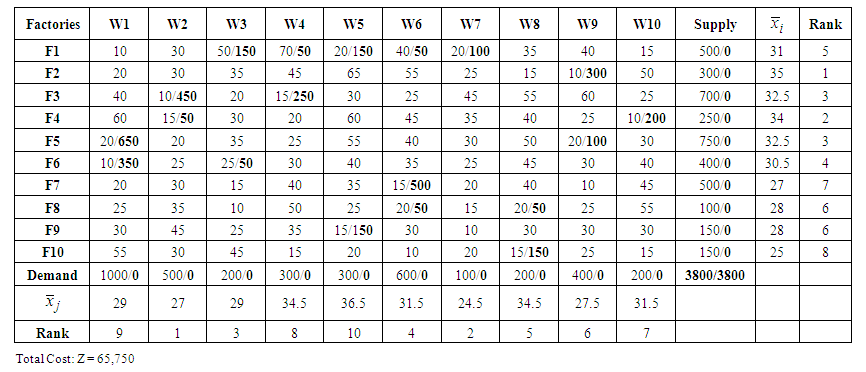 | Table 10. Results Table in higher mean value ranks |
|
|
|
|
|
|
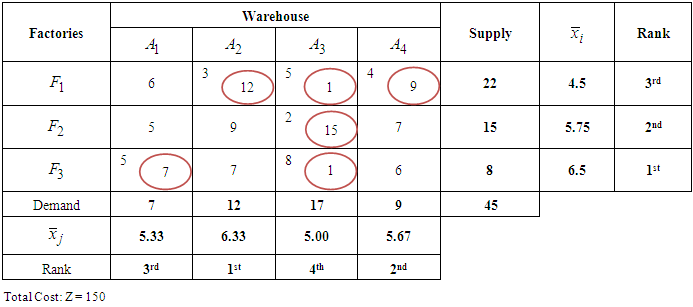
 , and
, and  that supply product to warehouse at
  (Alakahia),
  (Rumuosi),
  (Choba) and
  (Alu). The weekly capacities of the factories are 22, 15 and 8 unit respectively. The weekly warehouse requirements are 7, 12, 17, and 9 units respectively. The unit shipping costs (in Naira) are as follows
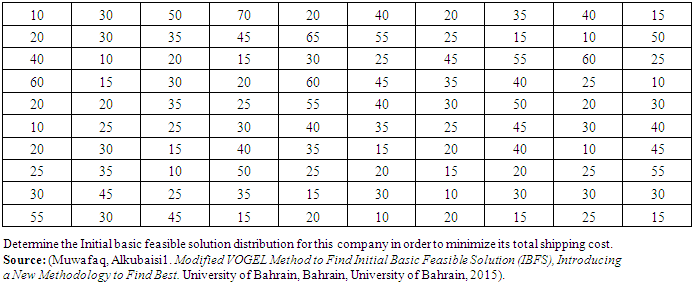
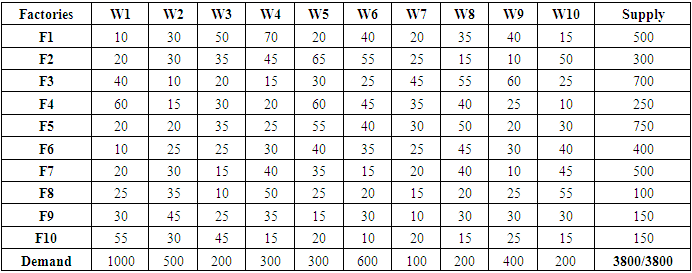
|
|
5. Presentation of Numerical Results for Optimization Methods
- In the results, our calculated results are interpreted with results obtained by other existing methods.
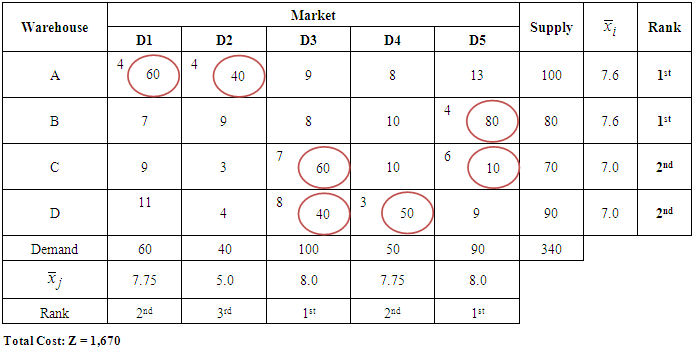
 | Table 19. Summarizes the results for different examples, including the number of iterations and time taken to reach the optimum solution |
6. Comparative Study and Analysis
- Clearly, the Vogel Approximation Method, Least Cost Method and North West Corner Method are commonly used methods to find initial basic feasible solution in most of transportation problems in literatures available. Our proposed method, the mean descending order of ranking has been checked to solve transportation problems of different sizes and analysed based on the number of iterations from IBFS to optimality and time taken from formulation stage to optimal solution stage. It is seen from our results that the proposed method gives more efficient solution than other existing algorithms most times in terms of flexibilities, easy to handle and can be used to solve transportation problems of any size in few minutes.
7. Conclusions
- A new algorithm has been discussed to solve transportation problems of any dimension. Efficiency and flexibilities of the developed algorithm is also been justified by solving numerical problems. During this process, a comparative study of the proposed method reveals distinct strength across different examples. For smaller datasets, methods like the least cost method and the Vogel’s Approximation method are effective, achieving low initial basic feasible solution and requiring few iterations. However, as the problem size increases, the North West Corner Method tends to perform poorly in both cost and time efficiency. The Mean Descending Order of Ranking method shows promise for achieving optimal solutions quickly. Ultimately, the choice of method should be guided the specific context of the problem, including the size of dataset, the importance of minimizing costs, and the need for timely solutions. For practical applications, a hybrid approach that leverages the strengths of multiple methods may yield the best results required.
 Abstract
 Reference
 Full-Text PDF
 Full-text HTML