Leah W. Chege, Hellen W. Waititu, Cornelious O. Nyakundi
Department of Mathematics and Actuarial Science, Catholic University of Eastern Africa, Nairobi, Kenya
Correspondence to: Leah W. Chege, Department of Mathematics and Actuarial Science, Catholic University of Eastern Africa, Nairobi, Kenya.
| Email: |  |
Copyright © 2024 The Author(s). Published by Scientific & Academic Publishing.
This work is licensed under the Creative Commons Attribution International License (CC BY).
http://creativecommons.org/licenses/by/4.0/

Abstract
Mental illnesses vary from one individual to another, with the most common types being anxiety disorders, mood disorders, Psychotic disorders, eating disorders and addiction disorders. Due to their distinguishable differences, specific mode of treatments is administered as per the condition. The most common form of treatments includes psychotherapy, Medication and lifestyle medicine. This variation in the form of treatments may lead to an imbalance to the overall mental health data set. In order to deal with the class imbalance, this paper applied three families of data sampling techniques with their respective methods to a sampled data of 10,000 observations and 12 variables that was randomly sampled from a generated data composed of 1,734,982 observations. The integrated techniques were: Undersampling (Random Undersampling, Edited Nearest Neighbor, Tomek Link), Oversampling (Random Oversampling and SMOTE) and Hybridization (SMOTE-TOMEK and SMOTE-ENN). A comparison of the performance of the fore mentioned methods was done so as to select the best balancing technique. The selection was based on two types of statistical assessment metrics namely: Nominal class prediction and Scoring Prediction. Results showed that the best balancing technique was Random undersampling with its statistical measures that is Accuracy, Recall, Precision, F-score and AUC values of 1.
Keywords:
Treatment, Data balancing, Undersampling, Oversampling, Hybridization, Random undersampling, Edited Nearest Neighbor (ENN), Tomek Link, Random oversampling, Synthetic minority oversampling technique (SMOTE), SMOTE-Tomek Link, SMOTE-ENN, Area under the curve (AUC) and Receiver operating Characteristic (ROC)
Cite this paper: Leah W. Chege, Hellen W. Waititu, Cornelious O. Nyakundi, Comparative Analysis of Data Balancing Techniques in Mental Health Data: Application to Treatment Modalities, International Journal of Statistics and Applications, Vol. 14 No. 3, 2024, pp. 47-55. doi: 10.5923/j.statistics.20241403.02.
1. Introduction
Mental health is a state of mental wellbeing that enables an individual deal with the hustles of life, identify their potential, improve their productivity level and add value to the society. [12]. There are different types of mental health disorders, these are mood disorders, anxiety disorders, personality disorders, psychotic disorders, eating disorders, trauma related disorders and substance abuse disorders. These illnesses may be caused by various factors which are, genetic, drug and alcohol, biological, early life environment and trauma and stress. [13]In the past few years various platforms have been used to empower people on issues regarding mental health awareness. Although this has been done there are still challenges in alienating discrimination and stigma among those suffering from mental illness. There are various ways of dealing with mental illness, one of the ways is through an individual seeking help via treatment. Treatment is different for each type of illness, the variation may be due to personal preferences, Doctor’s recommendation, patients’ past history, the intensity of the symptoms and so on. There are three main forms of treatment that are mostly applicable namely; psychotherapy, medication and lifestyle medicine. [13]The variation in the consumption of either type of treatment may cause an imbalance to the mental health data set. This may be due to probably more cases of patients undertaking psychotherapy as compared to those taking medicine or even lifestyle medicine or vice versa. The class imbalance in the data set may lead to inaccuracies and mis-identification of the most effective form of treatment. Working on an imbalanced data may also be challenging due to the reduction of model performance, data mis-interpretation and biasness of the model may lead to incorrect conclusion or predictions. This can be dealt with by applying various data balancing techniques to the data set. Balancing of the data will help; improve model performance, reduce over-fitting of the majority class and allow accuracy in the identification of the order of the data and hence more accurate predictions.According to [1] various solutions have been given in order to deal with class imbalance. These solutions have been categorized in three major groups namely; Data sampling, Algorithmic modification and Cost-sensitive learning. This paper focuses on comparing the performance of the already existing data sampling techniques, with the aim of changing the class distribution of the data in order to deal with class imbalance. The fore-mentionedtechnique is applied to a sample of a generated mental health data set with a sample size of 10,000 observations and 12 variables. The balancing techniques are integrated in the treatment variable which focuses on only two forms of treatment, psychotherapy and Medication.The data sampling technique is categorized in three families that involves the use of distinct methods respectively. According to [1] and [2] the categories are:• Undersampling: This technique involves the extraction of instances from the majority class in order to balance the data. The three methods applied are; random under sampling, edited nearest neighbour and Tomek- Link.• Oversampling: Here balancing of the data set is achieved by either replicating some instances or creation of new instances from the existing ones. The two methods that are applied are random oversampling and synthetic minority oversampling techniques.• Hybridization: This is basically a combination of the other two techniques. In this paper only two methods under this technique are applied, they are SMOTEENN and SMOTE-Tomek Link.The most ideal technique is then selected based on its respective nominal class predictions and scoring predictions.
2. Literature Review
In order to deal with class imbalance, [1], [2], Examined various data balancing techniques that are categorized in three families namely; undersampling, oversampling, hybridization and used graphical representations to describe the techniques respective behavior.[3], performed data balancing on mental health data generated from the electronic health records of the mental health service of the Ferrara Province, Italy. This was achieved by applying three balancing techniques namely; Random Undersampling and Oversampling and Synthetic Minority Oversampling for Nominal and Continuous. Classification of the data set was then done using Waikato Environment for Knowledge Analysis Classifiers to aid in feature selection. The performance measures from the balanced data were compared to that from cost sensitive learning algorithms. The aim of balancing the data was to help find the best setting to accomplish classification tasks.[7], Used an imbalanced data consisting of Mini-Mental state Examination test responses comprising of an observation of 103 elderly patients form Chile. They aimed at exploring machine learning techniques for data balancing and classification. They applied five data balancing techniques which included: Random undersampling and oversampling, Synthetic Minority Oversampling Technique (SMOTE), SMOTETOMEK and Adaptive Synthetic Sampling algorithm (ADASYN). They also integrated eight classification algorithms these were: Naive Bayes, Support Vector Machine (SVM), K-Nearest Neighbour, Decision Trees, Random Forest, Logistic Regression, XG Boost and Multilayer perception. Findings indicated that a combination of SMOTE and Random Forest improved the accuracy of cognitive impairment diagnosis.In order to deal with data imbalance [6], developed a Multi-Layer Hybrid (MLH) balancing scheme by combining three oversampling techniques in two layers. The combination was of ADAYSN, SVM-SMOTE and SMOTE-ENN. The aim of the balancing scheme was to create a data set that will help improve machine learning models accuracy. They applied the balanced data set to Random Forest and Artificial Neutral Network Algorithms. Findings showed that the scheme gave better results as compared to other techniques.As a way to determining the most preferable treatment for common mental disorder (CMD), [4], did a study that focused on persons availing Outpatient services in a tertiary care setting in India. They explored three forms of treatment namely; Psychotherapy, Medication and Combined Treatment. The treatment, acceptability and preference measure for psychotherapy and medication was administered to fifty participants with CMDs and they were asked to indicate their preferred treatment. The results showed that psychotherapy was the most preferred mode of treatment as compared to medication while roughly half of the patients preferring it alone or as a combined treatment.[9], Evaluated the acceptability of lifestyle medicine relative to pharmacotherapy and psychotherapy and explored perceptive of people with and without lived experience of mental illness. They did a survey on Australian residents. Six hundred and forty-nine adults participated and completed the survey. The findings indicated that there was more preference on lifestyle medicine.Consumer perceptive is key in understanding the selection of a given form of treatment, with regards to this [10], did a paper that aimed at understanding the perceptive of psychotherapy among adults in USA. Data used was collected based on surveys done on current and former patients of Brightside a nationwide telehealth company and the general public. The data was based on five variables namely: gender, race, age, area of residence and income. The results showed that there was generally a favorable perception of both psychotherapy and psychotropic medication.Based on PTSD clinical guidelines (2017), [8] an article on the effective way of selecting mental disorders treatments with regards to scientific evidence and the patient’s willingness to follow through the process. Psychotherapy was more recommended to use of medication though this deferred based on the evidence.
3. Methods
This study used quantitative design in order to achieve its objective. This was carried out on a randomly sampled mental health data comprising of 10,000 observations and 12 variables. The sampled data was extracted from a generated mental health data that composed of 1,734,982 observations and 12 variables. These twelve variables were Gender, Age, Marital Status, Family members, Residence, Occupation, Medical test, Diagnosis, Cause, Treatment and Payment.1. Random SamplingRandom sampling was used in order to sample the data to a sample size of 10,000 observations.Based on (5) the steps involved:• Describing the data frame of the generated data.• State the sample size in our case 10,000 observations and use the random sampling function Sample(n) (DF, 10,000) in r programming to draw the sample from the given population.2. Data BalancingIn order to deal with class imbalance, this study applied three families of data sampling techniques and integrated their already existing respective methods, [1]. These techniques were integrated to the data set with the aim of changing its class distribution. Details of the given techniques are as describe below:(a) Undersampling techniqueUndersampling technique is also known as downsizing is one where instances from the majority class are eliminated.i. Random Under Sampling methodRandom under sampling involves balancing of the dataset by randomly eliminating examples from the negative category. Figure (1) represents an illustration of the process.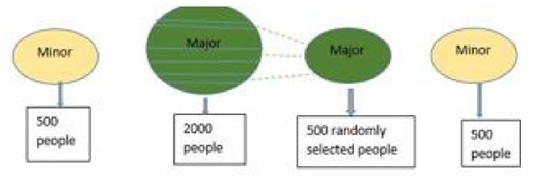 | Figure 1. Random Undersampling Demo |
ii. Tomek Link methodTomek Link is a heuristic sampling technique based on distance measurement. In Tomek Link, the connection is established based on distance between cases of two different classes, which was used to further eliminate cases of the majority class. Tomek Link conceptual work is provided below and is motivated by, (1).Suppose there are two examples: Qi and Where Qi can be presented in the form (βi, αi) and Qj can be presented in the A positive category event is randomly sort out from the train set, resulting to KNN (default 5). This is through an iterative process.• Considering differences between each neighbor and variable vectors, a given number of the K instances are randomly picked out for the evaluation of new examples by interpolation.• A random number that is between 0 and 1 is multiplied by the fore-mentioned differences and then added to the preceding variable vector.• form (βj, αj).• The distance from Qi to Qjis D which can be presented in the form d(Qi, Qj).• A duo (Qi, Qj) can be said to have Tomek Link if example Q1 does not exist resulting in d(Qi, Q1) < d(Qi, Qj) or d(Qj,Q1) < d(Qi,Qj).• Once Tomek Links are detected, the case affiliated to the majority class negative category are removed and those of the positive category are kept in the data set.iii. Edited Nearest Neighbour (ENN) methodIn ENN, cases belonging to the negative category are removed based on their K nearest neighbors. For example, if 3 neighbors are considered, the case of the negative category is compared with its 3 closest neighbors. If most of their neighbors are in the positive category, that case is removed from the dataset.(b) Oversampling techniqueIt is also known as up sizing method. This technique changes the class distribution of a data set by either replicating some instances or creating new instances from the existing one. This study integrated two of its methods. These are:i. Random Over SamplingRandom over sampling involves balancing of the dataset by randomly reproducing examples of the positive category. The following figure gives an illustration of the given process. Figure 2 | Figure 2. Random Oversampling Demo |
ii. Synthetic Minority Oversampling Technique (SMOTE)Dealing with overfitting hurdles, Chawla et al (2002). developed a new technique to synthetically create instances of a minority class.The conceptual operation of SMOTE is presented below:• The operation is performed in feature space, not data space.• The βi positive case is chosen as the basis for generating new synthetic data points.• Multiple Nearest Neighbors of the same class based on distance measure (points βi(1) to βi(4)) is selected from the training set.• New instances z1 to z4 are obtained by random interjections.The official procedure is given below.• A complete amount of up sampling N (integer) that is always approximately of ratio 1:1 category dissemination is specified.(c) Hybridization techniqueIn this technique the study applied two methods that comprised of a combination of an oversampling and under sampling technique.i. SMOTE-Tomek LinkThe procedure begins by increasing the proportion of examples in the positive category and then followed by the detection and elimination of outliers yielding a dataset that is balanced.ii. SMOTE-ENNThis technique’s first step is the reproduction of examples in the positive category by use of SMOTE algorithm. Secondly the dataset is balanced by extraction of mislabeled examples from both categories by KNN from the train set.3. Statistical test metricsStatistical test metrics was applied to both the balanced data sets so as to determine the most ideal balancing technique. Below is a summary of two predictions used in this study as test measures. (1) and (2)(a) Nominal Class PredictionNominal class prediction was achieved by doing a cross-tabulation between two classes namely the actual and predicted classes. The resulting cross tabulation is a matrix called a confusion matrix. This matrix evaluates the functionality accuracy of a given model. It is utilized in both binary and multi-class stratification hurdles for the calculation of real and forecasted values.The output values comprise of actual negative denoted as TNEG, actual positive denoted as TPOS, erroneous negative denoted as FNEG and erroneous positive denoted as FPOS.TNEG, TPOS, FPOS and FNEG indicates that the prediction were, correctly positive, correctly negative, incorrectly positive and incorrectly negative respectively. The figure below gives an illustration of the confusion matrix. Figure 3 | Figure 3. Confusion Matrix |
• AccuracyAccuracy of the model based on the confusion matrix output can be computed using the following formula | (1) |
When working with an imbalanced data accuracy can be a little bit misguiding hence the need to apply other measures that are also calculated via the confusion matrix output.• PrecisionPrecision measure begs to answer the question, that for all positive predictions how many are actually positive?It is calculated based on the formular given below: | (2) |
• RecallThis confusion matrix measures is meant to answer the question, for all positive classes how many were accurately predicted?It is calculated based on the formular given below | (3) |
• F ScoreThis is a measure that is a combination of both the positive predictive value (Precision) and the models sensitivity (recall,R) measures. Values greater than 0.7 indicates a good model. Below is a formula for calculating the F score (FS) | (4) |
(b) Scoring PredictionTwo methods were applied in this study for evaluating the scoring predictions. These methods were Receiver Operating Characteristics (ROC) and Area Under the Curve (AUC).This study applied four types of metrics; they are:• Receiver Operating CharacteristicROC (Receiver Operating Characteristic) curves are regarded as probability curves that are used to evaluate receiver performance of a classifier. False positive rate (FPOSR) also regarded as the one minus specificity value is calculated and plotted on the horizontal axis.The vertical axis is true positive rate (TPOSR) also denoted as sensitivity. The formulas for calculating FPOSR and TPOSR are given below: | (5) |
 | (6) |
• Area Under the CurveAUC (Area Under the Curve), indicates the degree of separability it takes values between 0 and 1. Classifiers whose ROC lie on the lower diagonal receive AUC values less than 0.5 while those in the leading diagonal obtain values above 0.5. An AUC of 1 indicates an ideal model, tangent to the top left section of the plot. An example of the ROC curve is shown below. Figure 4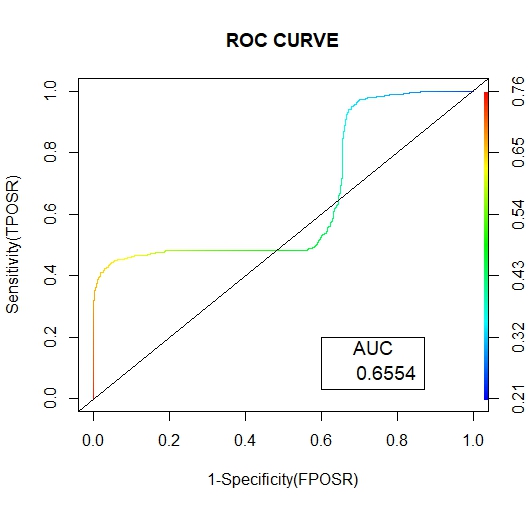 | Figure 4. ROC Curve |
4. Results and Discussion
4.1. Results
The results were tabular and graphically presented Confusion Matrix.Confusion Matrices 7, 8 and 9 below represents the confusion matrices for the three Undersampling methods namely: Random Undersampling, Tomek Link and ENN respectively.1. Training SetThe sampled data was split into two parts that is the train set and test set with observations of 80% and 20% respectively.Model development was done on the using train set while statistical performance metrics of the model was done using the test set.A summary of their specific composition is given in the two tables below. Figure (5 and 6) | Figure 5. Train Sampled Dataset |
 | Figure 6. Test Sampled Dataset |
2. Data BalancingBalancing of the data was done with reference to treatment based on three balancing techniques namely Undersampling, Oversampling and Hybridization. The figures (7 and 8) given below represents the Treatment variable Train and Test tables respectively. | Figure 7. Train Sampled Treatment Dataset |
 | Figure 8. Test Sampled Treatment Dataset |
(a) Undersampling TechniqueConfusion Matrices 7, 8 and 9 below represents the confusion matrices for the three Undersampling methods namely: Random Undersampling, Tomek Link and ENN respectively | (7) |
 | (8) |
 | (9) |
• Nominal Class Metrics Prediction Output The figure (9) below gives a combined output representation for the three undersampling methods. | Figure 9. Undersampling Test Statistics |
• Scoring Prediction OutputThe figures (10, 12 and 11) below show the graphical representation of the AUC and ROC curves for the three undersampling methods.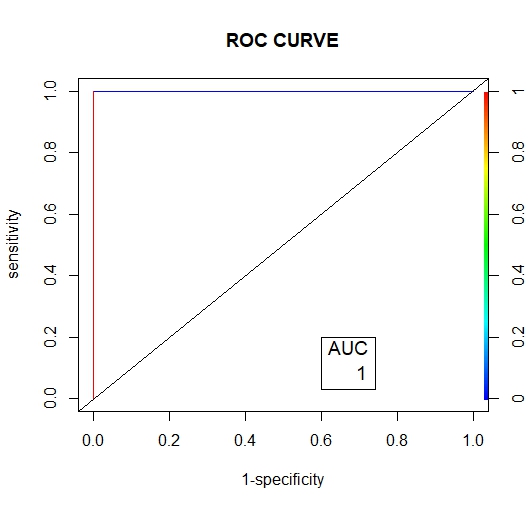 | Figure 10. Random Undersampling ROC Curve |
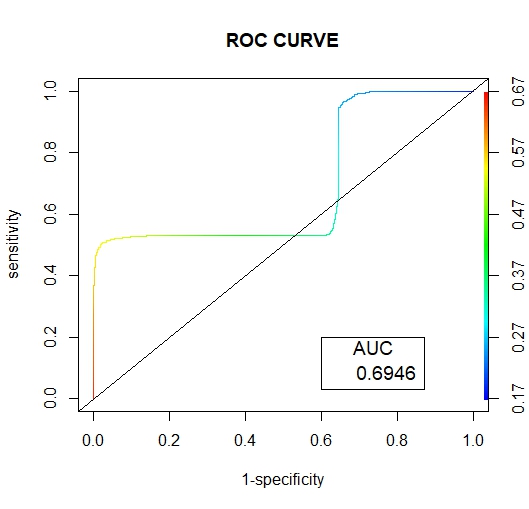 | Figure 11. Tomek Link ROC Curve |
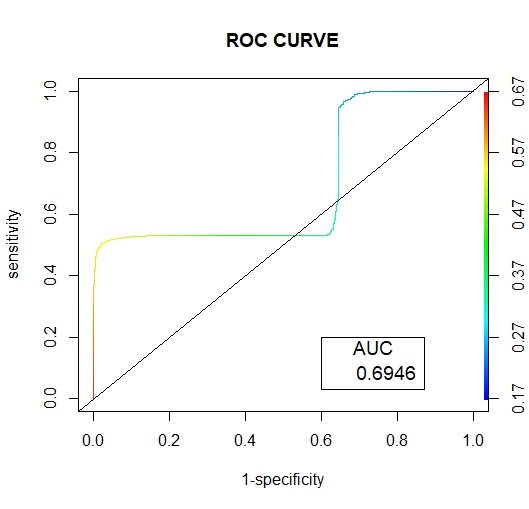 | Figure 12. ENN ROC Curve |
(b) Oversampling Technique• Confusion MatrixConfusion Matrices 10 and 11 below represents the confusion matrices for the two over-sampling methods namely: Random over-sampling and. | (10) |
 | (11) |
• Nominal Class Metrics Prediction Output The figure (13) below gives a combined output representation for the two oversampling methods | Figure 13. Oversampling Test Statistics |
• Scoring Prediction OutputThe figures (14 and 15) below show the graphical representation of the AUC and ROC curves for the two oversampling methods.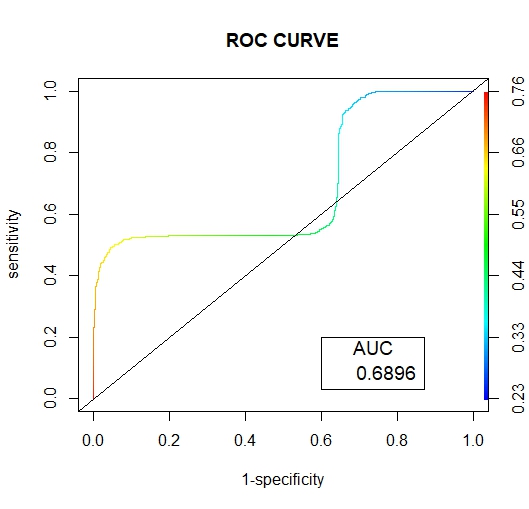 | Figure 14. Random Oversampling ROC Curve |
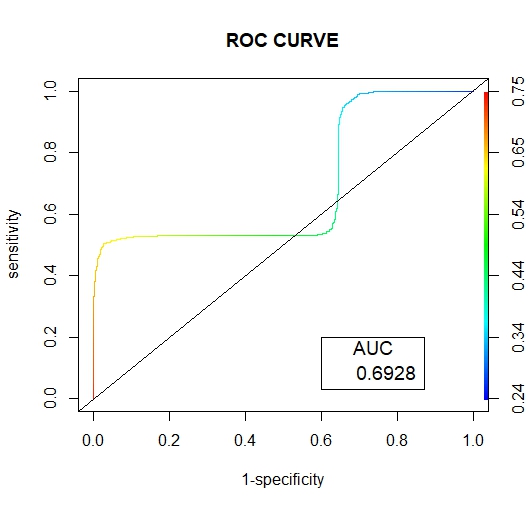 | Figure 15. SMOTE ROC Curve |
(c) Hybridization Technique• Confusion MatrixConfusion Matrices 12 and 13 below represents the confusion matrices for the two Hybridization methods: SMOTE-Tomek Link and SMOTE-ENN | (12) |
 | (13) |
• Nominal Class Metrics Prediction Output The figure (16) below gives a combined output representation for the two Hybridization methods. | Figure 16. Test Statistics Hybridization |
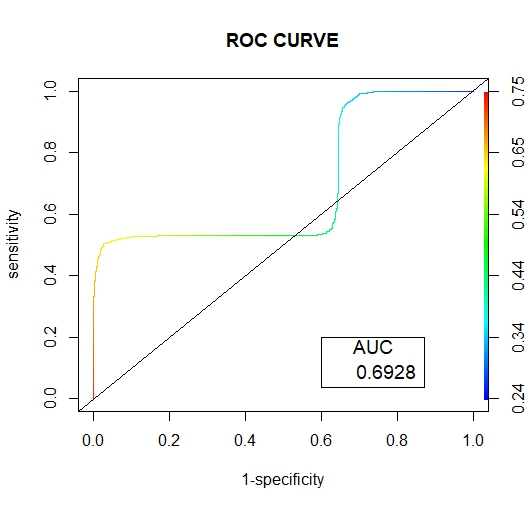
• Scoring Prediction OutputThe figures (17 and 18) below show the graphical representation of the AUC and ROC curves for the two Hybridization methods.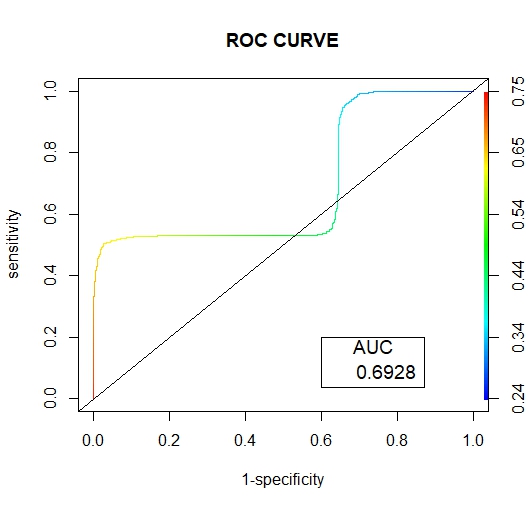 | Figure 17. SMOTE Tomek Link ROC Curve |
 | Figure 18. SMOTE ENN ROC Curve |
4.2. Discussion
Below are the results interpretation of the findings presented by the results after analysis:1. Undersampling TechniqueBased on the confusion matrix for the random undersampling method [7], from the performance measurement we note that for Ref.0, Pred.0: The model correctly predicted 0 for 1198 cases, Similarly for Ref.1, Pred.1: The model correctly predicted 1 for 802 cases. Therefore for Ref.0, Pred.1 and Ref.1, Pred.0, there are no cases where the model incorrectly predicted 1 when the true label was 0 or predicted 0 when the true label was 1. Hence the confusion matrix suggests perfect classification performance with 100% accuracy, sensitivity and specificity on the data. In regards to its AUC-ROC curve, figure (10) we note that the AUC value is 1 which means that it is good at accurately predicting the classes. Hence indicating an ideal performance.According to the confusion matrix for Tomek- Link [8] from the performance measurement it is noted that for Ref.0, Pred.0: The model correctly predicted 0 for 641 cases, Similarly for Ref.1, Pred.1: The model correctly predicted 1 for 425 cases. While Ref.0, Pred.1 and Ref.1, Pred.0 indicated that 557 and 377 cases were wrongly predicted. For the AUC-ROC curve, figure (11), we note that the AUC value is 0.6946 which is approximately 0.7 this means that the model has no discriminating capacity to distinguish between the positive and negative class good but not that ideal. Hence leading to inaccuracies of the model.The confusion matrix for ENN [9] giving the performance measurement, it is noted that for Ref.0, Pred.0: The model correctly predicted 0 for 639 cases, Similarly for Ref.1, Pred.1: The model correctly predicted 1 for 425 cases. While Ref.0, Pred.1 and Ref.1, Pred.0 indicated that 559 and 377 cases were wrongly predicted. Its AUC-ROC curve, figure (12) indicates that the AUC value is 0.6946 which is approximately 0.7 this means that the model has no discriminating capacity to distinguish between the positive and negative class good but not that ideal. Hence leading to inaccuracies of the model.The results given in [9] show that the accuracy, recall, precision and F1 score for random undersampling are all valued as 1 hence concluding that it is the best undersampling balancing technique of the three. The second best being Tomek Link with values that are slightly higher than those of ENN.2. Oversampling TechniqueAccording to the confusion matrix for random oversampling [10] from the performance measurement, it is noted that for Ref.0, Pred.0: The model correctly predicted 0 for 655 cases, Similarly for Ref.1, Pred.1: The model correctly predicted 1 for 425 cases. While Ref.0, Pred.1 and Ref.1, Pred.0 indicated that 543 and 377 cases were wrongly predicted. In regards to its AUC-ROC curve, figure (14), we note that the AUC value is 0.6896 which is approximately 0.7 this means that the model has no discriminating capacity to distinguish between the positive and negative class good but not that ideal. Hence leading to inaccuracies of the model.According to the confusion matrix for SMOTE [11] from the performance measurement, it is noted that for Ref.0, Pred.0: The model correctly predicted 0 for 653 cases, Similarly for Ref.1, Pred.1: The model correctly predicted 1 for 425 cases. While Ref.0, Pred.1 and Ref.1, Pred.0 indicated that 545 and 377 cases were wrongly predicted. For its AUC-ROC curve, figure (15), we note that the AUC value is 0.6928 which is approximately 0.7 this means that the model is good but not that ideal. Hence leading to inaccuracies of the model.The results from table (13) show that the accuracy for random oversampling is 0.54, recall is 0.5467, precision is 0.6347 and F1 score is 0.5874 which are slightly higher by a small margin to those of SMOTE technique. Therefore, making it a better model of the two oversampling methods.3. Hybridization TechniqueIn regards to the confusion matrix for SMOTE-Tomek Link [12] from the performance measurement, it is noted that for Ref.0, Pred.0: The model correctly predicted 0 for 653 cases, Similarly for Ref.1, Pred.1: The model correctly predicted 1 for 425 cases. While Ref.0, Pred.1 and Ref.1, Pred.0 indicated that 545 and 377 cases were wrongly predicted. Its AUC-ROC curve, figure (17), we note that the AUC value is 0.6928 which is approximately 0.7 this means that the model is good but not that ideal. Hence leading to inaccuracies of the model.According to the confusion matrix for SMOTE-ENN [13] from the performance measurement it is noted that for Ref.0, Pred.0: The model correctly predicted 0 for 651 cases, Similarly for Ref.1, Pred.1: The model correctly predicted 1 for 425 cases. While Ref.0, Pred.1 and Ref.1, Pred.0 indicated that 547 and 377 cases were wrongly predicted. For its AUC-ROC curve, figure (18), we note that the AUC value is 0.6928 which is approximately 0.7 this means that the model is good but not that ideal. Hence leading to inaccuracies of the model.4. Comparison of the Three Data Sampling TechniquesAccording to the statistical metrics test done using the three methods namely: under sampling, over sampling, Hybridization. Random undersampling emerge the most ideal balancing technique with its Accuracy, Precision, Recall F score and AUC values being equal to 1.In the quest of determining the best setting to accomplish classification tasks (3), performed data balancing on mental health data generated from the electronic health records of the mental health service of the Ferrara Province, Italy. This was achieved by applying three balancing techniques namely; Random Undersampling and Oversampling and Synthetic Minority Oversampling for Nominal and Continuous. These balancing techniques were integrated to three types of training sets whose ratios were; [50-50], [60-40] and [70-30] respectively. The findings showed that [50-50] random over-sampling technique was the best balancing approach.Towards the development of an Improved Balanced Random Survival Forest model, [11] applied four balancing techniques namely Random undersampling, Random oversampling, hybridization of the two techniques (random oversampling and oversampling) and SMOTE. The results showed that the model with the random undersampling method gave a better performance with an index value of 0.90.Tables (9, 13 and 16) show that balancing the data set improves the model performance this may result the reduction of inaccuracies and over-fitting pf the majority class and also give more reliable predictions.
5. Conclusions
Balancing of the data involved the use of three main methods; Undersampling, Oversampling and Hybridization. Random Undersampling technique turned out to be the best with an F-score of 1.In this study R programming software was used for the analysis of the dataset. Though the software is known for analyzing large data set, applying some of the balancing techniques on the generated data which had 1,734,982 observations was challenging. This was because of the error caused by its low memory capacity and it was also time consuming. With that a sample of 10,000 observations of the dataset was randomly selected for the analysis. Taking a sample of the data may have led to mis-representation of the larger dataset and also difficulty in ascertaining if the results are verifiable.More work can be done using other types of balancing techniques and also a different type of software e.g. Python can be used for the analysis process.
References
| [1] | Fernandez, A., Garcia, S., Galar, M., Patri, R.C., Krawczyk, B. and Herrera, F. Learning from Imbalanced data sets. Springer Nature Switzerland AG, ISBN 978-3-319- 98074-4, (2018). |
| [2] | Batista, G.E.A.P.A., Prati, R.C. and Mornard, M.C. A study of the behavior of several methods for balancing machine learning data. SIGKDD Explor. 6(1), 20- 29(2004). |
| [3] | Gentili, E., Franchini, G., Zese, R., Alberti, M., Domenicano, I. and Grassi, L. Machine Learning from Real Data: A mental health registry case study. Computer Methods and Programs in Biomedicine. 5, 100132(2024). |
| [4] | George, R.S., Mehrota, S. and Paulomi, M.S. Treatment Acceptability and Preference for Psychotherapy and Medication in Patients with Common Mental Disorders in an Indian Tertiary Care Setting. Online Journal of Health and Allied Sciences. 20(4): 7(2021). |
| [5] | Geeks for Geeks. Sample from a population using R. 2023. |
| [6] | Islam, M.T. and Mustafa, H.A. Multi layer Hybrid (MLH) balancing techniques: A combined approach to remove data imbalance. ELSEVIER, 2023. |
| [7] | Ormeno, P. Marquez, G. and Taramasco, C. Evaluation of machine learning techniques for classifying and balancing data on an unbalanced mini-mental state examination test data collection applied in Chile IEEE ACCESS, 2024. |
| [8] | PTSD clinical guidelines. How do I choose between Medication and Therapy? American Psychological Association, 2017. |
| [9] | Richardson, K., Petukhova, R., Hughes, S., Pitt, J., Yucel, M. and Segrave, R. The Acceptability of Lifestyle medicine for the treatment of mental illness: Perspectives of People with and without lived experience of Mental illness. BMC Public Health. 24: 171(2024). |
| [10] | O’ callaghan, E., Belanger, H., Lucero, S., Boston, S. and Winsberg, M. Consumer Expectations and Attitudes about Psychotherapy Survey study. JMIR Form Res. 7: e38696 (2023). |
| [11] | Waititu. H.W. Improved Balanced Random Survival Forest for the analysis of right censored data: application in determining under five child mortality. Moi University Open Access Repository, 2021. |
| [12] | WHO. Mental Health. World Health Organization. 2022. |
| [13] | Health Direct. Mental Illness. https://www.healthdirect.gov.au/mental-illness. |


 Abstract
 Reference
 Full-Text PDF
 Full-text HTML