-
Paper Information
- Paper Submission
-
Journal Information
- About This Journal
- Editorial Board
- Current Issue
- Archive
- Author Guidelines
- Contact Us
International Journal of Statistics and Applications
p-ISSN: 2168-5193 e-ISSN: 2168-5215
2024; 14(3): 41-46
doi:10.5923/j.statistics.20241403.01
Received: Aug. 17, 2024; Accepted: Sep. 10, 2024; Published: Sep. 13, 2024

Structural Margin Statistical Analysis: Effects of Reduction Factors and Statistical Noise on Performance Parameters
Phil Ligrani1, Danielle McDowell2, Shreyas Lakshmipuram Raghu1, L. Dale Thomas2
1Mechanical and Aerospace Engineering Department, University of Alabama in Huntsville, Huntsville, Alabama, USA
2Industrial & Systems Engineering and Engineering Management Department, University of Alabama in Huntsville, Huntsville, Alabama, USA
Correspondence to: Phil Ligrani, Mechanical and Aerospace Engineering Department, University of Alabama in Huntsville, Huntsville, Alabama, USA.
| Email: |  |
Copyright © 2024 The Author(s). Published by Scientific & Academic Publishing.
This work is licensed under the Creative Commons Attribution International License (CC BY).
http://creativecommons.org/licenses/by/4.0/

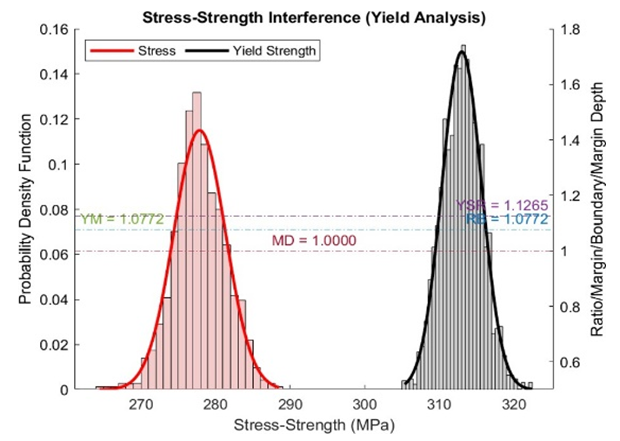
A structural evaluation method employed to provide components with minimal likelihood of failure, and to compensate for design shortcoming is structural margin or SM analysis. The SM approach is advantageous because the approach can potentially reduce the number of physical tests required to characterize a system. Within the present investigation, considered are the consequences of altering reduction factor parameters a and b, and a noise parameter c on structural margin performance parameters, which include yield margin YM, reliability boundary RB, yield stress ratio YSR, margin depth MD, and mean allowable stress MAS. The effects of reduction factors a and b, and the noise parameter c are considered for this analysis as they affect the mechanical strength characteristics of Al 2024-T6. The a and b reduction parameters are used in particular to quantify potential material property degradation of such a component. Three collections of test cases are considered with different values of the a, b, and c parameters, wherein one parameter is varied, while the remaining two are kept constant. Overall, the present results are the first to show that the structural margin performance parameters considered show complex dependencies as each of the a, b, and c parameters is varied independently.
Keywords: Structural Margin Analysis, Yield Analysis, Reduction Factors, Statistical Noise, Material Property Degradation
Cite this paper: Phil Ligrani, Danielle McDowell, Shreyas Lakshmipuram Raghu, L. Dale Thomas, Structural Margin Statistical Analysis: Effects of Reduction Factors and Statistical Noise on Performance Parameters, International Journal of Statistics and Applications, Vol. 14 No. 3, 2024, pp. 41-46. doi: 10.5923/j.statistics.20241403.01.
Article Outline
1. Introduction
- In the design and development of many engineering components, critical failures often occur because of the inadequacy of structural margins and material strength. Design programs typically adopt the Factor of Safety approach (FoS) to address these issues and to provide components with adequate safety characteristics. A FoS value is generally computed based upon an evaluation of the strength characteristics of a particular system or its components. As such, in general, Factor of Safety (FoS) is determined analytically as the ratio of a structure's absolute strength (structural capability) to actual applied load. As such, FoS gives a measure of the reliability of a particular design. Some sources refer to Factor of Safety determined in this manner as a Realized Factor of Safety. Note that NASA Strength and Life Assessment Requirements for Liquid-Fueled Space Propulsion System Engines provide guidelines for appropriate FoS values to compensate for design shortcomings and to provide components with minimal likelihood of failure [1]. Factor of Safety requirements are applicable to a variety of different aerospace components, including ones associated with rocket engines.To develop a FoS, test-to-failure (TTF) programs are additionally often employed to evaluate the structural capabilities of a system or its components [2]. These procedures are employed to gather strength data over a sufficient range of experimental conditions in order to provide a comprehensive assessment of possibility of failure. Test-fail-fix (TFF) procedures are one of many methods employed to troubleshoot complications and eliminate failure modes during the development of engineering components, especially ones which are employed within the aerospace industry [3,4,5]. TFF cycles involve rigorous testing early in the development of a component to reveal and address defects through progressive improvement. While insightful and useful, extensive application of TTF and TFF programs can heavily increase the overall cost and time spent advancing system development.Another structural evaluation method employed to provide components with minimal likelihood of failure, and to compensate for design shortcoming is structural margin analysis [6,7]. In contrast to set FoS values, structural margins or SM’s are expressed as the number of standard deviations present between the average strength and maximum stress applied. According to Lusser [2]. the principle of safety margins to provides increased design reliability and optimized performance by minimizing the potential for stress to exceed strength. He also indicates that, with the SM approach, characteristic variations of applied stress and material strength are used to generate suitable safety margins. According to Raghu et al. [8], many deficiencies are associated with Factor of Safety (FoS) analysis and design tools and approaches. As a consequence, these investigators provide and recommend SM based analysis procedures in order to improve upon more traditional Factor of Safety approaches. Such SM analysis methods aim to reduce structural failures through probabilistic determination of the stress-strain data, as employed with a stress-strength interference technique.The SM approach is advantageous because, rather than relying on the results of extensive TTF and TFF cycles, the approach can potentially reduce the number of physical tests required to characterize a system. This is achieved by employing an elastoplastic finite element model, Markov Chain Monte Carlo simulation, and a Bayesian inference module, which may all be executed prior to required testing. The combined results of these methods enable the calculation of safety margins and a reliability boundary, as outlined in Lusser’s [2] work, in addition to stress strength ratios which serve as a comparison to traditional FoS values. With the SM approach, material property data, which once required iterative physical testing, can now be obtained through probabilistic methods. In addition, when optimized using this approach, failures induced by applied stress exceeding material strength are completely avoided. The method also generates useful data that is predictive of material strength and load responses. Because data variation and dispersion are considered within the analysis, SM analysis can also lead to an improved understanding of the overall uncertainty associated with designs involving additively manufactured components. Use of such a SM tool may also lead to reduced rework cycles, streamlined verification, and long-term affordability.
2. Structural Margin Analysis
- The first step of structural margin or SM analysis involves an elastoplastic finite element model to calculate the nominal parameters for Al 2024-T6. A simple 1D rod is used as the finite element. Incremental load application formulas are applied to characterize the response of the rod under uniaxial tensile loads. The resulting parameters include Young’s modulus E, yield stress Sy, strength Su, and fracture strain ϵu, where the first two of these parameters are the most useful for SM analysis. Considering the development and design of modern engineering components and systems, potential material property degradation is an important consideration. With the present analysis approach, such degradation is quantified by incorporating reduction parameters, a and b, as these are applied to Young’s modulus E and yield stress Sy. The use of these parameters is illustrated by the equations which are given by
 | (1) |
 | (2) |
 | (3) |
 | (4) |
 | (5) |
 is the mean allowable stress or MAS, and
  is the mean yield stress. To address potential failures and characterize the interference of stress and strength distributions, useful is a margin depth MD variable. Also relevant is the yield stress ratio YSR, which is expressed as the ratio of the mean yield stress to the mean allowable stress MAS. MD and YSR are then given by
 | (6) |
 | (7) |
3. Present Investigation
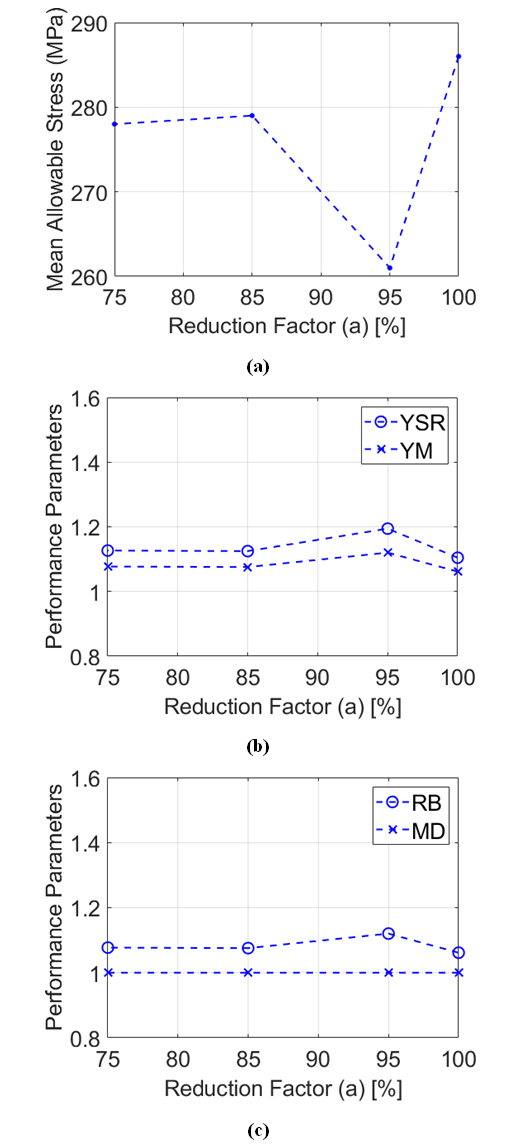
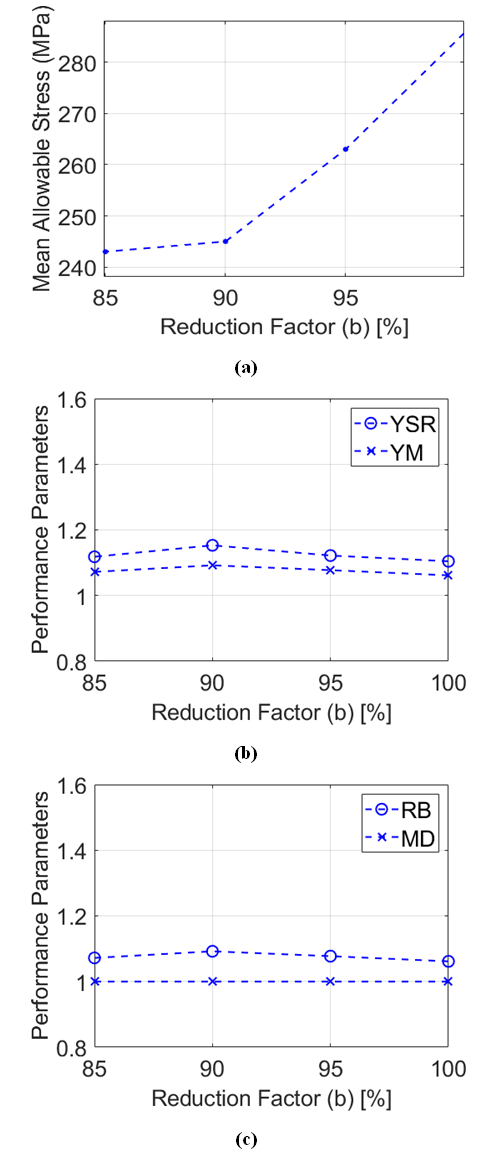
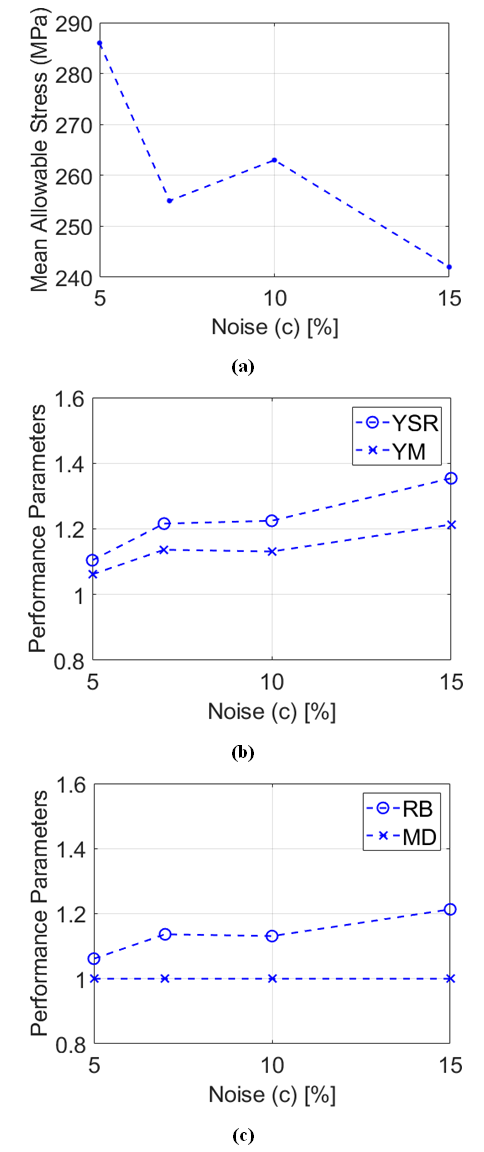
- The present work considers the effects of reduction factors a and b, and added noise, as quantified with the c parameter, on the mechanical strength characteristics of Al 2024-T6. Note that variations of the noise parameter c models and simulates the scatter and uncertainties that are associated with physically obtained data. Of particular focus are the consequences of altering these parameters on yield margin YM, reliability boundary RB, yield stress ratio YSR, margin depth MD, and mean allowable stress MAS. As discussed, all of these parameters are related to values and variations of Young’s modulus E, yield stress Sy, strength Su, and fracture strain ϵu. Changing the a, b, and c parameters thus alters stress-strain relationships, and the performance parameters associated with SM analysis. Three collections of test cases are considered, wherein one parameter is varied, while the remaining two are kept constant. For the first test case set, a is set equal to 100, 95, 85, and 75 percent, b is maintained constant at 100 percent, and c is maintained constant at 5 percent. For the second test case set, a is maintained constant at 100 percent, b is set equal to 100, 95, 90, and 85 percent, and c is maintained constant at 5 percent. For the third test case set, a is maintained constant at 100 percent, b is maintained constant at 100 percent, and c is set equal to 15, 10, 7, and 5 percent.The present assessment of the influences of the a, b, and c parameters on SM performance metrics highlights the effectiveness and utility of this analysis approach in regard to determination of the probability of mechanical failure. As such, the present results provide insights into the physical effects of noise parameter c and reduction parameters a and b on the mechanical stress and strain characteristics of an Al 2024-T6 component. Information on consequences of changes to Young’s modulus E and yield stress Sy are thus also provided, as they influence mechanical structure stress and strain characteristics, as these are quantified using yield margin YM, reliability boundary RB, yield stress ratio YSR, margin depth MD, and mean allowable stress MAS.
4. Analytical Statistical Results
- Examples which show characteristics of SM analysis metrics when the reduction parameters, a and b, and noise c are varied are illustrated by the data presented within Figures 2, 3, and 4. Each of these figures shows variations of mean allowable stress MAS (part a), yield margin YM (part b), yield stress ratio YSR (part b), reliability boundary RB (part c), and margin depth MD (part c). Within Figure 2, these data are provided as a is set equal to 100, 95, 85, and 75 percent, b is maintained constant at 100 percent, and c is maintained constant at 5 percent. Within Figure 3, these data are provided as a is maintained constant at 100 percent, b is set equal to 100, 95, 90, and 85 percent, and c is maintained constant at 5 percent. Within Figure 4, these data are provided as a is maintained constant at 100 percent, b is maintained constant at 100 percent, and c is set equal to 15, 10, 7, and 5 percent.
5. Summary and Conclusions
- The present study considers structural margin or SM analysis, which is a structural evaluation method employed to provide components with minimal likelihood of failure, and to compensate for design shortcomings. The SM approach is advantageous because the approach can potentially reduce the number of physical tests required to characterize a system. The present work is focussed on the effects of reduction factors a and b, and added noise, as quantified with the c parameter, on the mechanical strength characteristics of Al 2024-T6. Here, reduction parameters, a and b are used to quantify potential material property degradation of the associated component. Of particular interest are the consequences of altering these parameters on structural margin performance parameters, which include yield margin YM, reliability boundary RB, yield stress ratio YSR, margin depth MD, and mean allowable stress MAS. Three collections of test cases are considered with different values of the a, b, and c parameters, wherein one parameter is varied, while the remaining two are kept constant. Overall, the structural margin performance parameters considered show complex dependencies as each of the a, b, and c parameters is varied independently. As such, the results presented within the present paper are the first within published literature which are determined using structural margin analysis to illustrate this dependence. Also provided are insights into the physical effects of these parameters on the mechanical stress and strain characteristics of an Al 2024-T6 component. The resulting assessment of the influences of the a, b, and c parameters on structural margin performance metrics highlights the effectiveness and utility of this analysis approach in regard to determination of the probability of mechanical failure. Note that the present analysis approach, as employed for structural margin performance analysis, is also applicable to other technical performance quantifications, including ones associated with electrical system power production variation with demand, and pointing accuracy capability variations with required accuracy.
ACKNOWLEDGEMENTS
- Associate Professor Gang Wang is acknowledged for his guidance in regard to several aspects of the structural margin analysis techniques presented within the present paper.
 Abstract
 Reference
 Full-Text PDF
 Full-text HTML


