Oladipupo B. Ipadeola 1, Kamil D. Ajagbe 2, Adetunji K. Ilori 3, Timothy A. Attah 4, Abiodun F. Ipadeola 5, Emmanuel T. Jolayemi 1
1University of Ilorin, Ilorin, Nigeria
2Nasarawa State University, Keffi, Nasarawa State, Nigeria
3National Mathematical Center, Abuja, Nigeria
4National Space Research and Development Agency, Abuja, Nigeria
5Covenant University, Otta, Ogun State, Nigeria
Correspondence to: Oladipupo B. Ipadeola , University of Ilorin, Ilorin, Nigeria.
| Email: |  |
Copyright © 2023 The Author(s). Published by Scientific & Academic Publishing.
This work is licensed under the Creative Commons Attribution International License (CC BY).
http://creativecommons.org/licenses/by/4.0/

Abstract
One of the widely used approach for estimation of impact in experimental intervention is the Difference in Differences (DID) Regression which depends on assumptions that are often violated in real life. This study provides a Bayesian DID estimation alternative to the classical DID regression approach when the outcome variable is count. The performance of the two approaches was examined using simulated and real-life data. For the proposed Bayesian DID estimation approach, the distribution of the difference of differences of outcome among out those exposed to intervention (treatment group) and those not exposed (control group) before and after the intervention, was derived using the convolution process. The resulting distribution was a 4 parameter Skellam distribution. The likelihood of the Skellam distribution was combined with Gamma and Power priors independently to determine the posteriors. All the posterior distributions derived were intractable and parameter estimation was carried out using the Metropolis Hasting Algorithm. The impact estimates obtained from Bayesian DID estimation method using simulated data were closer to the true value and had lower Mean Squared Error than those obtained from classical DID regression approach. Result from Bayesian DID estimation approach with Power prior provided a realistic impact estimate with the lowest Mean Squared Error compared to other methods. This study revealed that impact estimated using classical DID regression overstate the reality.
Keywords:
Bayesian, Difference in Differences, Impact, Estimation, Prior, Posterior, Intervention
Cite this paper: Oladipupo B. Ipadeola , Kamil D. Ajagbe , Adetunji K. Ilori , Timothy A. Attah , Abiodun F. Ipadeola , Emmanuel T. Jolayemi , Bayesian Method for Difference in Differences Estimation of Impact in Experimental Interventions with Count Outcome, International Journal of Statistics and Applications, Vol. 13 No. 1, 2023, pp. 1-12. doi: 10.5923/j.statistics.20231301.01.
1. Introduction
In experimental interventions, decisions are made from analysis of panel data derived by collecting data from two or more time periods, before and within/after an intervention, from a group of individuals who were exposed to the intervention compared to a similar group of individuals that were not exposed to the intervention. Experimental intervention provides the approach for determining the “Average treatment effect” and the “Average effect of treatment on the treated”. The average treatment effect is the average impact of the program across all the subjects in the population of interest [1]. Estimation of the average treatment effect otherwise known as impact is often conducted using classical approaches. One of the widely adopted approach is the Difference in Difference Regression. Bayesian estimation is similar to maximum likelihood in the ability of these two methods to estimate random and fixed variables [2]. However, it differs from maximum likelihood in that the posterior probability is maximized rather than likelihood function. This is given by the function of the likelihood multiplied by the prior distribution of the posterior probability. In this case, Bayesian estimate addresses the complexities of maximum likelihood. Bayesian estimate bypasses the need for the design of likelihood function and have computational tools that can essentially be used for simple statistical techniques. Bayesian largely depends on all useful information and utilizes prior information in its estimations. Therefore, this method is most ideal when prior information is available compared to maximum likelihood which ignores prior information in its parameters.Bayesian method is not commonly used in drawing inferences in experimental interventions due to two major reasons. First, except for the simplest applications, Bayesian analyses are computationally difficult and were infeasible until fast computers and simulation-based methods were developed. Second, it can be difficult to settle on a prior that is widely accepted [3]. However, the advantages of Bayesian approach over classical approach are well documented in literatures [3-5]. A previous study has presented the procedure for estimating impact using the Bayesian Difference in Difference estimation alternative to the Bayesian regression and classical regression methods when the outcome variable is continuous and from normal distribution [6]. This paper describes the procedure for estimating impact using the Bayesian Difference in Difference estimation alternative to the Bayesian regression and classical regression methods when the outcome of interest is count and from Poisson distribution.
2. Material and Method
Suppose events are occurring randomly and uniformly in time. The events occur with a known average. Let Y be the number of events occurring in a fixed period. Then, Y will have a Poisson distribution with parameter  such that,
 | (1) |
The intensity parameter,  , represents the expected number of occurrences in a fixed period i.e.
  It is also the variance of the count:
2.1. Classical Difference in Differences Regression Approach
Let  be the count of events and follows Poisson distribution with parameter
  . If we have two independent groups, treatment and control, before program implementation, denote count of events in the control group and the treatment group as
  and
and  with means
  respectively, and at the end of program implementation, we denote the count of events as
  and
and  with means
  respectively. If:
 and
and  From the generalized linear model
 To determine the impact of the intervention, the model to estimate is:
  | (2) |
Where, P is the Program status, T is time,  and
and  are model parameters and
  is the coefficient of the interaction between Program status and Time, which is the impact parameter. In treatment group
 - At Baseline:
 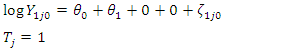 | (3) |
- At Follow-up:  | (4) |
Taking the difference (4) and (3):  | (5) |
 | (6) |
In control group  - At Baseline:
 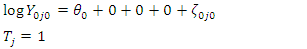 | (7) |
- At Follow-up:  | (8) |
Taking the difference:  | (9) |
 | (10) |
Now, the difference in differences is given by  | (11) |
 | (12) |
 | (13) |
Therefore, 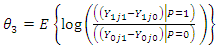 | (14) |
 And
And The percentage transformation of the impact is obtained by
 | (15) |
Thus, the difference in difference estimator  directly approximates the causal treatment effect where
  is the transformation from log points to percentage points [7].
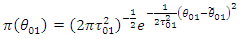
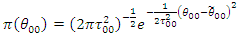
2.2. Bayesian Difference in Differences Regression Approach
The Bayesian equation provides a probability distribution of  given observations of the data
  In this equation,
  is the sum (or integral) of
  over all possible values of
  Therefore,
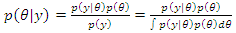 | (16) |
Where:  denote the posterior distribution of the parameter
  is the likelihood function
  is the prior distribution of which express our beliefs about the parameters, before observing the data
 is called the marginal likelihood and plays the role of the normalizing constant of the density of the posterior distribution.For
 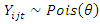 If there exist a conjugate prior
  Given that the likelihood of y is
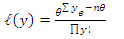 | (17) |
If the prior distribution is given as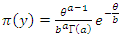 | (18) |
Then the posterior distribution is derived as follows: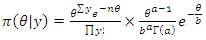 | (19) |
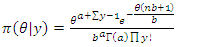 | (20) |
 | (21) |
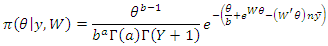
Therefore,  | (22) |
 | (23) |
2.2.1. Choice of Prior
In many observational and experimental studies with count response data, choice of prior is often subjective [8,9]. However, use of variants of normal distribution priors for Poisson response variable is very popular and widely adopted. [10,11]. This study explored power, gamma priors and Uniform prior to estimate average treatment effect in the Bayesian context.Using Power prior, suppose the information on number of months of breastfeeding from a past infant and young child feeding intervention is denoted by  and follows Poisson distribution with
  such that:
 If a similar intervention is carried out recently and the number of months of breastfeeding denoted by
  , is observed to follow Poisson distribution, that is:
 From the Exponential family of distribution:
 where,
 and W is a matrix of covariates. Let
  be from Poisson distribution
 | (24) |
and  | (25) |
 | (26) |
For a particular event outcome  Suppose we have an historical data
  from that same event
 Suppose we apply Bayesian method in analyzing
 | (27) |
which is a power prior for  In analyzing the present data using the historical model in then,
  | (28) |
 | (29) |
where  is the weight of the historical data. If one historical data is used, then
 Note In this study, the historical data,
 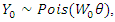 and
and 
 | (30) |
The likelihood is, | (31) |
And the prior is | (32) |
Therefore, the posterior distribution which is the power prior is given by: | (33) |
where  For the present data
  also
also 
 | (34) |
with likelihood | (35) |
The posterior distribution using power prior is given by: | (36) |
Note:  and
and  The posterior distribution is intractable since the prior is a non-conjugate prior. Estimation of the posterior distribution was carried out using Metropolis Hasting Algorithm.
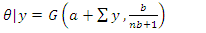
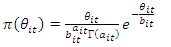
2.2.2. Posterior Distribution Using Gamma Prior
The prior information  is from a Gamma with,
 The posterior distribution is:
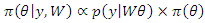 That is,
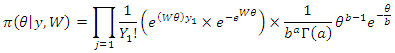 Therefore, the posterior distribution for
  using
using 
 The posterior distribution derived is intractable. Estimation of the posterior distribution will be carried out using Metropolis Hasting Algorithm.
2.2.3. Posterior Distribution Using Uniform Prior (Non Informative Prior)
Recall that:  And
And So, the regression model is
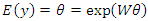
 | (37) |
 The posterior distribution is,
 | (38) |
Since 
 | (39) |
which is the posterior distribution of the impact using uniform prior.
2.2.4. Posterior Distribution Using Beta Prior (Non Informative Prior)
Given that, | (40) |
The posterior distribution is, | (41) |
Since  and
and 
 | (42) |
which is the posterior distribution of the impact using beta prior.
2.3. The Bayesian Difference in Differences Estimation Approach
Define: – Count variable from Poisson distribution describing the outcome of interest, Such that:
  where:
 – outcome of interest before intervention among those exposed to intervention (baseline)
 – outcome of interest after intervention among those exposed to intervention (follow-up)
 – outcome of interest before intervention among those not exposed to intervention (baseline)
 – outcome of interest after intervention among those not exposed to intervention (follow-upThe difference in difference denoted by d is given by [1] (Lance et al., 2014):
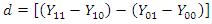 where,
 – Difference in DifferenceRecall that
  – count random variable from Poisson distribution describing the outcome of interest and
  is the impact parameter.Among those exposed to intervention:
 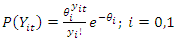 | (43) |
where  At baseline,
 | (44) |
At endline,  | (45) |
The joint distribution is given as: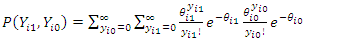 | (46) |
Let  such that:
  Therefore,
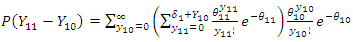 | (47) |
Substitute  for
for 
 | (48) |
i.e. 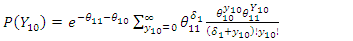 | (49) |
which is a modification of the Bessel function,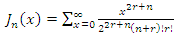 | (50) |
Hence,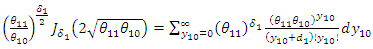 | (51) |
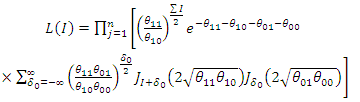
Therefore, the distribution of the difference in outcome before and after intervention among the intervention group is: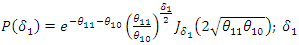 | (52) |
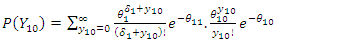
which is a Skellam distribution, where,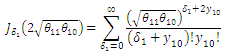 Let
Let  denote the difference in outcome before and after intervention among the comparison group. It follows from (51) that:
 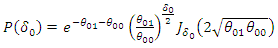 | (53) |
where,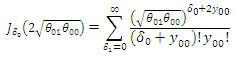 Therefore, if
  denote difference in difference such that:
 and substitute
  in (52)Then,
 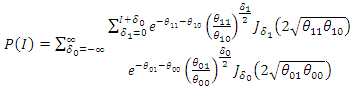 | (54) |
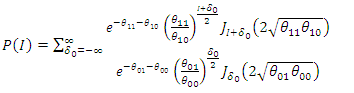 | (55) |
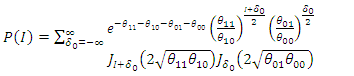 | (56) |
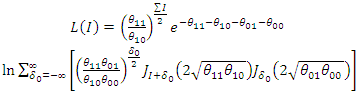
Therefore, the distribution of the difference of differences is given by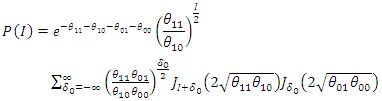 | (57) |
where: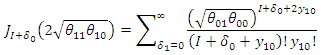 and
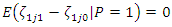
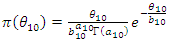
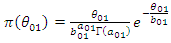
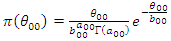
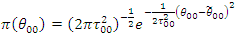
and Hence, the distribution of the difference in difference for count outcome from Poisson distribution is a 4-Parameter Skellam distribution with mean
 And variance
  The likelihood of
 | (58) |
 | (59) |
 | (60) |
For 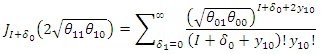 and
and 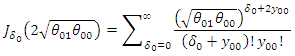 Therefore,
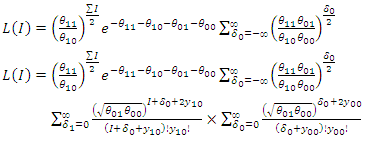
2.3.1. Posterior Distribution Using Gamma Prior
The prior distribution for the 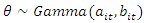
 | (61) |
and, these are: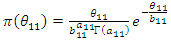 | (62) |
 | (63) |
 | (64) |
 | (65) |
The joint prior distribution is: | (66) |
Given that, | (67) |
Such that 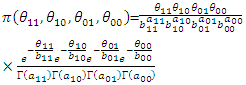 | (68) |
and the posterior distribution is: 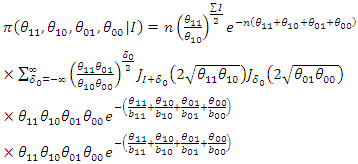 | (69) |
The posterior distribution derived is intractable. Estimation of the posterior distribution will be carried out using Metropolis Hasting Algorithm.
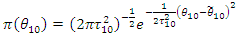
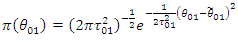
2.3.2. Posterior Distribution Using Normal Prior
Given that: | (70) |
The prior distribution: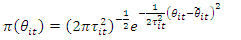 | (71) |
is given by: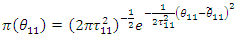 | (72) |
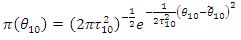 | (73) |
 | (74) |
 | (75) |
The joint prior distribution is | (76) |
Given that,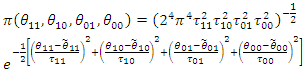 | (77) |
 | (78) |
Such that: | (79) |
The posterior distribution derived is intractable. Estimation of the posterior distribution was carried out using Metropolis Hasting Algorithm.
2.3.3. Posterior Distribution Using Power Prior
In this case, the historical data information  with likelihood,
  . Therefore, the prior distribution for the multiple of likelihood of the historical data
  where
where  is the weights of the historical data which may be determined by different number of data historical data available and
  prior information of the parameter [12]. If the historical data is from the same distribution as current data and the prior information of the parameter follows:
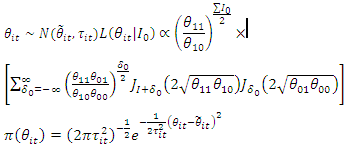 | (80) |
and, these are: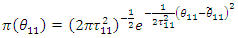 | (81) |
 | (82) |
 | (83) |
 | (84) |
The joint prior distribution is | (85) |
For  that is using only one historical data, we have
 | (86) |
and therefore, the power prior is as follows: 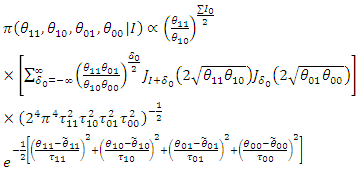 | (87) |
and the posterior distribution using the power prior (230) is as follows: Where
Where  So,
So,  The posterior for the impact for count using the power prior is:
 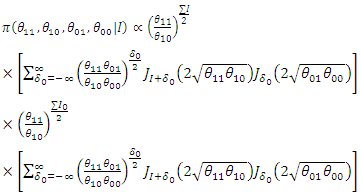 | (88) |
The posterior distribution derived is intractable. Estimation of the posterior distribution was carried out using Metropolis Hasting Algorithm.
2.4. Data and Prior Information
Simulated and real-life data were used in this study. Prior information was determined based on literature search.Using simulated data, the outcome variable  was simulated as a count outcome data type from Poisson distribution, with sample size of 40. The Bayesian estimation was carried out using Metropolis-Hastings algorithm. The posterior distributions considered are based on Gamma prior. Using 10000 iterations, the posterior mean, bias and Mean Squared Error (MSE) are reported. The report was recorded at various prior parameters
  where;
 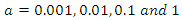 and
and 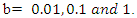 The parameters used for the simulations of count data are from Poisson distribution with parameter
  for program group at follow-up, Poisson distribution with parameter
  for program group at baseline, Poisson distribution with parameter
  for comparison group at follow-up and Poisson distribution with parameter
  for comparison group baseline.Using real life data, the posterior distribution for Poisson distributed count response data was estimated using data from an Infant and Young Child Feeding and Nutrition intervention in North East Nigeria. Data was available number of months of breastfeeding from initiation to termination. The response variable is the number of months of breastfeeding among those who participated in a Breastfeeding Support Group Program (BFSG) and those who did not. Mothers were followed up for at least two years from delivery of the reference child. Breastfeeding was defined as Breast milk (including milk expressed or from a wet nurse given to a child on demand [13]. Controls were selected among mothers in different communities who did not participate in the breastfeeding support program. The objective of the study was to determine the impact of breastfeeding support program on duration of breastfeeding among mothers who participated in breastfeeding support groups and those who did not.
2.5. Prior Information on Breastfeeding Interventions
The WHO recommended breastfeeding from age 0 to 23 months as part of the Infant and Young Child Feeding Policy. However, several challenges prevent breastfeeding in Nigeria. Hence, several interventions are being carried out to increase the duration of breastfeeding. Many of these programs often were only able to improve overall duration of breastfeeding by a small percentage. In a systematic review to determine effective approaches to Social and Behavior Change programs for reducing stunting and Anemia [14]. From this review, the following studies were analyzed and formed basis for determining the hyperparameter for the prior distribution [14]. A study was conducted among breastfeeding mothers in Vietnam on impact of Counseling in homes and group education in communities on number of months of breastfeeding [15]. The study revealed an increase in the mean duration of breastfeeding from 16.6 before the intervention to 16.8 after intervention. Also, another study provided result of impact evaluation of a breastfeeding counselling and support group program in Turkey [16]. The program increased duration of breastfeeding from 17.83 months before intervention to 21.17 after intervention. As presented in another study conducted to determine impact of breastfeeding counselling in homes and health facilities in Turkey, the mean duration of breastfeeding increased from 12.1 months before the intervention to 15.1 months after the intervention [17]. Based on the result, a range of values for the hyper-parameter was determined as (0<θ<1), with specific point estimate of the mean at 0.24, representing 24% increase in number of months of breastfeeding [17].
2.6. Statistical Data Analysis
Estimation of Posterior distribution was carried out using R, a statistical computing and graphics software developed by Bell’s laboratory based on the ‘S’ system. This software is widely used among statisticians and is considered the most robust statistical software for statistical analysis. A standard result of a closed form posterior distribution exists for the Poisson model without covariates. However, no conjugate prior exists for the (k × 1) parameter vector β in the Poisson regression model. Hence parameter estimation will be conducted by evaluation of the exact posterior distribution using the Metropolis Hasting Algorithm [18]. The Metropolis Hasting Algorithm is a special type of Markov chain Monte Carlo (MCMC) approach that allows for the estimation of posterior distributions in Bayesian statistics through simulation [18].
2.7. Comparison of Result from Bayesian and Classical Procedures
In Statistics, Mean Squared Error (MSE) is defined as Mean or Average of the square of the difference between actual and estimated values. The mean square error (MSE) of an estimator  of a parameter θ is the function of
  defined by
  . The MSE measures the average squared difference between the estimator
  and the parameter
  which is considered a reasonable measure of performance for an estimator. MSE is used to check how close estimates are to actual values. Hence, the lower the MSE, the closer is the estimate to the actual. The most common risk function used for Bayesian estimation is the mean square error. MSE is a useful tool for comparing estimate from Bayesian and classical procedures [19-21].
3. Result
3.1. Result from Simulated data
Using simulated data, the mean of the posterior distributions at different values of  were computed. This section presents the result of analysis. Decision is based on Minimum Mean Squared Error
Table 1. Result of classical approach (Poisson regression)
 |
| |
|
Table 2. Bayesian regression with Gamma Prior
 |
| |
|
Table 3. Result of Bayesian regression with Power prior
 |
| |
|
Table 4. Result of Bayesian estimation with Gamma prior
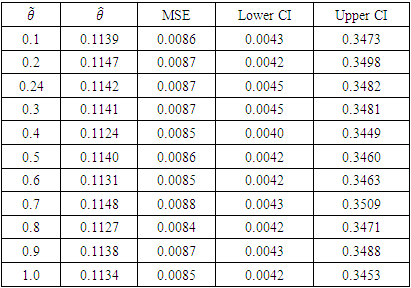 |
| |
|
Table 5. Result of Bayesian estimation with Power prior
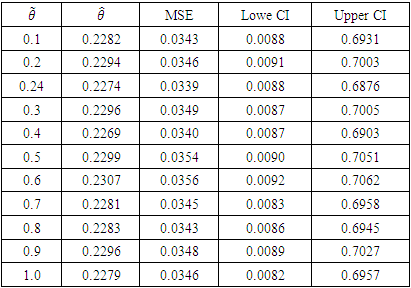 |
| |
|
Given that the true value for the impact parameter  from simulated data is 0.25, it was observed that the result derived from the proposed Bayesian DID estimation is closest to the true value compared to the existing classical approach as presented in table 6 and figure 1.
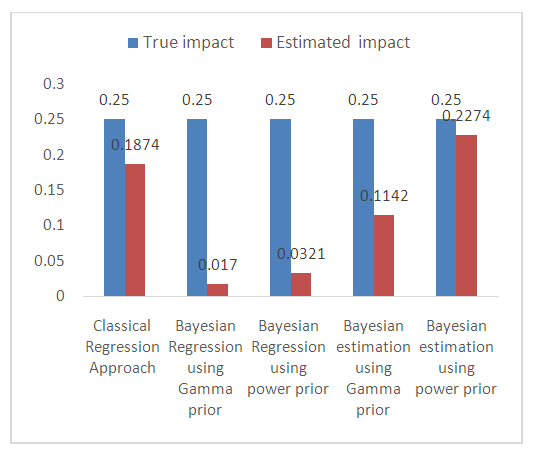 | Figure 1. Comparison of true value and estimated value of impact based on proposed and existing approaches for count outcome using simulated data |
Table 6. Comparison between result from classical and Bayesian procedures for count outcome based on simulated data
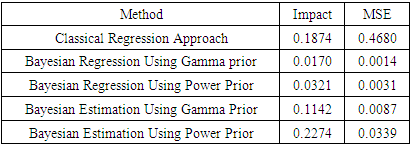 |
| |
|
3.2. Result from Real Life Data
Table 7. Summary of data
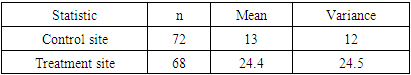 |
| |
|
From table 7, the data suggest the outcome variable may have come from a Poisson distribution evidenced by the similarity between the mean and variance. Hence a Poisson regression analysis was carried out. Table 8 provide result from the logistic regression.Table 8. Result from the classical approach (Poisson regression)
 |
| |
|
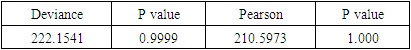
The deviance statistic and the Pearson statistic are provided in table 9.Table 9. Result of goodness of fit test
 |
| |
|
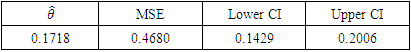
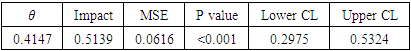
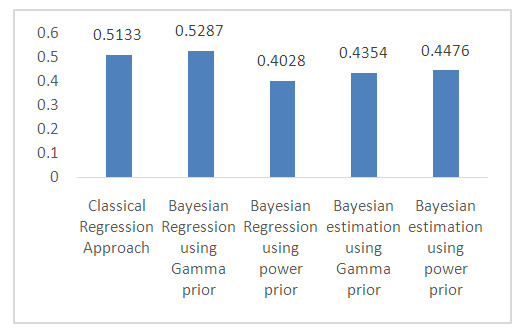
Result of the goodness of fit test revealed that the model fit the data suggesting that data used is from Poisson distribution. The impact estimate is obtained as 0.4147, with 0.0616 MSE, and observed to be significant (p<0.001) at 5% level of significance. This implies that participation in Breastfeeding Support Group (BFSG) increases number of months of breastfeeding by about 51.3% (P<0.001).
3.3. Result of Bayesian Regression Using Gamma Prior
Bayesian analysis was carried out using Gamma prior. Table 10 provides result of the analysis. Table 10. Result of Bayesian regression using Gamma prior
 |
| |
|
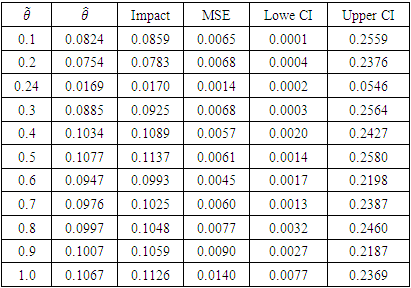
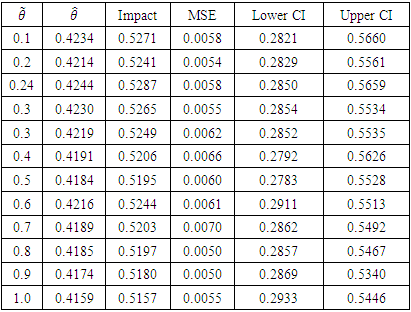
The impact estimate obtained at  is 0.4244, with MSE 0.0058. This implies that participation in Breastfeeding Support Group (BFSG) increases number of months of breastfeeding by about 53% over baseline values.
3.4. Result of Bayesian Regression Using Power Prior
Bayesian analysis was carried out using power prior. Historical data for the power prior distribution was obtained from a similar study conducted in Borno state in 2018 among a different population. Table 11 provides result of the analysis. Table 11. Result of Bayesian analysis using power prior
 |
| |
|
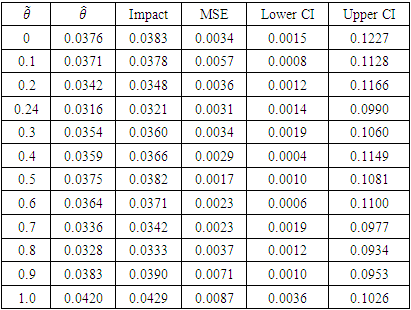
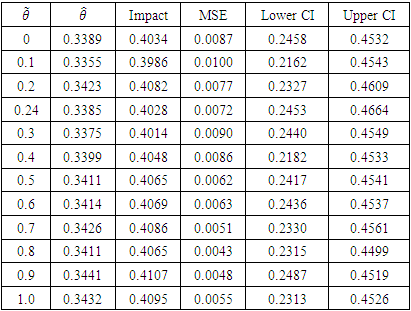
The impact estimate obtained at  = 0.24 is 0.3385, with MSE 0.0072. This implies that participation in Breastfeeding Support Group (BFSG) increases number of months of breastfeeding by about 40% over baseline values.
3.5. Result of Bayesian Estimation Using Gamma Prior
Bayesian estimation was carried out using Gamma prior. Table 12 provides result of the analysis.Table 12. Result of Bayesian estimation using Gamma prior
 |
| |
|
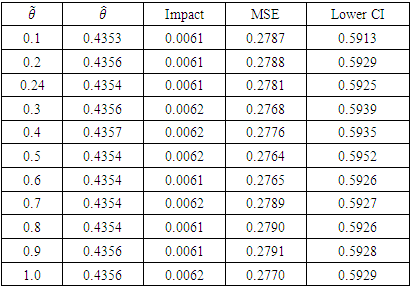
The impact estimate is obtained at  = 0.24 is 0.4354, with MSE 0.0061. This implies that participation in Breastfeeding Support Group (BFSG) increases number of months of breastfeeding by about 44% over baseline values.
3.6. Result of Bayesian Estimation Using Power Prior
Bayesian analysis was carried out using power prior. Historical data for the power prior distribution was obtained from a similar study conducted in Borno state in 2018 among a different population. Table 13 provides result of the analysis. Table 13. Result of Bayesian estimation using power prior
 |
| |
|
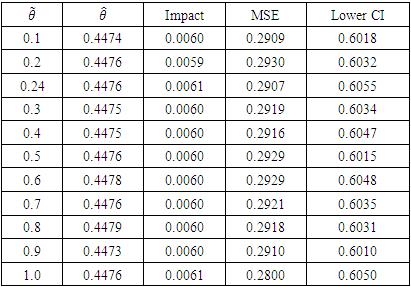
The impact estimate is obtained at  = 0.24 is 0.4476, with MSE 0.0061. This implies that participation in Breastfeeding Support Group (BFSG) increases number of months of breastfeeding by about 45% over baseline values.
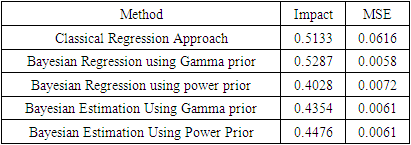
3.7. Comparison of Result from Classical and Bayesian Procedure
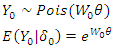
Table 14 shows comparison of result obtained from the proposed Bayesian and existing classical approaches. The “Bayesian DID estimation approach provided a realistic impact estimate and lower Mean Squared Error compared to the existing classical approach. Based on this approach, it can be inferred that exposure to BFSG increases number of months of breastfeeding by 45% compared to 51% realized from the existing classical method, as presented in table 14 and figure 2.Table 14. Comparison between result from classical and Bayesian procedures
 |
| |
|
 | Figure 2. Comparison of impact estimates for count outcome based on proposed and existing approaches using real life data |
3.8. Result from Non-Informative Prior (Uniform and Beta Priors)
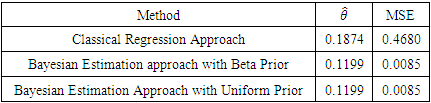
Using non informative prior, the results obtained from Bayesian regression and Bayesian estimation approaches were very close to the result from the classical regression approach. However, the proposed Bayesian estimation of the distribution of the DID approach produced a lower Mean Squared Error, compared to the existing classical method, as presented in table 15.Table 15. Comparison of Bayesian and Classical approach based on real life data using non informative prior
 |
| |
|
4. Conclusions
Estimating Impact of experimental intervention from the classical approach is widely adopted among evaluators and researchers. Bayesian approach are being newly introduced into experimental evaluation and this study provides framework for adopting Bayesian approach in experimental intervention when outcome of interest is count and from Poisson distribution. In adopting the Bayesian approach, findings from this study showed that Bayesian parameter estimation produced lower impact estimate and lower Mean Squared Error compared to the Bayesian regression and classical regression approaches. Adopting a procedure that provides a more precise estimate of impact of experimental intervention will help normalize outrageous claims of intervention efficacy. Findings from this study will provide opportunity to apply a better impact estimation procedure than what is commonly adopted to improve decision from experimental intervention.
ACKNOWLEDGEMENTS
The authors would like to acknowledge faculty staff of the Department of Statistics, University of Ilorin, Ilorin, Nigeria for the review of the study.
References
| [1] | Lance P, Guilkey D, Hattori A, Angeles G. How do we know if a program made a difference? A guide to statistical methods for program impact evaluation [Internet]. Chapel Hill, North Carolina: MEASURE Evaluation; 2014. Available from: https://www.measureevaluation.org/resources/publications/ms-14-87-en.html. |
| [2] | Least squares, maximum likelihood, and Bayesian parameter estimation. In: Genomic Selection in Animals. Hoboken, NJ: John Wiley & Sons, Inc; 2016. p. 21–9. |
| [3] | Adebayo SB. Bayesian geoadditive modelling of breastfeeding initiation in Nigeria. J Appl Econ (Chichester Engl) [Internet]. 2004; 19(2): 267–81. Available from: http://dx.doi.org/10.1002/jae.732. |
| [4] | Gill J. Bayesian methods: A social and behavioral sciences approach, third edition. 3rd ed. Philadelphia, PA: Chapman & Hall/CRC; 2014. |
| [5] | Jackman S. Bayesian analysis for the social sciences. Hoboken, NJ: Wiley-Blackwell; 2009. |
| [6] | Ipadeola O, Jolayemi E. Bayesian estimation of impact in experimental interventions with continuous outcome. Int J Stat Appl Math [Internet]. 2021; 6(1): 223–9. Available from: http://dx.doi.org/10.22271/maths.2021.v6.i1c.652. |
| [7] | Feng C, Wang H, Lu N, Chen T, He H, Lu Y, et al. Log-transformation and its implications for data analysis. Shanghai Arch Psychiatry [Internet]. 2014; 26(2): 105–9. Available from: http://dx.doi.org/10.3969/j.issn.1002-0829.2014.02.009. |
| [8] | Comoglio F, Fracchia L, Rinaldi M. Bayesian inference from count data using discrete uniform priors. PLoS One [Internet]. 2013; 8(10): e74388. Available from: http://dx.doi.org/10.1371/journal.pone.0074388. |
| [9] | Morita S, Thall PF, Müller P. Evaluating the impact of prior assumptions in Bayesian biostatistics. Stat Biosci [Internet]. 2010; 2(1): 1–17. Available from: http://dx.doi.org/10.1007/s12561-010-9018-x. |
| [10] | Neelon BH, O’Malley AJ, Normand S-LT. A Bayesian model for repeated measures zero-inflated count data with application to outpatient psychiatric service use. Stat Modelling [Internet]. 2010; 10(4): 421–39. Available from: http://dx.doi.org/10.1177/1471082X0901000404. |
| [11] | Kaciroti NA, Raghunathan TE, Schork MA, Clark NM. A Bayesian model for longitudinal count data with non-ignorable dropout. J R Stat Soc Ser C Appl Stat [Internet]. 2008; 57(5): 521–34. Available from: http://dx.doi.org/10.1111/j.1467-9876.2008.00628.x. |
| [12] | Chen M-H, Ibrahim JG. Power prior distributions for Regression Models. Statistical Science. 2000; 15(1). Available from: 10.1214/ss/1009212673. |
| [13] | Noel-Weiss J, Boersma S, Kujawa-Myles S. Questioning current definitions for breastfeeding research. International Breastfeeding Journal. 2012; 7(1). Available from: 10.1186/1746-4358-7-9. |
| [14] | Lamstein S, Anson M, Beall K, Williams T, Collaiezzi B, Aakesson A, et al. Evidence of effective approaches to social and behavior change communication for preventing and reducing stunting and anemia [Internet]. SPRING. 2014. Available from: https://www.spring-nutrition.org/publications/series/evidence-effective-approaches-social-and- behavior-change-communication. |
| [15] | Mackintosh UA, Marsh DR, Schroeder DG. Sustained positive deviant child care practices and their effects on child growth in Viet Nam. Food and Nutrition Bulletin. 2002; 23(4_suppl_1): 16–25. |
| [16] | Duyan Çamurdan A, Özkan S, Yüksel D, Pasli F, Şahin F, Beyazova U. The effect of the baby-friendly hospital initiative on long-term breast feeding. International Journal of Clinical Practice. 2007; 61(8): 1251–5. |
| [17] | Aksu H, Küçük M, Düzgün G. The effect of postnatal breastfeeding education/support offered at home 3 days after delivery on breastfeeding duration and knowledge: A randomized trial. The Journal of Maternal-Fetal & Neonatal Medicine. 2010; 24(2): 354–61. |
| [18] | Chib S, Greenberg E. Understanding the metropolis-hastings algorithm. The American Statistician. 1995; 49(4): 327–35. |
| [19] | Singh S, Arabi Belaghi R, Noori Asl M. Estimation and prediction using classical and Bayesian approaches for Burr III model under Progressive Type-I hybrid censoring. International Journal of System Assurance Engineering and Management. 2019; 10(4): 746–64. |
| [20] | Ennouri K, Ben Ayed R, Mazzarello M, Ottaviani E, Hertelli F, Azzouz H. Classical and bayesian predictions applied to bacillus toxin production. 3 Biotech. 2016; 6(2). |
| [21] | Oliphant, Travis E. A Bayesian perspective on estimating mean, variance, and standard deviation from data. Faculty Publications. 2006; 278. https://scholarsarchive.byu.edu/facpub/278. |

 Abstract
 Reference
 Full-Text PDF
 Full-text HTML