-
Paper Information
- Paper Submission
-
Journal Information
- About This Journal
- Editorial Board
- Current Issue
- Archive
- Author Guidelines
- Contact Us
International Journal of Statistics and Applications
p-ISSN: 2168-5193 e-ISSN: 2168-5215
2022; 12(4): 83-86
doi:10.5923/j.statistics.20221204.01
Received: Oct. 31, 2022; Accepted: Nov. 19, 2022; Published: Nov. 24, 2022

Forecasting Monthly Rainfall Using Arima Seasonal Method: Case Study: Rainfall in West Lampung Regency
 Abstract
 Reference
 Full-Text PDF
 Full-text HTML
Nusyirwan1, Lusmeilia Afriani2, Faturrahman1
1Department of Mathematics, Faculty of Mathematics and Natural Sciences, University of Lampung, Bandar Lampung, Indonesia
2Department of Civil Engineering, Faculty of Engineering, University of Lampung, Bandar Lampung, Indonesia
Correspondence to: Nusyirwan, Department of Mathematics, Faculty of Mathematics and Natural Sciences, University of Lampung, Bandar Lampung, Indonesia.
| Email: |  |
Copyright © 2022 The Author(s). Published by Scientific & Academic Publishing.
This work is licensed under the Creative Commons Attribution International License (CC BY).
http://creativecommons.org/licenses/by/4.0/

Rain comes from rain clouds that condense and fall to the earth as a result of natural phenomena so that the occurrence is so random in terms of time, location and magnitude, as a result the actual value is difficult to estimate. West Lampung Regency has two seasons (Rain and Dry) and also has very fast weather changes due to the geographical location of West Lampung Regency which borders the Indian Ocean which results in low pressure in the Indian Ocean, high rainfall will occur. Rainfall consists of two seasons and occurs repeatedly, so that rainfall is included in the monsoon pattern which is characterized by the type of unimodial rainfall (one peak of the rainy season). If using data on the amount of past rainfall, the appropriate method for modeling the amount of rainfall is the Seasonal Autoregressive Integrated Moving Average (SARIMA) method. This study aims to determine the SARIMA model that is formed on the data on the amount of monthly rainfall. The best SARIMA model for monthly rainfall data in West Lampung Regency is the SARIMA (1,0,0)(1,0,1)12 model with an AIC value of 887.40. Forecasting results for the next 12 months are dominated by high and very high rainfall.
Keywords: Total Rainfall, West Lampung Regency, SARIMA
Cite this paper: Nusyirwan, Lusmeilia Afriani, Faturrahman, Forecasting Monthly Rainfall Using Arima Seasonal Method: Case Study: Rainfall in West Lampung Regency, International Journal of Statistics and Applications, Vol. 12 No. 4, 2022, pp. 83-86. doi: 10.5923/j.statistics.20221204.01.
1. Introduction
- Rain comes from clouds that condense rain_ and fall to the ground due to natural phenomena so that it occurs so randomly in terms of time, location, and magnitude, as a result, the actual value is difficult to estimate. Rainfall is the amount of water that falls on flat ground during a certain period measured in millimeters (mm) above the horizontal surface. Rain can also be interpreted as the height of rainwater that collects in a flat place, does not evaporate, does not seep and does not flow [1]. Likewise, it is very difficult to prove a series of recordings from rain data, so sometimes to predict or add rain recording data it is necessary to simulate synthetic rain data. Various methods have been developed by researchers in engineering and science to prove this information. The most widely used methods today are the deterministic method and the stochastic method.The intensity of heavy rain is very dangerous because it has a negative impact on people's life activities such as floods and landslides. This will have a negative impact on various sectors such as agriculture, fisheries, tourism and transportation. In Indonesia there are two seasons, namely the rainy season and the dry season. West Lampung Regency is a district that has two seasons but also has very fast weather changes, because of the geographical location of West Lampung which borders the Indian Ocean. This causes if there is low pressure in the Indian Ocean then West Lampung will experience high rain. So that West Lampung Regency becomes a district with high rainfall and very wet nature. This makes information on rainfall in West Lampung Regency very important to know.Monthly rainfall data modeling in West Lampung Regency can be done using the Seasonal Autoregressive Integrated Moving Average (SARIMA) method if the modeling uses univariate time series data and has a seasonal pattern. According to [7], forecasting using univariate time series data which was first introduced by [2] is the Autoregressive Integrated Moving Average (ARIMA) and is still the most popular forecasting model. This model is derived from the Autoregressive (AR) model, the Moving Average (MA) model and the combination of AR and MA, the ARMA model. In the event that there is a seasonal component in the model, this model is referred to as the SARIMA model [7].Several studies on rainfall, namely time series modeling and forecasting of rainfall at twelve stations in Bogor by [6] obtained the best time series models for 12 stations in Bogor: ARIMA(1,1,1), ARIMA(1,1,0), and ARIMA(3,1,0) as well as rainfall forecasting data with Seasonal Autoregressive Integrated Moving Average (SARIMA) with outlier detection as an effort to optimize agricultural production in Mojokerto Regency by [5] found this method able to accommodate rainfall data rain that has high fluctuations and extreme values. This study aims to obtain the best model and predict the amount of rainfall in West Lampung Regency based on the best model that has been obtained using the Seasonal ARIMA method.
2. Materials and Methods
- The object of this research is West Lampung Regency. The variable used is the amount of daily rainfall in West Lampung Regency. The stages of this research include data collection activities. In this study, daily rainfall data (mm) for the period 1 January 2017–31 May 2022 was used in West Lampung Regency. The data source comes from the Meteorology, Climatology, and Geophysics Agency (BMKG) Climatology Station Masgar Lampung. Data from BMKG is in the form of daily data which is then converted into monthly data by adding up the daily rainfall data for West Lampung Regency. The second is data exploration, the purpose of data exploration is to provide an overview of monthly rainfall data in West Lampung Regency. Third, modeling using the Box-Jenkins method. Building the SARIMA model, the modeling stages will be carried out, namely testing and handling stationarity, then model identification, model parameter estimation, and model diagnostics. The four best model choices, from several SARIMA models that meet the parameter significance test, will be selected the best model based on the Akaike Information Criterion (AIC) criteria. Finally, forecasting uses the best selected model.The general form of the SARIMA model (p,d,q)(P,D,Q)s is [3]:
 | (1) |
 Where
Where  and
and  are the autoregressive (AR) parameters of the non-seasonal and seasonal components, respectively;
  and
and  is the parameter of the non-seasonal and seasonal component moving average (MA); B is the Backward operator,
  is the number of non-seasonal differences and
  the number of seasonal differences;
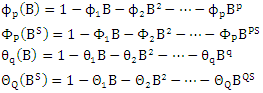
  is an independently distributed random variable; P and p order of AR components; Q and q order MA components; D and d are the sum of the differences, and are usually abbreviated as SARIMA (p,d,q)(P,D,Q)s [8].The stages of modeling using the Box-Jenkins method are:1. Create ACF and PACF plots.2. Test the stationarity of the data by performing a unit root test using the ADF test.3. Perform data transformation using the Box-Cox transformation method if the data used is not stationary on the variant. Differentiate the data if the data used is not stationary. Then examine the transformed or differentiated stationary data. This stage is carried out until the data is stationary.4. Establish a provisional conjecture model. Determine the order of the model by looking at the stationary ACF plot and PACF data.5. Estimating the parameters then testing the significance of the model parameters by using the t-test or looking at the p-value.6. The selection of the best model uses several criteria for selecting the best model by looking at the AIC value. The criteria for selecting the best model are carried out if there is more than one model that meets the requirements, namely those that meet the significance of the parameters (step 5).7. Performing overfitting by increasing the order of p, q, P, and Q from the temporary conjecture model so that several models are obtained while still looking at the models that meet the significance of the parameters.8. Choose the best model based on the smallest AIC value.9. Doing forecasting using the best model.10. Categorize the results of forecasting the amount of rainfall into 3 parts, namely low (0-100 mm), medium (100-300 mm), high (300-500 mm), and very high (>500 mm).In determining the forecasting model to be used, an evaluation of the model is carried out. How to evaluate the forecasting model that can be done is by using information criteria. Information criteria are criteria for assessing the quality of the model by using a statistical model of a parameter. Akaike Information Criteria (AIC) is defined as:
  , where: k=number of parameters; L = maximum likelihood [8].
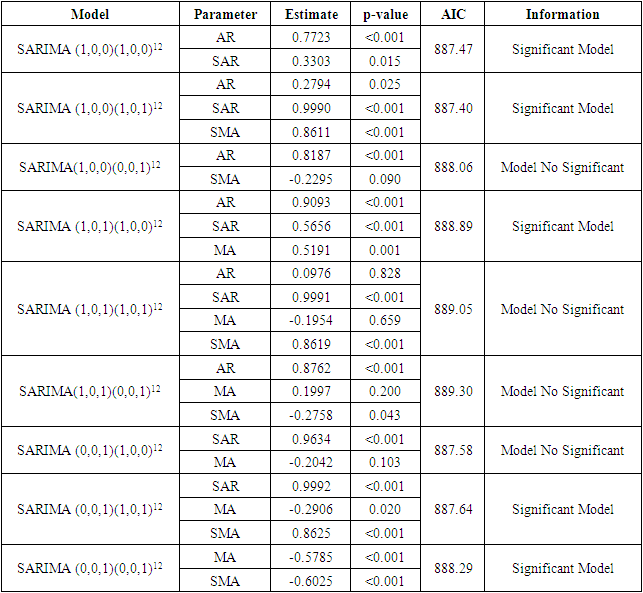
3. Results and Discussion
- The first step in modeling time series data is the stationarity test of the data. The ADF test showed that the data was stationary and found a significance value smaller than the 5% significance level (p-value < = 0.05) which was 0.01. After that, the ACF and PACF plots were made with the following results:
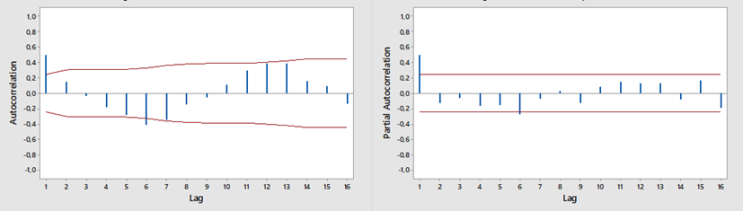 | Figure 1. ACF and PACF plots Monthly Rainfall Data in West Lampung Regency |
|
|
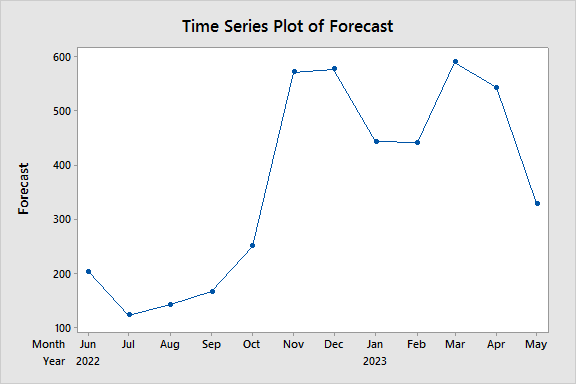 | Figure 2. Graph of monthly rainfall forecasting data in West Lampung Regency |
4. Conclusions
- Modeling amount bulk rain monthly West Lampung Regency uses data from the West Lampung BMKG. The best SARIMA models for quantity data bulk rain monthly in West Lampung Regency is the SARIMA model (1,0,0)(1,0,1)12 with AIC value of 887.40. Forecasting results for the next 12 months are dominated by high and very high rainfall.