Kering Emmanuel Kibet, Orawo Luke Akongo, Ali Salim Islam
Egerton University, Mathematics Department, Egerton, Kenya
Correspondence to: Orawo Luke Akongo, Egerton University, Mathematics Department, Egerton, Kenya.
| Email: |  |
Copyright © 2022 The Author(s). Published by Scientific & Academic Publishing.
This work is licensed under the Creative Commons Attribution International License (CC BY).
http://creativecommons.org/licenses/by/4.0/

Abstract
Many studies do exist in health research where the outcome of interest may occur on subjects more than once; outcomes of this nature are referred to as recurrent events. The event time of recurrence and the interval time (gap time) between successive recurrences are two time scales that are used to analyze recurrent event data. This paper proposes a new parametric model called the Weibull-Geometric (WG) model for the gap times of recurrent events. This model will be characterized by a rate function and the number of competing causes will be modeled by a geometric distribution. The point estimates of the parameters of the WG model for gap times will be obtained using the maximum likelihood method and approximate 95% confidence intervals for each parameter will be constructed. A simulation study is carried to investigate the frequentist properties of both ML estimates and confidence intervals for the model parameters.
Keywords:
Recurrent event data, Rate function, Gap time, Maximum likelihood estimation, Confidence intervals, Weibull-Geometric distribution
Cite this paper: Kering Emmanuel Kibet, Orawo Luke Akongo, Ali Salim Islam, Estimation of Parameters of the Weibull Geometric Model for Gap Times of Recurrent Events, International Journal of Statistics and Applications, Vol. 12 No. 2, 2022, pp. 49-53. doi: 10.5923/j.statistics.20221202.04.
1. Introduction
Recurrent events data are usually observed in longitudinal studies involving multiple subjects where each individual may experience multiple episodes of the same event. This kind of data set arises in several areas, including the health and biomedical sciences, engineering, social sciences, and economics. Many examples of recurrent events are found in health and biomedical sciences, such as drug abuse of teenagers or adults, recurrent hospitalization of patients with chronic diseases. In engineering and reliability settings, the breakdown of mechanical or electronic systems are instances of recurrent events. In sociology, absenteeism rate of employees and the recurrence of war in regions. In actuarial science, such as keeping track of a claim from a given insurer, are other potential examples of recurrent event data. It is worth to note that remarkable statistical advances in the modeling of recurrent event data have realized during the last decade. In practice, to obtain valid statistical inferences it is required that an appropriate probability model is fitted to the recurrent events data. The process of model selection considers the: distribution of subsequent event times, frequency of the recurrent events and the specific research objectives being posed at the time. Two types of time scales are often used to analyze recurrent event data, namely the event time of recurrence (Lawless, 2011) and the interval time (gap) between successive recurrences (Aalen et al. 2008; Cook and Lawless, 2007). Renewal processes are the basic models for the gap times analysis (Kalbfleisch and Prentice, 2011), being characterized through the distribution of gap times. Most studies on the analysis of recurrent events data available in the literature have been concentrated on analysis of gap times and thus leading to a wide variety of models, for instance, bivariate distribution for censored gap times (Lin et al. 1999), accelerated failure time models (Strawderman, 2005), proportional hazards models (Huang and Chen, 2003; Schaubel and Cai, 2004) and additive hazards models (Lin and Ying, 1994) for gap times based on renewal process, and additive hazards models for gap times with multiple causes (Sankaran and Anisha, 2012). Lounzada et al., 2015 proposed the Poisson Exponential model for gap times of recurrent event data, which is characterized by a fully parametric baseline function, and they assumed that the time of each recurrence is associated with one or multiple latent causes and there is no information about which cause is responsible for the event. The time of each recurrence was given by the maximum lifetime value among all latent causes. The main idea was to search for statistical models for gap times with more general distributional structures allowing for more flexibility and better data fitting. This study thus has proposed a new model to analyze gap times of recurrent event data, which is based on the Weibull Geometric distribution (Barreto-Souza et al. 2011). The Weibull distribution is a very popular model that has been extensively used over the past decades for analyzing data in survival analysis. The article is organized as follows. Section 2 describes the mathematical formulation of the Weibull-Geometric model. Section 3 describes the method of maximum likelihood and the confidence intervals for the estimation of the parameters of the WG model. Section 4 presents the results of a simulation study, and finally, the results are discussed in Section 5.
2. The Weibull-Geometric Model
The Weibull-Geometric (WG) distribution generalizes the Exponential-Geometric (EG) distribution proposed in Barreto-Souza et al, 2011 for analysis of recurrence event data and has been widely used in modelling unimodal failure rates (Kalbfleisch and Prentice, 2011). In this section, we present the Weibull-Geometric distribution, derive the Weibull-Geometric model for gap times of recurrences of events and finally outline the simulation procedure for this model.
2.1. The Weibull-Geometric Distribution
A continuous random variable  has a Weibull distribution with parameters
  and
and  , denoted by
  if and only if its density function is given by
 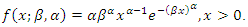 | (1) |
The cumulative distribution  of Weibull distribution is given by
 | (2) |
Let  be a discrete random variable having a geometric distribution with probability mass function
  | (3) |
where  Suppose that
  are independent and identically distributed
  random variables. Define
  as the smallest order statistic. Therefore, the conditional density function of
  given
given  is
is 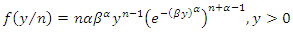 | (4) |
The joint density function of the random variables  and
and  is obtained as
 | (5) |
The marginal distribution of  is
is 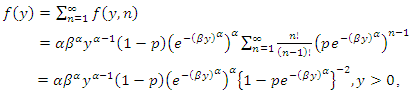 | (6) |
which is the density function of the WG distribution (Barreto-Souza et al, 2011), having three parameters  and
and  , denoted by
  . Weibull geometric distribution is much more flexible than the Weibull distribution. When
  approaches zero, the WG distribution leads to the Weibull
  distribution (Cordeiro, 2013). For all values of parameters, the density tends to zero as
  .The cumulative distribution of Y is therefore given as;
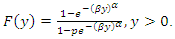 | (7) |
2.2. The Distribution of Survival and Hazard Functions of WG
Let  be a
be a  random variable. The survival and hazard functions of the random variable
  are respectively given as
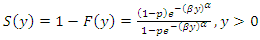 | (8) |
and 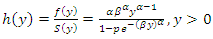 | (9) |
The hazard function (9) decreases for  . However, for
  it can take different forms. The plots of the hazard function at selected values of the vector
  and holding
  constant show that the hazard function of WG distribution is quite flexible.
2.3. Weibull-Geometric Model for Recurrent Event Data
The WG model is described as a model for inter-event times (gap times) of recurrent events. For the purpose of formulation of this model, the event time was denoted by  and time between consecutive events (gap times) was denoted by
  Multiple subjects experiencing finite multiple episodes of the same event were considered for the purpose of formulation of the model. Assuming we have
  independent subjects each experiencing
  recurrence of the same event, then subjects were indexed by
  and each subject recurrences were indexed by
  Let
Let  be the sequence of event times for subject
  and the corresponding sequence of gap times between consecutive occurrences of the same event is given as
  so that
  is the occurrence time of the
  event of subject
  Given that
 then the recurrent process
  for subject
  has the rate function given by
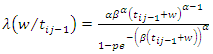 | (10) |
where  and
and  By definition, the cumulative rate function is given as;
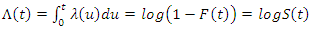 | (11) |
Where  is the survival function.This imply that,
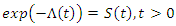 The corresponding cumulative rate function over the interval
  is given by,
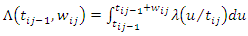 | (12) |
From equation (8), the survival function of  is given as
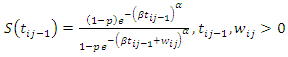 | (13) |
And the joint survival function of  and
and  will be
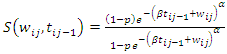 | (14) |
And hence the survival function of the gap time  conditional on
  for subject
  is given by,
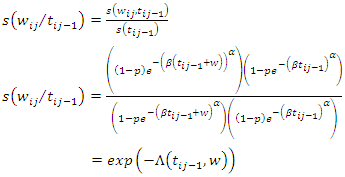 | (15) |
The conditional density function of gap times  given
given  for a recurrent process that is independent of the events prior to
  is defined as,
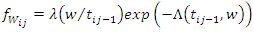 | (16) |
Hence,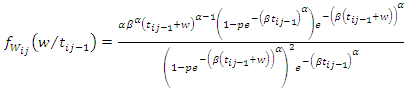 | (17) |
which is the Weibull Geometric model for recurrent events denoted as WGre.The cumulative distribution  of the random variable
  given
given  is defined as,
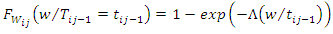 Hence,
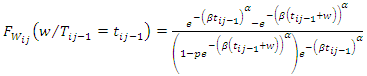 | (18) |
2.4. Data Simulation Procedure
Gap times  were simulated using the iterative inverse transform algorithm. The inverse transform method works as follows. Let
  be a uniform random variable on the interval
  Then for any continuous distribution function
  the random variable
  has distribution function
  .The event times and gap times were generated using the inverse transform method through the following steps:1. Generate
  2. Set
 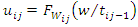 and solve for
  to obtain
  a realization of the random variable
  that is solve for
  in
in 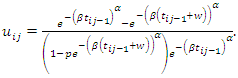 The resulting general expression for generated gap times
  was obtained as
 | (19) |
3. The event times were obtained as  for
for  and
and  with
with 
3. Parameter Estimation
The WG model has three parameters  and
and  which are estimated by the maximum likelihood method. The recurrences of subjects are assumed to occur according to the rate function given in (10). Suppose that subject
  is observed over the time interval
  and that the same number of recurrences
  is observed for each of the
  subjects. Then for subject
  if the
  recurrences are observed at times
  define
 and
and  . Assume that
  for all
  Let
Let  be the gap times of the
  subjects.The corresponding likelihood function of the WG model from each individual with respect to all occurrences and all intervals is given as;
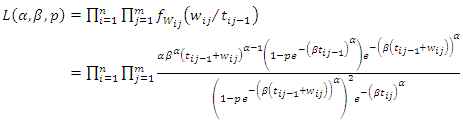 | (20) |
From Equation (20) we obtain the log-likelihood function as;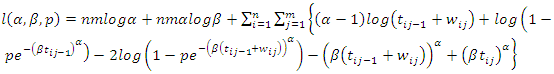 | (21) |
The maximum likelihood estimates  of the parameters
  are then obtained numerically by maximizing the log-likelihood function (21) using any of the in-built optimization procedures of the R language. Let
  be the vector of parameters of the WG model and denote the corresponding the vector the maximum likelihood estimates by
  . The construction of the
  Wald confidence interval for each of the three parameters is based on the asymptotic normality property of the
  . That is
 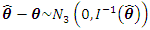 approximately, where
  denotes the observed Fisher information matrix. Therefore the
  Wald confidence interval of the
  component of
  denoted by
  is given as
 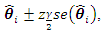 where the standard error
  is defined as the square root of the
  diagonal entry of the inverse of the Fisher information matrix
  The confidence intervals act as measures of accuracy on the point estimates and reporting them together with the point estimates constitute a complete estimation statement.
4. Simulation Study
The purpose of this simulation study was to analyze the frequentist properties of the estimation procedure. The data (gap times and recurrence times) for  subjects were generated by inverse transform method in R programming language as outlined in subsection 2.4. The simulation of data was indexed by some fixed values of the parameters
  ,
,  and
and  . Several cases were considered by varying the sample size and the number of recurrences in order to investigate their effects on estimation. The three parameters were fixed at
 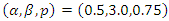 . The number of recurrences
  were used in the simulation study with sample sizes
 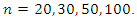 For each case, determined the pair of values of
  and
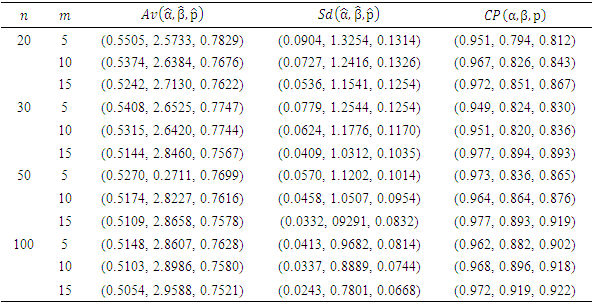
and  1000 samples were generated and for each sample the MLEs were computed and the 95% Wald confidence intervals constructed for the model parameters. Table 1 shows the averages of 1000 MLEs as well as standard errors and the empirical coverage probabilities (CP) for different sample sizes and different numbers of recurrences. It can be observed the empirical CP for the Wald confidence interval for the parameter
  are higher than the nominal level for most of cases considered, whereas the empirical CPs of the confidence intervals for the other two parameters are low but increase with the sample size and the number of recurrences. The histogram plots for the simulated 1000 MLEs presented in figure 1 show that the distributions of the estimators of the parameters are heavily skewed even for large samples (departure from normality) and this explains the observed behavior of the empirical CPs for the Wald confidence intervals for the three model parameters.. Moreover, the MLEs of the model parameters approach their respective values used in the simulation and the corresponding standard errors decrease as the amount of data increases, which implies that the parameter estimators are consistent.
 Table 1. The averages of the 1000 MLEs,
 their standard errors, their standard errors,
 and the CP of the 95% Wald Confidence intervals for the model parameters and the CP of the 95% Wald Confidence intervals for the model parameters

 |
| |
|
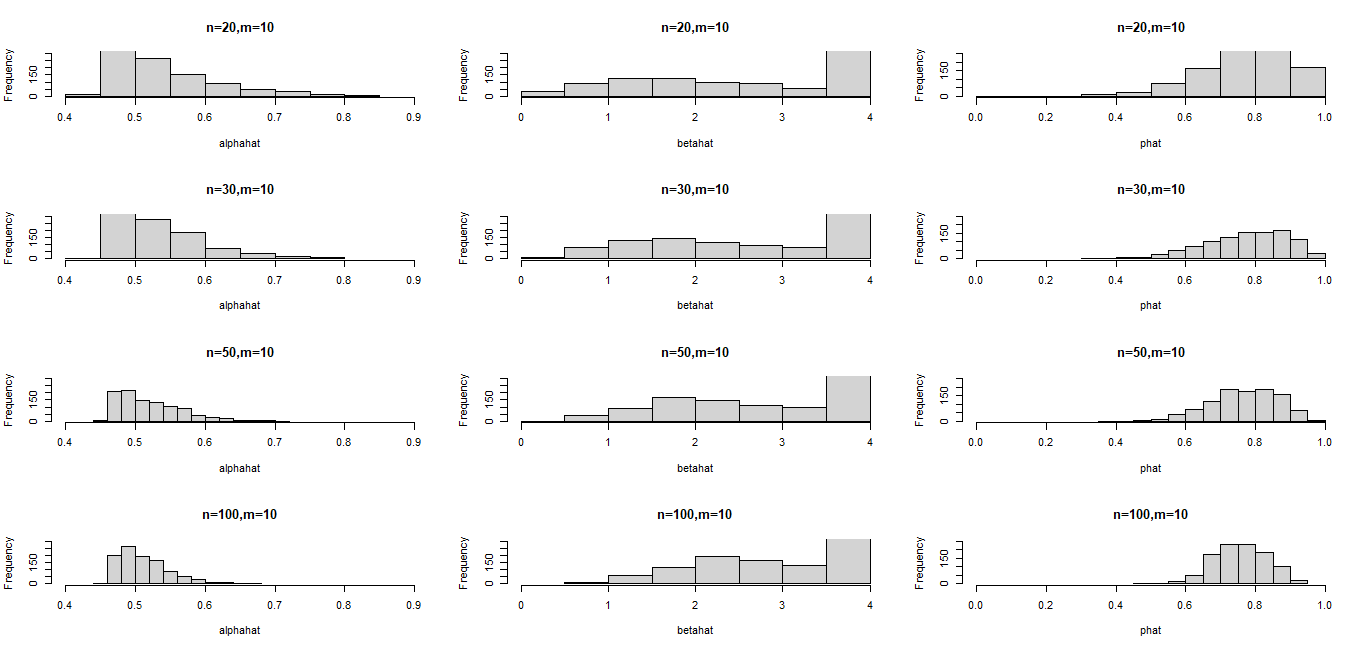 | Figure 1. Plots of histograms of the simulated 1000 MLEs for the three parameters for samples sizes  and number of recurrences fixed at and number of recurrences fixed at  |
Also it can be observed from figure 1 that the sampling distribution of  is skewed to the left and those
  and
and  are skewed to the right, and this may explain the differences in the behaviors of their empirical CPs.
5. Conclusions
In this paper, we have proposed the Weibull-geometric model for the analysis of recurrent event data, where the observations of interest are the gap times between events. In particular, we have derived the conditional density function of the gap times from the rate function in (10), which is an alternative formulation for recurrent event data and can be applied in medical and biostatistics areas. The parameters were estimated by the method of maximum likelihood and the results of simulation study show that this parameter estimation method is effective for all the cases considered. Therefore, we conclude that the estimates of the parameters are not affected by small and moderate sample sizes and numbers of recurrences of event. The Wald method for constructing confidence intervals performed poorly in terms of empirical CP for the parameters whose sampling distributions of their estimates were skewed to the left and may require very large samples to produce good results. An alternative interval estimation method, such as profile likelihood, can be used to construct better confidence interval for both small and large sample sizes.
References
| [1] | Aalen, O., Borgan, O., and Gjessing, H. (2008). Survival and event history analysis: a process point of view. Springer Science & Business Media. |
| [2] | Anisha, P., and Sankaran, P. G. (2012). Modelling and analysis of recurrent event data with multiple causes (Doctoral dissertation, Cochin University of Science and Technology). |
| [3] | Barreto-Souza, W., de Morais, A. L., and Cordeiro, G. M. (2011). The Weibull-geometric distribution. Journal of Statistical Computation and Simulation, 81: 645-657. |
| [4] | Cook, R. J., and Lawless, J. F. (2007). The statistical analysis of recurrent events. Springer Science & Business Media. |
| [5] | Cordeiro, G. M., Silva, G. O., and Ortega, E. M. (2013). The beta-Weibull geometric distribution. Statistics, 47: 817-834. |
| [6] | Kalbfleisch, J. D., and Prentice, R. L. (2011). The statistical analysis of failure time data. John Wiley & Sons, 360: 227-243. |
| [7] | Lawless, J. F. (2011). Statistical models and methods for lifetime data. John Wiley & Sons, 362: 52-62. |
| [8] | Lin, D. Y., and Ying, Z. (1994). Semiparametric analysis of the additive risk model. Biometrika, 81: 61-71. |
| [9] | Lin, D. Y., Sun, W., and Ying, Z. (1999). Nonparametric estimation of the gap time distribution for serial events with censored data. Biometrika, 86: 59-70. |
| [10] | Louzada, F., Macera, M. A., and Cancho, V. G. (2015). The Poisson-exponential model for recurrent event data: an application to bowel motility data. Journal of Applied Statistics, 42: 2353-2366. |
| [11] | Louzada, F., Marchi, V., and Roman, M. (2014). The exponentiated exponential–geometric distribution: a distribution with decreasing, increasing and unimodal failure rate. Statistics, 48: 167-181. |
| [12] | Huang, Y., and Chen, Y. Q. (2003). Marginal regression of gaps between recurrent events. Lifetime data analysis, 9: 293-303. |
| [13] | Strawderman, R. L. (2005). The accelerated gap times model. Biometrika, 92: 647-666. |
| [14] | Schaubel, D. E., and Cai, J. (2004). Regression methods for gap time hazard functions of sequentially ordered multivariate failure time data. Biometrika, 91: 291-303. |

 Abstract
 Reference
 Full-Text PDF
 Full-text HTML