Mbachu H. I.
Department of Statistics, Imo State University, Owerri
Correspondence to: Mbachu H. I., Department of Statistics, Imo State University, Owerri.
| Email: |  |
Copyright © 2022 The Author(s). Published by Scientific & Academic Publishing.
This work is licensed under the Creative Commons Attribution International License (CC BY).
http://creativecommons.org/licenses/by/4.0/

Abstract
This study examines the effect age, quantity of caffeine intake and weight of an individual have on amplitude of accommodation. The purpose is to model the relationship age, quantity of caffeine intake and weight have on amplitude of accommodation among normal healthy adults in Imo State University, Owerri. A response surface methodology approach was employed using the Face centre cube central composite design and Analysis of Variance (ANOVA). The results show that the relationship is of quadratic model and it is significant (2.30 > 0.0347). From the model, the variables (Age, Amount of Caffeine intake) in the linear and squared terms of the model were significant while all the variables in interaction terms were not significant.
Keywords:
Amplitude of Accommodation, Response Surface Methodology, Central Composite Design
Cite this paper: Mbachu H. I., A Response Surface Approach to Factors Affecting Amplitude of Accommodation: A Case Study of Imo State University, International Journal of Statistics and Applications, Vol. 12 No. 2, 2022, pp. 42-48. doi: 10.5923/j.statistics.20221202.03.
1. Introduction
The amplitude of accommodation (AA) is the maximum potential increase in optical power that an eye can achieve in adjusting its focus. According to [1], it refers to a certain range of object distances for which the retinal image is as sharply focused as possible. [2] identify AA as an important parameter in the diagnosis and treatment of accommodative anomalies, as well as the determination of reading addition of presbyopes. Accommodative abnormalities according [3] are the common visual disorders, which are associated at times with symptoms, such as headache, asthenopia, etc while reading. While [4] put the incidence of accommodative abnormalities of patients who come to optometry clinics at 20%, Amplitude of Accommodation is rarely integrated into routine clinical examinations by eye-care practitioners. This abnormality has in most cases result in inaccuracies in the assessment of accommodative function and prescription of reading addition. Amplitude of accommodation according to [5], reduces progressively from childhood to old age. Apart from age as having influence on AA, many researchers have also identified caffeine as having influence on Amplitude of Accommodation. [6], in their study suggested that Caffeine intake is associated with pupil dilation and enhanced accommodation. [7], though limited there study on healthy subjects of Benin metropolis of Nigeria, which revealed that the ingestion of caffeine has a significant positive effect on amplitude of accommodation. [8] studied the effects of caffeine on visual performance among youths. Their result showed Caffeine consumption has some effect on visual performance of the eye by increasing reading rate and tear film quality. [2], examined the amplitude of accommodation (AA) of healthy individuals’ ages ranging from 5 and above 55 years in Owerri Municipal Council of Imo State using Donders’ Push-up-to-blur (PUB) technique; and compared it with the average AA derived from Hofstetter’s equation. Their results showed that age and AA were inversely but significantly correlated (p < 0.05), with the 5-14 and ≥ 55 years age categories having the highest (17.49D) and least (1.60D) AA values respectively.Response Surface Methodology (RSM) is a rudimentary subject in statistical design of experiment which according to [9], is a collection statistical and mathematical methods that are useful for developing, improving and optimizing process. RSM experiments are designed to allow for the estimation of interaction and quadratic effects of a model. The true response function in most RSM problems are unknown. Therefore in order to develop a proper approximation for the function, it starts with a low order polynomial which is define by a linear function of an independent variable called a first order model. If there is a curvature in the response surface, then a higher degree polynomial is added to the first order model. In this, an approximating function with two or more variables is known as second order model given as follows.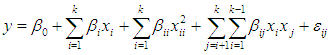 | (1) |
Where y is the measured response, β’s are parameter coefficients; xi’s are the input variables and  is an error term.Most second order designs especially the Central composite design by [10] utilizes the above stated model. The central composite design (CCD) is made up of three parts namely; the factorial portion which consists of 2k full or 2k-1 half replicate (k is the number of independent variables) coded as (±1, ±1, …, ±1), the axial or star points which consist of 2k coded in the form (±α, 0,…, 0), (0, ±α,…, 0), and finally, a center point which is coded as (0, 0, …, 0).The center points provide information about the existence of curvature in the system. To provide flexibility and better estimate of the pure error and power for the test is determine by the number of center points. The scaled prediction variance of a design according to [11] is also affected by the choice of the number of center points. If the curvature is found in the system, then the addition of axial points allow for efficient estimation of the pure quadratic terms. The choice of axial distance α not only is based on the region of interest but choosing the appropriate values of α specifies the type of CCD for any study. The factorial portion of the design allows for the estimation of the first-order and interaction terms in the model. To make appropriate choice of central composite design, [12] in their study stipulated the criteria for selecting the right central composite design among the variations of CCD.[13] Stressed on the biological applications rather than applications in the physical and engineering sciences of RSM. They applied the RSM in agriculture and biometric research in general. However, they emphasized the use of nonlinear models to describe the behavior of biological data.[14] highlighted the practical applications of RSM in the chemical and processing fields and recently reviewed by [9]. In health science, [15] applied RSM in a study of the effect of demographic characteristics on HIV risk in South Africa. This study was a follow up on their previous work [16] where a two-level fractional factorial design was used to develop a ranked list of important and unimportant demographic characteristics affecting the HIV status of pregnant mothers in South Africa.The main objective of this study is to develop an approach for better understanding of the relationship between variables for optimum amplitude of accommodation. This will be achieve by fitting an appropriate model for amplitude of accommodation and also determine the main and or interactive effects of a factorial combination age, quantity of caffeine intake and weight on amplitude of accommodation using the central composite design of a second order design.
2. Design of Experiments
The data for this study consist of randomly selected 50 healthy individuals from the optometry department of Imo State University of ages ranging from 18 to 35 years, who were administered 250, 200, 150 mg of caffeine drink and there amplitude of accommodation taken after 60 minutes.In this study, CCD was used for experimental design model with 5-level- 3 factors experiment. A 5-level-3-factor of face centre cube central composite design was employed in the amplitude of accommodation optimization process requiring 50 experimental runs. Age ( ), Caffeine quantity intake (
 ) and Weight of the individual (
 ) are the independent variables to optimize the response value of interest (Amplitude of Accommodation). In developing the regression model, the test factors were coded according to the formulae given as
 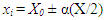 | (2) |
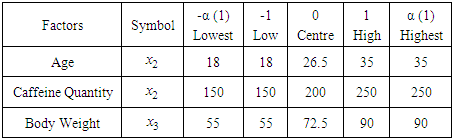
Where xi is a coded variable of the ith variable, X0 is the average of the variable in high and low level, X is the range between the variable at high level and variable at low level and α is the axial parameter. Table 1 is the estimated values of the three factors at five levels.Table 1. Three Factors at Five Levels Estimated Values
 |
| |
|
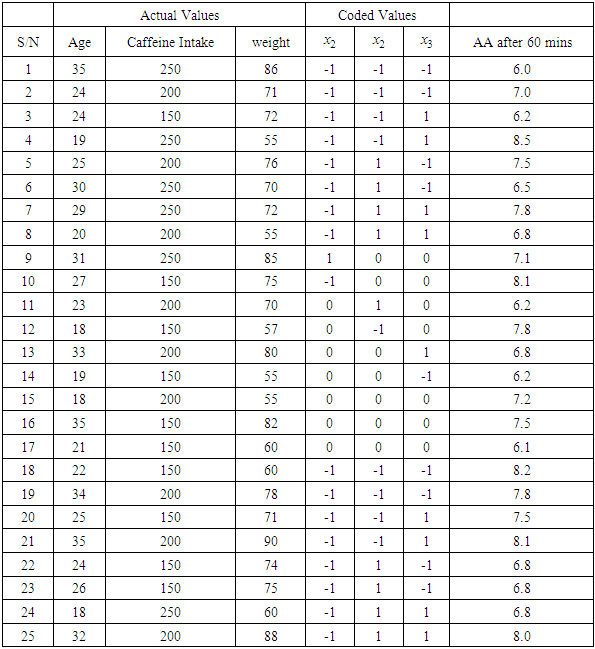
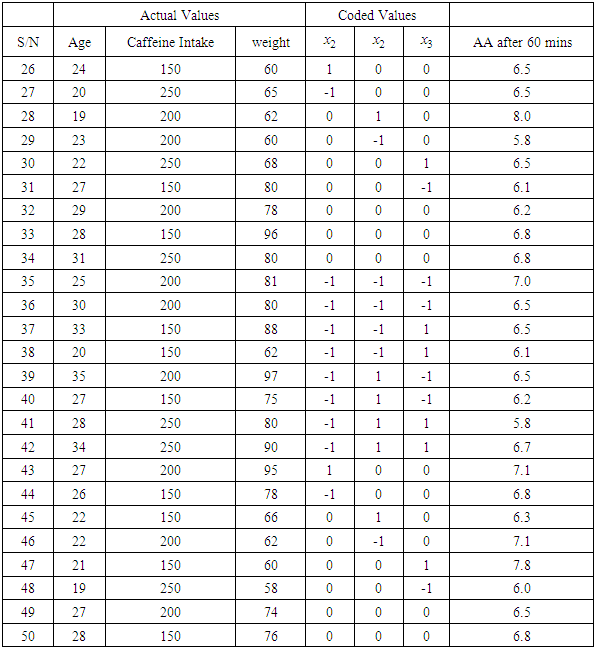
As earlier noted, the CCD consists of the following three parts: (i) A complete (or a fraction of) 2k factorial design whose factors’ levels are coded as -1, 1. This is called the factorial portion of the design. The factorial portion in this study was replicated three times and the number of factors k = 3 which are Age, Caffeine intake (mg) and weight (kg) of the individuals, (ii) An axial portion consisting of 2k points arranged so that two points are chosen on the axis of each control variable at a distance of α from the design center (chosen as the point at the origin of the coordinates system). We refer to α as the axial parameter. The axial portion of this study was also replicated three times and α = 1 which makes this design a Face-center cube central composite design. The choice of Face-center cube central composite design was as a result of other variations of CCD not being significant. (iii) A center point n0. The center-point for this study is 8.Therefore the total number of design points for a CCD is given as N = 2k + 2k +n0. But for this study N = 3(2k) + 3(2k) +8n0 which makes the number of runs for study to be 50 runs that is N = 3(23) + 3(2*3) + 8 = 50.Table 2 is the full factorial central composite design matrix for the actual values of the data for the study with the coded values.Table 2. Full Factorial Central Composite Design Matrix and Experimental Results
 |
| |
|
Table 3. Full Factorial Central Composite Design Matrix and Experimental Results Cont’
 |
| |
|
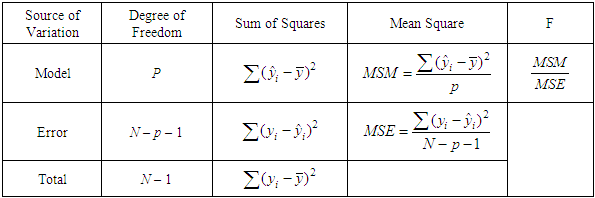
The analysis of variance (ANOVA) is used to examine the effect and role of each and every one of the linear, quadratic and cross models. The essence was to check and ascertain the model that is most statistically fit for the approximation of the response pattern. It also helped us to analyze the outstanding error that is responsible for Lack-of-Fit (LOF) and to check for the model that sufficiently represented the true response surface. The effect of each factor is inconsistent when compared to the level of statistical accuracy measure. It is also by the aid of analysis of variance that the experiment can be adequately predictable when varied factor is removed. The quotient of the Average (Mean) Sum of Squares of regression model (MSM) and Average (Mean) Sum of Squares of Error (MSE) give the value of F calculated.Table 4. ANOVA Table for the Explanatory Variables
 |
| |
|
The square of the sample correlation is equal to the ratio of the model sum of squares to the total sum of squares:  | (3) |
This formalizes the interpretation of r² as explaining the fraction of variability in Model summary statistics focus on the model maximizing the Adjusted R-Squared and the Predicted R-Squared. R-Squared refer to a measure of proportion of the variation in the dependent variable that is explained by the independent variable for a regression model. Adjusted R-Squared it is used to adjust the statistic based on the number of independent variable in the model. It compares the explanatory power of regression model that contain different independent predictors. In this case, since the multiple regression models have more than one variable, Adjusted R-Squared is the most preferred.
3. Result and Analysis
3.1. Mathematical Model
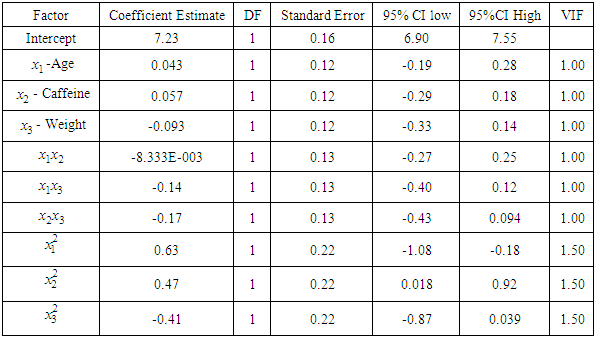
The data obtained from the experiment were analyzed using the Design Expert software to develop the mathematical model. The multiple regressions was obtained by employing a least square technique to predict quadratic polynomial model for the amplitude of accommodation and results are presented in Table 5.Table 5. Regression Coefficients Estimates
 |
| |
|
The following equation was generated for the model. The coded and actual equation of this study were relatively the same. It is a point of notice that both equations give true representation of the approximated quadratic model for the design of the experiment. Coded Equation: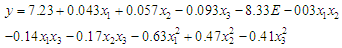
3.2. ANOVA for Response Surface Quadratic Model
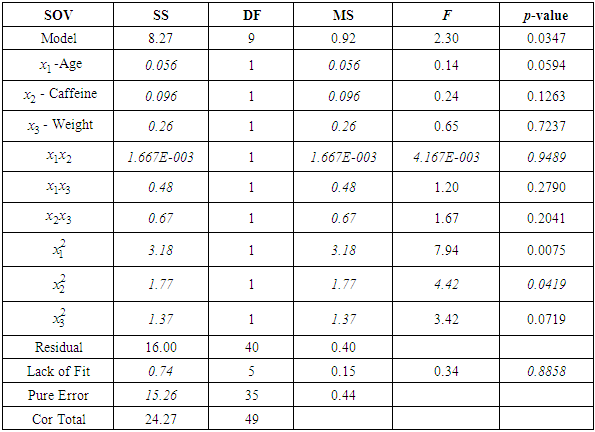
Analysis of variance (ANOVA) was used to check the adequacy of the model for the response. The value of “Prob.> F” in Table 6 for the model is less than 0.05 which indicates that the model is significant and also adequate for the model. The Model F-value of 2.30 implies there is a 3.47% chance that a "Model F-Value" this large could occur due to noise. Age, Caffeine intake and weight were significant in the linear terms model while Age and Caffeine intake were significant in squared terms of the model.Table 6. ANOVA for Response Surface Quadratic Model
 |
| |
|
3.3. Model Fit Statistics
3.3.1. Sequential Model Sum of Squares
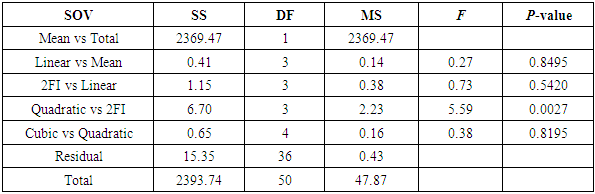
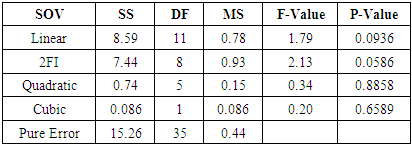
Sequential Model Sum of Squares focuses on the highest order polynomial where the additional terms are significant and the model is not aliased. This technique shows the effect of increasing terms to the complexity of the total model.Table 7 shows that the quadratic model is more significant than the two-factor interaction model (5.59 > 0.0027) and also the two-factor interaction model is more significant than linear model (0.73 > 0.5420) that is (F-value > P-value).Table 7. Sequential Model Sum of Squares
 |
| |
|
3.3.2. Model Summary Statistics
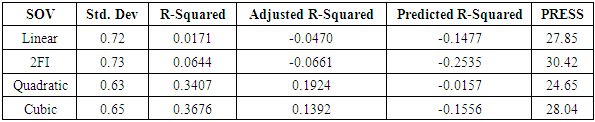
Model Summary Statistics focus on the model maximizing the Adjusted R-Squared and the Predicted R-Squared. PRESS measures how well the model fits each point in the design. To calculate PRESS, the model is used to estimate each point using all of the design points except the one being estimated. PRESS is the sum of the squared differences between the estimated values and the actual values over all the points. A good model will have a low RMSE, a large predicted r2, and a low PRESS. Table 8 shows that the quadratic model has the the least standard deviation with a negative Predicted R-Squared. This implies that the overall mean is a better predictor of the response than the current model. Table 8. Model Summary Statistics
 |
| |
|
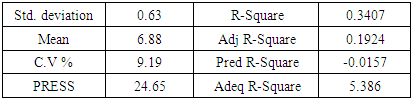
Adeq Precision measures the signal to noise ratio. A ratio greater than 4 is desirable. Table 9 shows Adeq ratio of 5.386 which indicating an adequate signal. This model can be used to navigate the design space.Table 9. Model Summary Statistics
 |
| |
|
3.3.3. Lack of Fit
Non-significant lack of fit is good when one wants to fit a model. Table 10 shows that quadratic model lack of fit is not significant (Values of "Prob > F" less than 0.0500). F-value of 0.34 implies the Lack of Fit is not significant relative to the pure error. Also there is a 88.58% chance that a "Lack of Fit F-value" this large could occur due to noise. Table 10. Lack of Fit Tests
 |
| |
|
4. Conclusions and Recommendations
The RSM has shown to be useful for the design of experiments for investigating the effects of three evaluated factors: age, caffeine intake and body weight on the amplitude of accommodation. A quadratic model was found to best model for this study. This is because the model was significant and it had the least standard deviation with a negative Predicted R-Squared. The results also showed that, the variables (Age and Amount of Caffeine intake) were significant in the linear terms of the model but were not significant in interaction terms of the model. Also Age and Amount of Caffeine intake were significant in the squared terms of the model. In all, this proves that age and amount of caffeine intake have significant effect on the amplitude of accommodation. The response surface methodology added a new approach in studying the variables that affect amplitude of accommodation.
References
| [1] | Atchinson D.A (1994), Clinical measurement of amplitude of accommodation. Australian Optometry Magazine 15. |
| [2] | Akujobi A.U, Vincent C.L, Ekenze C.J, Obioma-Elemba J.E and Vincent C.C (2019), Assessment of Amplitude of Accommodation (AA) in Owerri Municipal Council, Southeast, Nigeria, Journal of Ophthalmic Vis Res. 14(3): 306–314. doi: 10.18502/jovr.v14i3.4787. |
| [3] | Bailey R, (1998), Assessing the Predictive Ability of the Test-Positive Findings of an Elementary School Vision Screening. Optometry Vision Science 75(9): 682-691. |
| [4] | Karania R and Evans BJ (2006) The Mallet Fixation Disparity Test: Influence Of Test Instructions And Relationship With Symptoms. Ophthalmic Physiology Optomery 26(5): 507-522. |
| [5] | Majumder C & Ying LS (2015), Comparison of Amplitude of Accommodation in Different Vertical Viewing Angles. Optometry and Visual Performance 3(5): 276-280. |
| [6] | S. Abokyi, J. Owusu-Mensah and K. A. Osei (2017), Caffeine intake is associated with pupil dilation and enhanced accommodation, Eye (Lond) 31(4): 615 -619. |
| [7] | Stella E. Odjimogho and Efe S. Odjimogho (2011), Effects of caffeine on near vision of healthy subjects in Benin metropolis. Nigerian Society for Experimental Biology Journal, 11(3) 203-208. |
| [8] | Murari, Swetha; Ho, Amiee; Hayes, John; and Cooper Scott, (2018) Effects of Caffeine intake on Visual Performance of the Eye Among Normal Healthy Adults. College of Optometry. 842. https://commons.pacificu.edu/opt/842. |
| [9] | Myers R.H, Montgomery D.C, Vining G.G, (2004) Response Surface Methodology: A Retrospective and Literature Survey. Journal of Quality Technology. 36: 53–77. |
| [10] | Box G.E.P & Wilson K.B. (1951), On the Experimental Attainment of Optimum Conditions. Journal of the Royal Statistical Society 13: 1– 45. |
| [11] | Myers, R. H., Montgomery, D. C., and Vining, G. G. (2002), Generalized Linear Models with Applications in Engineering and the Sciences, John Wiley & Sons, NewYork. |
| [12] | B.A. Oyejola and J.C. Nwanya (2015), Selecting the Right Central Composite Design, International Journal of Statistics and Application, 5(1), 21 - 30. |
| [13] | Mead, R & Pike D.J (1975). A Review of Response Surface Methodology from a Biometric Viewpoint. Biometrics. 31: 803–851. |
| [14] | Hill W.J & Hunter W.G. (1966), A Review of Response Surface Methodology: A Literature Survey. Technometrics. 8 (4): 571–590. |
| [15] | Sibanda W & Pretorius P (2013), Comparative Study of the Application of Central Composite Face-Centre (CCF) and Box–Behnken Designs (BBD) To Study The Effect of Demographic Characteristics On HIV Risk In South Africa. Network Model Anal Health Inform Bioinformatics 2: 137–146. |
| [16] | Sibanda W & Pretorius P (2011), Application of Two-Level Fractional Factorial Design to Determine and Optimize the Effect of Demographic Characteristics on HIV Prevalence Using the 2006 South African Annual Antenatal HIV and Syphilis zero prevalence Data. International Journal of Computation Application 35(12): 0975–8887. |

 Abstract
 Reference
 Full-Text PDF
 Full-text HTML