-
Paper Information
- Paper Submission
-
Journal Information
- About This Journal
- Editorial Board
- Current Issue
- Archive
- Author Guidelines
- Contact Us
International Journal of Statistics and Applications
p-ISSN: 2168-5193 e-ISSN: 2168-5215
2021; 11(4): 84-91
doi:10.5923/j.statistics.20211104.02
Received: Nov. 8, 2021; Accepted: Nov. 27, 2021; Published: Nov. 29, 2021

Modeling the Effects of Plant Spacing and Inorganic Fertilizer on Potato Tuber using Factorial Design in Kabiemit Location, Nandi County, Kenya
 Abstract
 Reference
 Full-Text PDF
 Full-text HTML
Ronald K. Kaptich , Betty C. Korir, Julius K. Koech
Department of Mathematics & Computer Science University of Eldoret, Kenya
Correspondence to: Ronald K. Kaptich , Department of Mathematics & Computer Science University of Eldoret, Kenya.
| Email: |  |
Copyright © 2021 The Author(s). Published by Scientific & Academic Publishing.
This work is licensed under the Creative Commons Attribution International License (CC BY).
http://creativecommons.org/licenses/by/4.0/

A two-level full factorial and the fractional factorial experiments  with three replicates were employed to measure the effects of the selected factors on the potato tuber. The study used the Randomized Complete Block Design (RCBD), where replicates acted as blocks and treatments randomized within blocks. The first order models were fitted by using the method of least squares. The data collected was subjected to data analysis using descriptive statistics and ANOVA utilizing R statistical software. The descriptive statistics was presented by use of charts, frequency distribution tables and graphical techniques. The effect of inter and intra row spacing shows a negative linear effect on the yield of potato tuber only while nitrogen and phosphorus showed a positive linear effect on both the yield and size of potato tuber. Additionally, the use of fractional factorial design gave better model fit
  when compared to full factorial experiment
  . The current study will be important in designing the necessary interventions within the county in order to improve production of potato crop.
Keywords: RCBD, First Order Model, RSM, ANOVA, R soft ware
Cite this paper: Ronald K. Kaptich , Betty C. Korir, Julius K. Koech , Modeling the Effects of Plant Spacing and Inorganic Fertilizer on Potato Tuber using Factorial Design in Kabiemit Location, Nandi County, Kenya, International Journal of Statistics and Applications, Vol. 11 No. 4, 2021, pp. 84-91. doi: 10.5923/j.statistics.20211104.02.
Article Outline
1. Introduction
- The Irish potato, solanum tuberosum, which is a common species grown worldwide is a major food and cash crop in many countries around the world. Potato is the world’s fourth-largest food crop, following maize, wheat and rice. Its production approximately ranges from (225 to 285 million tons) and occurs in 10% of the arable land (Mengui et al., 2019). However, according to the report of the International Potato Center (CIP) and the Food Agricultural Organization (FAO), the production of Irish potato crop is projected to increase in the coming years due to the effect of population pressure and increased consumption in both developing and developed countries (CIP Annual Report, 2020; Alexandratos and Bruinsma. 2012). There is a global and more so local demand due to increase in urbanization and a growing population, therefore the appeal of fast food such as French fries and potato crisps in many developing countries. The tubers contain practically all essential dietary constituents like carbohydrates, essential nutrients, protein, vitamins, and minerals (Sriom et al, 2017).Research by other researchers elsewhere, shows that Agriculture in East African countries is dominated mainly by smallholder farmers and they contribute up to 90% of agricultural production in the region (Salami et al. 2010; Wiggins and Keats, 2013). Agriculture is an important sector in the Kenyan economy, contributing about 26% to the GDP (Gitau et al., 2009). Potato farming has become very popular in Kenya, more than 1/3 of Kenya’s agricultural produce is exported and this accounts for 65% of Kenya’s total exports (GOK, 2007). About 80% of Kenyans work in the agricultural sector; most of whom are small scale subsistence farmers that depend on rainfall for production of their staple foods (ANN, 2009). Therefore, the current study will be important in investigating the effects of both inorganic fertilizers nitrogen and phosphorus and crop spacing in improving the yield gap of potato crop in Kabiemit location, in Nandi County, Kenya.
2. Materials and Methods
2.1. Description of Experimental Study Site
- The research was carried out at the location of Kabiemit, which is situated in the division of Kipkaren in the northern part of Nandi County along the Uasin Gishu County boundary. It is situated in the Rift valley portion of Kenya (0.50000 N, 35.07190 E). It is approximately 40 km along the Eldoret - Chepterwai road from Eldoret city. Kabiemit is situated in the western highlands of the Rift Valley, so most of the inhabitants are farmers. They are mixed farmers and they domesticate animals like cattle, sheep and goats. The main cash crop in the Kabiemit location is maize, followed by sugar cane, which was introduced seven years ago. The majority of farmers are self-employed and they depend on the farm output to raise their families and to educate their children.
2.2. Treatments and Experimental Design
- Randomized Complete Block Design (RCBD) with three replications in factorial arrangement was employed for the study. Two levels of inorganic fertilizers are as follows. • 155 Kg
 ha-1 of triple superphosphate (TSP) and 80 Kg N ha-1 of urea • 77 Kg
  ha-1 of triple superphosphate (TSP) and 40 Kg N ha-1 of urea And two levels of combined inter row spacing and intra row spacing; • A spacing of 75cm between row and 30 cm between plants
  • A spacing of 65 cm between rows and 20 cm between plants and finally
  The distance between blocks and plots was 1 m and 0.5 m respectively. The plot size 4.0 m by 4.0 m = 16.0 m2 was applied for all treatments. The treatments consisted of Nitrogen (N) supplied as Urea (46% N) at two rates (40 and 80 kg N
 ), with all fertilizers being applied at planting. Phosphorus (P) was also supplied at planting time as triple super phosphate (46%
  ) at two rates namely (77 and 155 kg
 ) respectively. All fertilizers were applied at planting and were done per crop point using estimates from international fertilizer manual (IFA, 1992; Koech et al., 2017). The control of bacterial wilt and potato blight was done by using BM Enrich® and Ridomil® respectively.
 2.3. Response Surface Methodology
- RSM is a set of techniques (Dette & Yuri, 2014; Myers, H.R., Douglas C.M., Anderson & Cook, C.M. 2009; Montgomery D.C, 2009), both mathematical and statistical, that helps study and realizes the relationship between a given response(s) and some independent variables with the sole aim of optimizing the response. In other words, it is composed of techniques, both mathematical and statistical, for optimizing response(s) - dependent variable(s) - based on some factor(s) of interest- independent variable(s). The main objective in such cases is to optimize the response when the ‘about right’ levels of factors are combined. ‘Right’ factor levels are estimates that are believed to bring about estimated optimal outcome(s). If y is taken to be the response of interest, then it becomes a function of factor(s) of interest the independent variables
 | (1) |

2.4. Types of RSM
- There are basically four types of RSMs; the first-order, the second-order, the third order and the fourth-order model but the current study focused on first-order model only.
2.4.1. First-Order Model
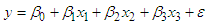
- The approximate response function is known as a first-order model if the supplied answer is defined by a linear function of independent variables. When trying to estimate the real response from a tiny section of an independent variable space with low curvature in the response function, this is required. Inclined planes are described by first-order models as flat surfaces that are likely slanted. These models can be used to describe parts of a response surface that are not affected by maxima, minima, ridge lines, or other sharply curved areas.As a result, the first model's general goal is to ascend the response surface, with higher models (second order) exploring the optimum area.A first-order model with two explanatory variables may be written as follows:
 | (2) |
 is the intercept, and
  ,
,  and
and  are the regression coefficients for the independent variables
  ,
,  and
and  respectively. The form of the first-order model is also referred to as the main effect model, because it includes only the main effects of the independent variables. A fitted first order polynomial model with k factors has the form;
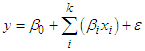 | (3) |
 | (4) |
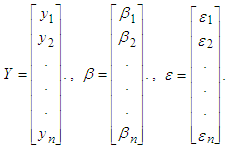 and the X is design matrix
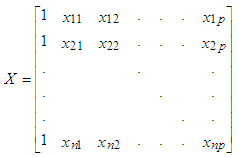 We will code the data to center it at 0, and use
  . One of the designs used with first order models is
  factorials designs. This gives
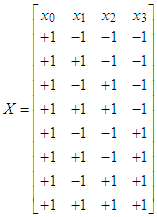
 | (5) |
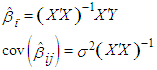
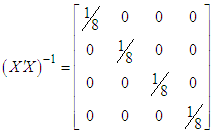 Since this is diagonal the estimates of the regression coefficients are independent. Then
 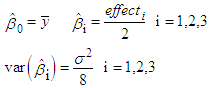 | (6) |
 design with n replicates, each estimated effect is the differences between two means: The first mean is the average of all data corresponding to the + rows in an effect column and the second mean is the average of all data corresponding to the − rows in an effect column. The average effect of Factor A, denoted A, is
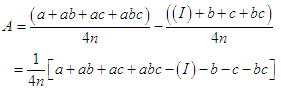 The average effect of Factor B, denoted B, is
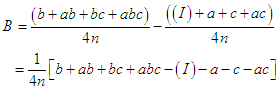 The average effect of Factor C, denoted C, is
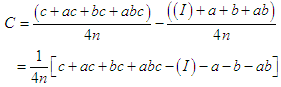
2.4.2. Second-Order Model
- If there is a curvature in the response surface, then first-order model will not be suitable. A second-order model is then considered. Second order models must have at least three levels for each factor for example 3k design will be feasible e.g. when k = 2 the levels would be -1, 0 and 1.
2.5. Blocking in Response Surface Design
- Blocking is the most common strategy used in variance reduction design. A group of homogenous units is referred to as a block of units. It's possible that there are field plots in the same general area, where samples tested at the same time, or units measured from the same source. We expect comparable results from units within a block based on their commonalities. We aim for homogeneity of units inside blocks while creating blocks, however units within different blocks might differ. Units are frequently organized into blocks in incomplete block designs, but the blocks do not contain enough units to handle all the treatments.
3. Results
3.1. Optimal Yield and Size of Potato Tuber
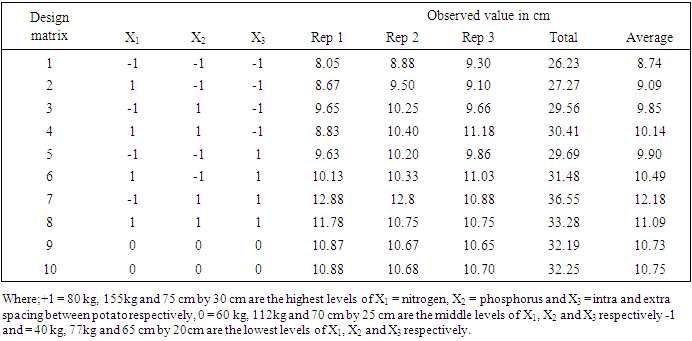
- A two level factorial experiment was used to investigate the effects of inorganic fertilizer and inter and intra-row spacing on potato tuber yield and size distribution with three replicates. The largest size of the potato tuber was 12.88, 12.80, and 11.17 cm when the mixture of nitrogen and phosphorus components was 40 and 155 kg ha-1 and inter and intra row spacing of 75 by 30 cm for the first two replicates, and 80 and 155 kg ha-1 and intra and inter row spacing of 65 by 20 cm for the last replicate, as shown in Table 1. The smallest potato tuber sizes were 8.05, 8.88, and 9.10 cm when the nitrogen and phosphorus component combinations were 40 and 77 kg ha-1 for the first two replicates and 80 kg and 77 kg ha-1 for the last replication, respectively, with intra and inter row spacing of 65 by 20 cm in all replicates. On average, when the nitrogen and phosphorus factors were 40 and 155 kg ha-1, respectively, and the inter and intra row spacing was 75 by 30 cm, the largest size of 12.18 cm was attained. The smallest size was 8.74 cm, which was achieved when the mixture components were 40 and 77 kilogram, respectively, with 65 by 20 cm inter and intra row spacing (Table 1).
|
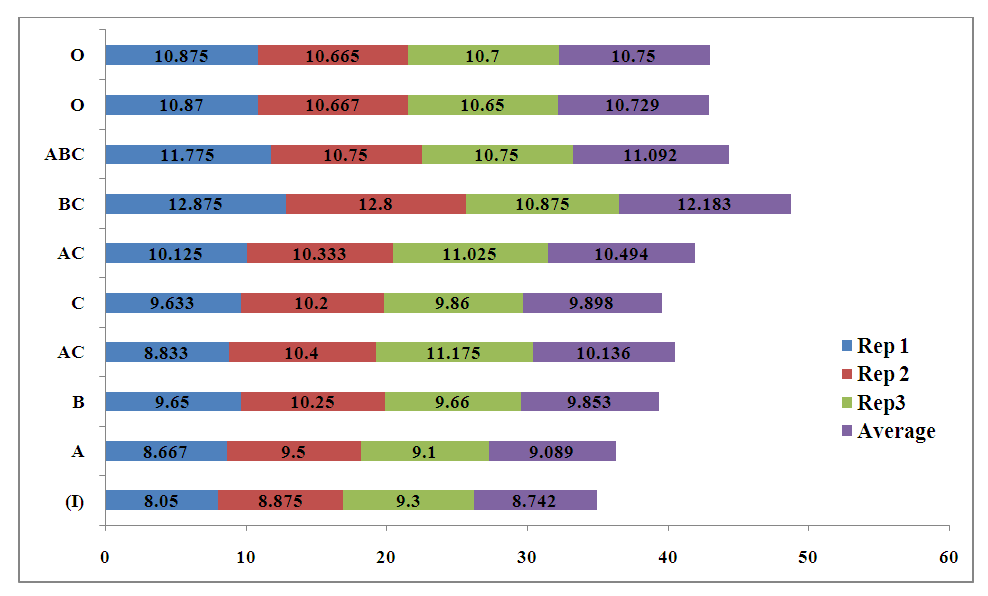 | Figure 1. Compound Bar graph for size of potatoes in cm |
|
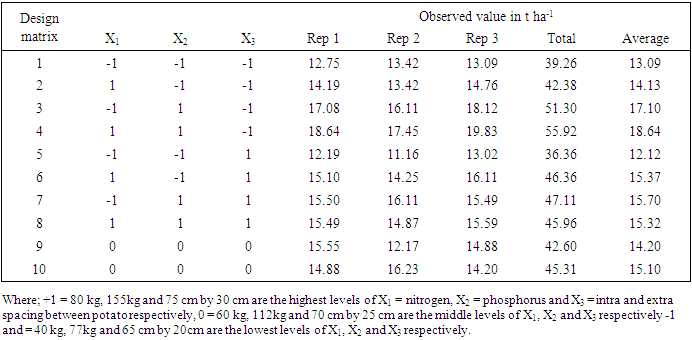
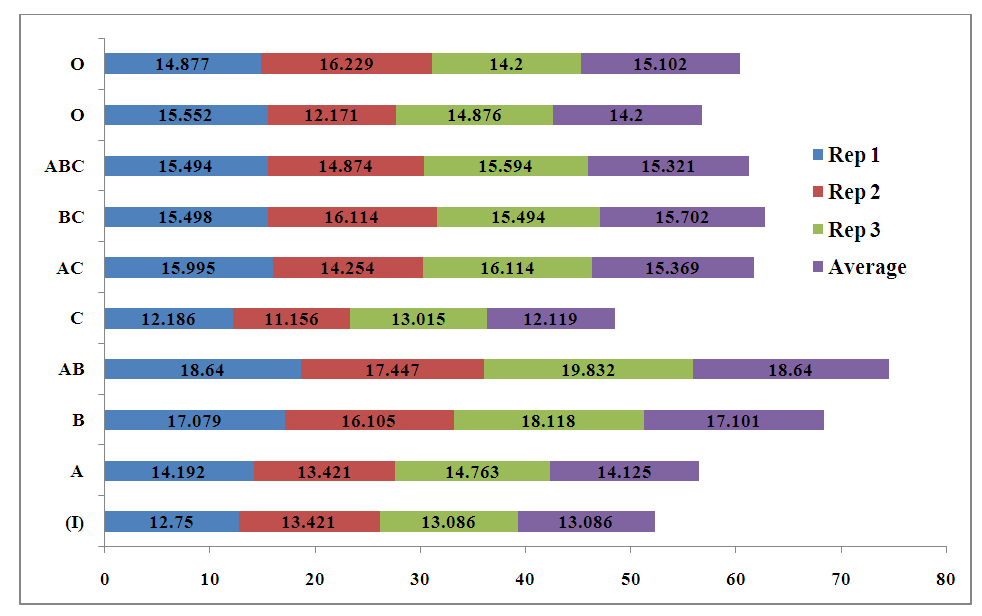 | Figure 2. Compound Bar graph for Yield of potato tuber in t ha-1 |
3.2. Regression Output from First-Order Factorial Design
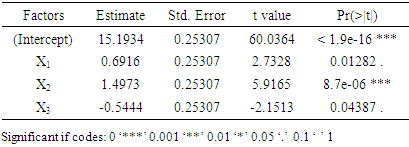
- The first-order model was used to estimate the parameter values (regression coefficients) in this section, with data on the yield and size of potato tubers as the response variables of interest. The output of the analysis for the first-order model for potato tuber yield with all parameter estimations is given in (Table 3). The results of the regression model for potato tuber yield revealed that nitrogen (
 = 0.6916 p = 0.01282.) and phosphorus (
 = 1.49733, p = 0.0000087) had positive linear effects, whereas the crop spacing (
 = -0.54442, p = 0.04387.) had a negative influence. This implies increasing the inorganic fertilizer levels for N and P, is known to increase the potato tuber yield output, whereas increasing crop spacing contrary decreases potato tuber yield (Table 3).
|
|
 | (7) |
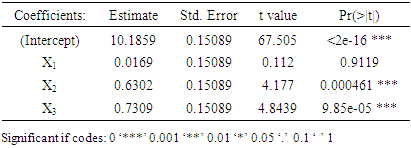
 = 0.73087, p = 0.0000985), nitrogen (
 = 0.01687, p = 0.9119), and phosphorus (
 = 0.63021, p = 0.000461) respectively. The adjusted
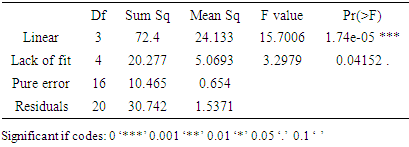
  had a value of 62.2%. Therefore, this implies the fitted model could explain 62.2% of the variation in the model (Table 5).
|
|
 | (8) |
4. Discussion
- Two level factorial designs have continued to be frequently used in experimental designs. The amount of inorganic fertilizer given to plants was investigated in the current study and was found to have a strong impact on the yield and size of potato tuber. The highest overall tuber yield was 18.64t ha-1 when the treatment factors considered were nitrogen, phosphorous and crop spacing respectively. The results are similar to findings from other researchers which showed that the average global production of potatoes is at 17.4 t/ha (Tunio et al., 2019). Also, research by Ali and Solomon (2016) is in agreement with the current findings where it has been reported that the maximum commercial yield is obtained when P and N are fixed at high levels as evidenced in the current study. Furthermore, the current findings are contrary to the study that was conducted in Ethiopia, which showed that the average yield for potato tuber per hectare was 9.0 t/ha in 2013/14 (Central Statistical Agency (CSA), 2013). On the other hand, the optimal potato tuber size achieved in the current study was 12.83 cm. These results differ from those investigated by Koech et al., (2017), where the three components (nitrogen, phosphorus, and potassium) were used where the maximum size of potato tuber was found to be 17.62 cm. A number of production constraints that account for low yields for the potato crop have been identified in many developing countries, including the use of local cultivars instead of using modern approved seeds because of cost implications, and this causes high susceptibility to late blight which leads to yield losses (Dagne et al., 2018).Moreover, agricultural researchers have identified plant spacing to be an efficient agricultural method for increasing the yield of potato tubers. The importance of crop planting density in the current study region was shown to have a positive effect on the yield and size of potato tuber. Therefore, the possibility of securing high yield has been estimated to depend on the proper consideration of the optimum number of plants per unit area (Dagne et al., 2018). Therefore, researchers elsewhere have indicated the need to reduce the crop spacing to improve the yield of potato tubers per hectare. Therefore, the expected highest yield of potato tubers is obtained when cultivars are planted at narrow spacing as opposed to wider spacing (Dagne et al., 2018).Similarly, 75 cm by 30 cm plant spacing produced the largest tuber size of 12.83 cm, whereas when the crop spacing was reduced to 65 by 20 cm, the size of the tuber dropped to 8.72 cm. This is in line with (Gebremedhin W., Gebre E., & Lemaga, B. 2008), who stated that closer spacing produces a higher yield but smaller tubers, and (Kinde, L., & Zewdu, A. 2016), who stated that tubers are more plentiful when spacing is narrow. Burton disagrees with this study, claiming that closer spacing boosted quality and salable yield. These results also differ from research done by other researchers elsewhere where they documented the highest size of potato tuber to be 17.72 cm when the three inorganic fertilizers, nitrogen, phosphorus, and potassium were used and the optimal potato tuber size obtained was 17.62 cm (Koech et al., 2017).The potato crop has been shown to require high levels of phosphorus (P) fertilizer than other inorganic fertilizers for its growth (FAO, 2019; Hopkins and Hansen, 2019). Researchers elsewhere have demonstrated the inorganic fertilizer nitrogen to have a strong positive effect on the yield of potato tubers. The results obtained showed that increasing the nitrogen fertilizer rate increased the average tuber yield until a certain level when yield tends to remain constant (Fayera, 2017). Similar findings were also obtained by Alemayehu et al. (2015), who reported that marketable potato tuber yields were significantly increased with increase in the application of nitrogen fertilizer up to 110 kg. The current findings are in line with the study conducted by Koech and other researchers elsewhere in Western Kenya which showed the effect of N and P to have a strong correlation with increased yield and size of potato tubers (Koech et al., 2017). Nevertheless, the obtained results were contrary to the findings of the study conducted in Southern Ethiopia, which showed that increasing the rates of nitrogen fertilizer application decreased the yield of potato tubers considerably (Desalegn et al, 2016). Furthermore, research indicates phosphorous continues to remain critical in the growth of plants and also on the plant health (Workat, 2019). Therefore, the growth of potato plant has been shown to depend on several factors which include environ-mental conditions and genotype-environment interaction factors (Workat, 2019). additionally, use of Nitrogen fertilizer is the factor known for essential crop protein synthesis, respiration, and growth of tubers (Kavvadias, V., C. Paschalidis, G. Akrivos, and D. Petropoulos 2012) however, too much use of N rates in the soils has been shown by researchers to reduce potato tuber production (Ruza, A., I. Skrabule, & A. Vaivode. 2013).However, the obtained results were contrary to the findings of the study conducted in Southern Ethiopia which showed that increasing the rates of nitrogen fertilizer application decreased the yield of potato tuber considerably (Desalegn et al, 2016).The current study used both full and fractional factorial designs in estimating yield and size distribution of potato tuber. In fitting both the full and the fractional factorial design on the yield and size of potato tuber, it was clear that both the models fitted well to the observed data, with an adjusted
 of at least 60%. This shows that both the fitted models could explain more than 60% of the variation in the mean response.
 5. Conclusions and Recommendations
5.1. Conclusions
- The application of a two level factorial designs are appropriate in measuring the recommended levels of inorganic fertilizers (P and N) and crop spacing that give optimal yield and size of potato tuber. When first order factorial design was used, it was observed that Nitrogen fertilizer had a positive effect on the yield of potato tuber. Similarly phosphorus fertilizer had a positive influence on the yield and size of potato tubers. It is important for farmers to use these fertilizers at recommended rates when planting potatoes in their farms as they tend to benefit with high yields and therefore improved incomes at their disposal. The recommended level for crop spacing for farmers this study demonstrated that a plant spacing of 75 x 30 cm resulted in the production of huge potato tubers that can be sold, as opposed to a closer spacing of 65 x 20 cm. A higher yield can be obtained by spacing the plants closer together, but the yield is too little to be sold. The coefficient of determination
 for all ANOVA models was found to be greater than 0.6, showing that all the adopted designs are best for modeling the effects of the given factors deemed to have a strong effect on the yield and size of potato tuber.
5.2. Recommendations
- Farmers should adjust to a wider crop spacing of 75 by 30 cm in order to harvest huge tubers that can be sold locally or abroad, allowing them to invest in this area.Farmers are encouraged to use both the inorganic fertilizers nitrogen and phosphorous, as they will tend to have better improved yields and marketable potato tubers that will be appealing to the majority of customers in the local and international markets.For farmers to improve on their output, other inorganic and organic fertilizer can be tested with this crop, as this may give better yields and marketable tubers with less costs and hence high returns to farmers.