-
Paper Information
- Previous Paper
- Paper Submission
-
Journal Information
- About This Journal
- Editorial Board
- Current Issue
- Archive
- Author Guidelines
- Contact Us
International Journal of Statistics and Applications
p-ISSN: 2168-5193 e-ISSN: 2168-5215
2021; 11(3): 70-77
doi:10.5923/j.statistics.20211103.03
Received: Aug. 31, 2021; Accepted: Sep. 19, 2021; Published: Sep. 26, 2021

Using Factor Analysis to Determine the Most Important Disease Causes: Under-Five Mortality in Tabuk Region, 2017
 Abstract
 Reference
 Full-Text PDF
 Full-text HTML
Ehab Ahmed M. Frah, Abdalla Ahmed Alkhalifa
Department of Statistics, Faculty of Science, University of Tabuk, KSA
Correspondence to: Ehab Ahmed M. Frah, Department of Statistics, Faculty of Science, University of Tabuk, KSA.
| Email: |  |
Copyright © 2021 The Author(s). Published by Scientific & Academic Publishing.
This work is licensed under the Creative Commons Attribution International License (CC BY).
http://creativecommons.org/licenses/by/4.0/

Familiarity and understanding of causes of death among children aged under five years old are essential to developing policy and programs. The causes of under-five mortality rate (U5MR) help decision-makers assess programmatic needs, prioritize interventions and monitor progress. This study investigates the main causes of disease-related U5MR in the Tabuk Region. It introduces the definition of U5MR and provides an overview of its scale, its direct causes, and underlying causative factors, as well as analyzing key interventions needed to avert child mortality and morbidity. Data from the 2000-2015 Ministry of Health annual statistical reports were used to determine disease-related mortality of children aged under five in the Tabuk Region. Factor analysis was used to analyze the data and reduce the main cause factors for U5MR. The study identified two main causative factors in U5MR in the Tabuk Region: (1) communicable diseases, perinatal and nutritional conditions; and (2) non-communicable diseases and children’s injuries are reduced form all diseases that cause the death of U5MR in the existing framework over the study period, 2000-2015.
Keywords: U5MR, Disease Causes, Factor Analysis and Tabuk
Cite this paper: Ehab Ahmed M. Frah, Abdalla Ahmed Alkhalifa, Using Factor Analysis to Determine the Most Important Disease Causes: Under-Five Mortality in Tabuk Region, 2017, International Journal of Statistics and Applications, Vol. 11 No. 3, 2021, pp. 70-77. doi: 10.5923/j.statistics.20211103.03.
Article Outline
1. Introduction
- 1) Defining under-five mortality rate (U5MR)The life-course approach to health care recognizes the continuum from birth through childhood, adolescence, adulthood and old age, reflecting the principle that antenatal care has longitudinal (life-span) impacts on individual health and development in later years as well as on immediate well-being. The life-course categorizes the period of life before adulthood into three age subgroups, based on epidemiology and health-care needs: (1) the first five years (i.e. children aged under-five, ‘U5’); (2) the next five years (older children); and (3) the second decade of life (adolescents). In order to address the specific health challenges and needs of young children more effectively, the first five years of life are further subdivided into the neonatal period (the first 28 days of life), infancy (the first year of life) and pre-school years (1-5 years). While the U5 mortality rate (U5MR) has dramatically declined worldwide since the early 20th century, it remains a major concern of the international community. To address this challenge, it is required to measure accurately the levels and causes of mortality among this population subgroup. The general parameters of mortality for U5s were established by Fleiss (1981) and the most recent taxonomy is as follows [1]:a) Neonatal mortality rate (NNMR) – the probability of a child dying between 0 and 28 days of age;b) The infant mortality rate (IMR) – the probability of a child dying before his or her first birthday; and c) The under-five mortality rate (U5MR) – the probability of a child dying before reaching the age of five years. All rates relate to the number of deaths occurring among children of the specific age group to the size of the population at risk and are expressed per 1000 live births. Relating the number of deaths to the size of the population at risk allows for comparison between different populations and gives an equity dimension to the measure. U5MR and IMR are broadly standard, and they are among the most sensitive indicators of a country’s general socioeconomic situation and quality of life (QoL). Mortality among infants reflects both the specific problems affecting U5s and the structural factors that affect the health of entire populations (due to the longitudinal impacts of U5 health as well as general statistical correlation).2) U5MR levelOf 136 million babies born into the world in 2011, about 5 million were estimated to have died before their first birthday, and an additional 2 million were expected to die before reaching the age of under-five or pre-school age. These correspond to U5MR of 51 per 1000 live births and IMR of 37 per 1000 live births (UN Inter-Agency Group for Child Mortality Estimation [UNCME], 2012). These mortality levels indicate that one in every 20 children dies before reaching his or her fifth birthday, and one in every 27 children does not survive until his or her first birthday.However, massive progress has been made over the last century, and particularly over the last few decades in developing countries. The number of U5 deaths worldwide decreased from 1990 to 2011 by 42 percent, from about 12 million to an estimated 6.9 million in 2011. However, levels, trends and progress in both IMR and U5MR are unequally distributed. In low-income or the poorest countries, U5MR is over 150 per 1000 live births compared to less than 3 per 1000 live births in the richest countries [2].3) Main causes and associated risk factors of U5MRThe majority of U5MR is due to a small number of diseases and conditions. A large prevalence of 43% of these deaths occurs among babies aged 0−28 days (i.e., new-born babies), mainly as a result of preterm birth complications, birth asphyxia and trauma, and sepsis (UNCME, 2012). After the first 28 days until the age of five years the most mortalities are attributable to infectious diseases such as pneumonia (22%), diarrhoeal diseases (15%), malaria (12%) and HIV/AIDS (3%) [3].While the major causes and risk factors of U5MR are universal, their relative significance varies by region. In low-income countries, infectious diseases account for a large proportion of U5MR, while the main causes of such deaths in high-income countries are non-communicable diseases such as congenital anomalies (26%), prematurity (23%), injuries (13%) and birth asphyxia (6%) [4].Poor nutritional status in a child is strongly associated with vulnerability to diseases, delayed physical and mental development, and more risk of dying (Black et al., 2013). Although between 1990 and 2011 the proportion of children under the age of five who were underweight declined by 36 percent, under-nutrition is still estimated to be related to 45% of child deaths globally. In 2011, there were 165 million U5s who were stunted, and 52 million who were wasted [5].Low birth weight (LBW) can result either from premature delivery (before 37 weeks of gestation), restricted growth during gestation, or both. LBW is closely related to increased risks of neonatal mortality, cognitive problems and chronic diseases in later life. Every year more than 20 million babies are born with LBW worldwide, the bulk of them in Africa and South-East Asia [6] (UNICEF, 2004). The main risk factors associated with leading causes of death in children less than one-month-old (preterm birth, birth asphyxia and trauma and neonatal sepsis) are multiple and complex, and include complications during pregnancy and childbirth, such as bleeding, hypertension, prolonged and obstructed labor and infections, and lack of timely access to quality skilled care during and after birth to prevent or manage new-born complications. Significant interventions to reduce new-born mortality linked with preterm birth include early recognition and care-seeking by women at risk of preterm birth, administration of antenatal corticosteroids to promote foetal lung maturity, skilled care during birth and essential new-born care, including drying of the baby, ensuring warmth through skin-to-skin contact, early and exclusive breastfeeding, and other interventions as necessary [7]. Labor and childbirth must be provided by a skilled attendant. Early recognition of slow progress in labor and timely interventions to prevent prolonged labor and intrapartum foetal distress can decrease mortality. Operative delivery and immediate new-born resuscitation, if required, will reduce mortality and morbidity due to asphyxia. Adherence to good infection prevention practices during and immediately after childbirth, avoiding prolonged labor and prolonged rupture of membranes, use of antibiotics for suspected sepsis during labor, early and exclusive breastfeeding, appropriate cord care and early diagnosis and treatment of an infant for suspected sepsis contributes to reductions in new-born mortality due to sepsis. The risk factors mainly associated with the two leading causes of death in children aged between one month and five years (pneumonia and diarrhea) include low birth weight, lack of breastfeeding, undernutrition, overcrowded conditions, indoor air pollution, unsafe drinking water and food, and poor hygiene practices. In some regions, HIV infection and malaria are also significant risk factors.Basic evidence-based interventions to prevent pneumonia include immunization against specific pathogens, adequate nutrition (including exclusive breastfeeding for the first six months of life) and measures to decrease indoor air pollution (young children exposed to smoke from the use of household biomass fuel have an incidence of pneumonia double that of children not so exposed) (Dherani et al., 2008; Smith et al., 2011). Treatment of pneumonia requires better care-seeking and case management by a skilled health provider with antibiotics and oxygen for severe cases. Community case management of pneumonia with antibiotic treatment reduces mortality due to pneumonia by up to 35% [8].Poor sanitation, a lack of accessible clean water and inadequate personal and domestic hygiene are the main risk factors for an estimated 88% of all diarrhea cases everywhere [9]. Confirmed prevention measures that can significantly reduce the burden of diarrhea include early and exclusive breastfeeding (A child who, a non-breastfed is 10 times more probably to die from diarrhea in the first six months of life than an exclusively breastfed child [10], rotavirus and measles vaccination, and hand-washing with soap, the latter of which reduces the risk of diarrhea by an average of 48 percent [11]. Treatment measures include fluid replacement to prevent dehydration (use of oral rehydration salts (ORS) reduces diarrhea-specific mortality by 69 percent) [12] and zinc treatment [13]. Improved safe water supply and community-wide sanitation are also crucial general interventions.Saudi Arabia U5MREvidence-based practice (EBP) requires a comprehensive understanding of the causes of child mortality in order to track improvement toward child survival goals and for active planning of health strategies, policies and interventions for child health. Significant reductions have been observed in U5MR globally during the past 35 years, with every region in the world recording substantial progress in child survival [14]. Over the past two decades, health services in Saudi Arabia have made significant strides in the field of primary health care, which has been extended to cover all population centers, and significant progress has been observed in terms of the efficiency and integrations of health services. These services are provided through several programs, including family-health registers, maternal and child care, integrated child healthcare, control of communicable diseases and basic environmental health. The integrated child healthcare program is the most related program with Millennium Development Goal 4 (Reduce child mortality) and offers continuous follow-up of the development of children until the age of 5, through the ‘health record system’ covering the registration of all health visits and follow-up steps during the natal and post-natal stage. The program contains activities that include control of malnutrition, diarrhea and a comprehensive vaccination program against communicable diseases. The latter program has achieved outstanding success, with the proportion of babies vaccinated against measles, rubella and mumps during their first year of life increasing to 98.2% in 2010. Equally, the proportion of children vaccinated against diphtheria, whooping cough and tetanus, polio, and hepatitis B amounted to 98%, as well as 97.7% for tuberculosis. These positive developments have led to the decline of U5MR to 19.5 deaths per thousand live births in 2010, which amounts to an improvement of 55.7% over its 1990 level. Similarly, the infant mortality rate declined to 16.9 deaths per 63 thousand live births in 2010, an improvement of 50.3% over the 1990 level. These rates indicate that Saudi Arabia comfortably achieved the Millennium Development Goal 4 (MDG4) in 2015 [15,16].Concerning future directions to improving the efficiency of health services and recognizing full coverage, the administrative and organizational structures are being continuously developed in line with the national vision (Vision 2030) to improve health services as part of general socioeconomic development. Local institutions will enjoy more powers to execute their tasks more efficiently. Likewise, the government health facilities will be financially independent and subject to review and accountability according to proper performance measures. Concurrence between the MDG4 and the Ninth Plan objectives of the health sector, epitomized in providing comprehensive, integrated, high-quality health care services spread in all regions of Saudi Arabia to cover all of the society members, increases the chance to achieve this goal. The Ninth Plan has adopted a number of objectives relevant to MDG4 [17].The Global Burden of Disease (GBD) study (GBD 2015 Mortality and Causes of Death Collaborators, 2016) provides an assessment of global child morbidity and mortality, documenting child health achievements according to MDG4 and providing estimates of child mortality by age (neonatal, post-neonatal, 1-4 years, and U5), sex, and cause overtime. The GBD study reports child morbidity and mortality by age (neonatal, post-neonatal, 1-4 years, and U5), sex, and cause over time in the EMR from 1990 to 2015. This study provides the most comprehensive assessment so far of levels and trends of child morbidity and mortality in the EMR. Through a series of decomposition analyses, we identify which groups of causes contribute most to reductions in U5 mortality across regions and the development spectrum. Comparisons of recorded levels and cause composition for child mortality by country offer an in-depth, nuanced picture of where countries might need to refocus policies and resource allocation to accelerate improvements in child survival in the future. Figure 1 shows the rapid decline in U5MR in Saudi Arabia, particularly between 1980-2000, compiled from different data sources. This may be attributed to increasing awareness among the community of the need to visit specialized hospitals for diagnosis and treatment for U5s, where they will be registered via the continuous registration system. The seriousness of the former situation (i.e. prior to the 2000s) necessitated the investigation of the volume of future incidents which will occur if similar conditions prevail [18].
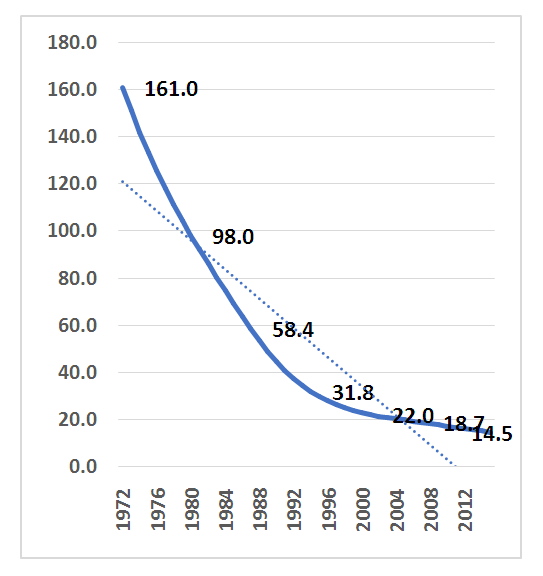 | Figure 1. U5MR in Saudi Arabia, 1972-2015 (UNICEF, WHO, World Bank, UN-DESA Population Division, 2015) |
2. Methodology and Factor Analysis
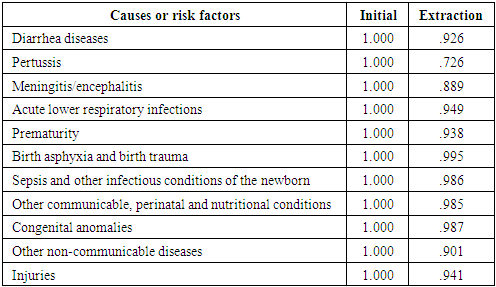
- A retrospective cohort study was conducted from 2000 to 2015 using data from the Saudi Ministry of Health Statistical Annual concerning U5 disease cases diagnosed in hospitals in the Tabuk Region.4) Data collectionThis is an analytical study to investigate and identify the causes and associated risk factors of U5 diseases causing U5MR. Secondary data of U5 diseases series were obtained from the Statistical Annual reports to investigate the cause and associated risk factors of U5MR in Tabuk and identify mortality trends in the Tabuk Region.We used the secondary data collected from reports for U5 disease to investigate the cause and associated risk factors of U5MR by factor analysis (FA) in SPSS (22), which is a useful and suitable analytical tool for this data. FA predicts and provides reduction factors relative to the main factor that causes U5MR in Tabuk Region among the diseases recorded in the Statistical Annual.5) Factor analysis description and featuresFA is a way to take a mass of data and reduce it to a smaller data set that is more practical and comprehensible. It is a way to find hidden patterns, show how those patterns overlap and show what characteristics are seen in multiple patterns. It is also used to create a set of variables for similar items in the set (these sets of variables are called dimensions). It can be a very useful tool for complex sets of data involving psychological studies, socioeconomic status and other involved concepts. A ‘factor’ is a set of observed variables that have similar response patterns; they are associated with a hidden variable (called a confounding variable) that is not directly measured. Factors are listed according to factor loadings, or how much variation in the data they can explain. There are two main types of FA: exploratory (EFA) and confirmatory (CFA).6) Factor analysis makes a ‘good’ solutionOne kind of ‘good’ solution is one that makes psychological sense in terms of some developed or developing theory. It is one that helps the researcher to understand the patterns in the data. It helps if each variable has a high loading (>0.3) on a single factor and low (or zero) loadings on all the others. This ideal is known as the simple structure, and there are several methods of rotating the initial solution so that a simple structure is obtained.7) Output of factor analysisIn SPSS, FA produces a series of output matrices that give different kinds of information. Depending on the method of extraction used, one may also get the results of some statistical tests on the correlation matrix derived from the data. [19]8) Correlation matrixA correlation matrix lists the correlations between each pair of variables in the analysis. Every value appears twice and gives the degree to which each variable is associated with every other variable.9) FactorA factor is a latent variable that analysis (using SPSS) has identified as describing a significant proportion of the variance in the data. A large number of variables may contribute to the effectiveness of a particular factor in describing this variance.10) Factor loadingsA factor loading is a degree to which every variable correlates with a factor. This is an important concept, as all the following terms are calculated from the table of factor loadings. If a factor loading is high (above 0.3) or very high (above 0.6), then the relevant variable helps to describe that factor quite well. Factor loadings below 0.3 may be ignored.11) CommunalitiesIn FA, there are several kinds of variance. Any given variable (e.g., questionnaire item responses) has some variance shared with other factors, called communality a value between 0 and 1 that is inserted in the diagonal of the correlation matrix, which SPSS derives from the data and on which the analysis is performed. As a property of a particular variable, a very low communality (e.g., 0.002) indicates that the variable has so little in common with the other variables in the dataset that its inclusion in the subsequent analysis is superfluous. The program starts with the estimates of communalities and then iterations are run for analysis, adjusting these values until the fit of the factors to the patterns in the data cannot be further improved. The sum of the communalities is the variance in the data distributed among the factors. This figure is always less than the total variance in the dataset, because the ‘unique’ and ‘error’ variance are omitted, so that a linear combination of the factors will not reproduce exactly the original scores on the observed variables (‘indicators’).12) EigenvaluesAn eigenvalue is equal to the sum of the squared factor loadings for a particular variable on the factor with which the eigenvalue is associated. In simple terms, the larger the eigenvalue, the larger the proportion of variance in the data accounted for by that factor. The plot of eigenvalues against the number of factors (scree plot) was proposed by Cattell (1966) as an aid in deciding on the optimum number of factors to extract. Deciding how many factors will best represent the patterns of correlations in the data is one of the main problems in EFA, because although SPSS has a default method for doing this, it is really up to the analyst to decide. By default, the program will only extract eigenvalues greater than 1, but this is not always optimum. If the scree plot shows a clear distinction between the first few factors and the rest (which pile up like the rubble at the bottom of a steep slope, hence ‘scree’ plot), then this is an indication that the first few are the ones that matter and the analysis can be re-run with only this number of factors requested. Sometimes there are good theoretical reasons to expect that the data can be adequately represented by a certain number of factors, and the analyst can specify this number to be extracted.13) Rotated factor matrixThe values in this matrix are for un-rotated factors. This matrix is also known as the ‘factor pattern’ matrix, consisting essentially of coefficients/weights for the regression of each variable on the factors. This is not the matrix usually used to interpret factors. Because all of the variables (indicators) have some degree of association with all the factors, there is an infinite number of ways that these associations could be represented. Therefore, no factor solution gives ‘the truth’ – a single definitive answer about how best to represent the patterns of relationships in the data. This is often referred to as the problem of ‘factor indeterminacy’. Rotating the factors is simply a way to distribute the factor loadings in such a way as to make the job of interpreting the ‘meaning’ of the factors easier. The aim is to ensure that each variable (indicator) loads highly on only one factor, thus ensuring a simple structure.14) Interpreting and naming factorsIn order to interpret the factors, one must see which collection of variables loads most highly on a factor, and then see what that set of items have in common. For example, if the items are questionnaire statements, one could see what it is that the statements are asking, what they all have in common, and interpret the factor accordingly. This helps decide what a factor represents. A positive loading (e.g., 0.52) indicates a positive relationship with the factor, whereas one with a negative sign will suggest an inverse relationship. As a ‘rule of thumb’ regardless of whether they are positive or negative, we consider loadings above 0.6 to be very high, above 0.3 to be high, and less than 0.3 to be irrelevant and thus ignored. Having decided what each factor might represent, we can then assign suitable names or labels to them.15) Orthogonal vs oblique rotationIn an orthogonal rotation (e.g., varimax) it is assumed that factors are not correlated with one another, therefore the axes (in the solution) are kept at 90 degrees to each other. However, for many concept domains in psychology, it is more likely that factors will be correlated with one another to some degree. For example, beliefs about equality may be correlated with beliefs about taxation. If the factors may be correlated, one can ask for an oblique rotation rather than an orthogonal one. Oblique solutions are a little harder to interpret because one must take into account the correlations between factors when looking at the factor loadings. However, for some datasets, the two types of rotation lead to similar results, in which case it is easier to report the results of the orthogonal rotation. The main thing to bear in mind is that in an orthogonal rotation one interprets the rotated factor matrix, whereas in an oblique rotation interpretation is usually based on the pattern matrix.16) ResidualsWhenever one simplifies the story told by the data, some information from the dataset is discarded. Since EFA aims to explain all possible correlations between variables in a simpler way, there will inevitably be some variance left over that is unexplained. The usefulness of a factor solution can be assessed by how well it manages to reproduce the original values in the data. Two more pieces of SPSS output give this information: the reproduced correlation matrix and a matrix of residuals (what is left after the factors have been extracted). A good fit is indicated when the residuals are small (e.g., less than 0.05).17) Number of factors Determining the number of factors to extract and rotate is not always easy. If too few are extracted, then the factors may be too general to be useful; if too many are extracted, then factors can become fissiparous. There are a number of measures of goodness-of-fit but the ultimate test of a good solution is whether:It captures a reasonable amount of variance (all factors together).It has a relatively simple structure (each item loading mainly on only one of the factors).It can be interpreted in the light of the theory that initially motivated the research.Data analysis.
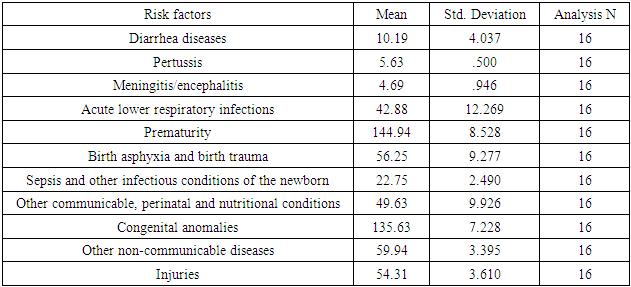
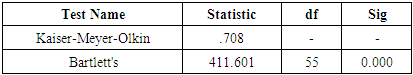
3. Descriptive Analysis
- The descriptive analysis of the sample data is presented in Table 1. Table 2 shows testing of the sample adequacy and the identity correlation of the matrix. Kaiser (1974) classified numerical values to accept values greater than 0.5 and reject those below 0.5 (which indicate the need for more data or variables to be included), with the following ranges for his test:• 0.5 to 0.7 = mediocre• 0.7 to 0.8 = good• 0.8 to 0.9 = great• Above 0.9 = super
|
|
|
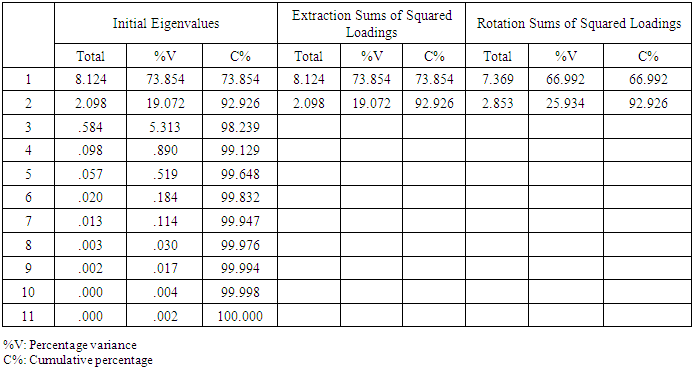
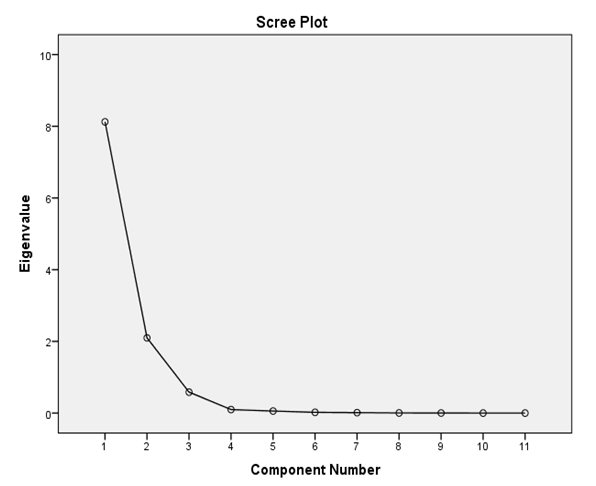 | Figure 2. Scree plot for factors |
|
|
4. Discussion
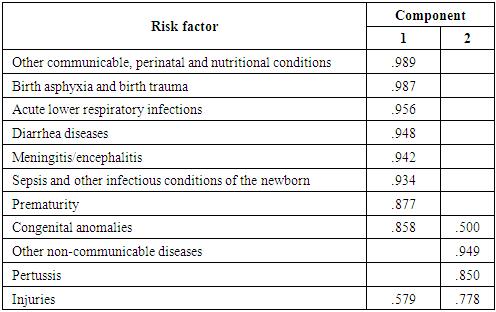
- The significant decline of U5MR show in Figure 1 is combatable with the global decline over recent decades (UNICEF, WHO, World Bank, UN-DESA Population Division, 2017), consistent with the prompt development and progress in several aspects in Saudi Arabia, including the expansion of and continuous progress in medical and health services. In the last three decades many hospitals, health centers and social welfare institutions have been established. This period has observed huge investment in health programs, improving sanitary and environmental health conditions, and raising standards of living. Since the 1970s Saudi Arabia has placed more emphasis on maternal and child care through specialized centers. In 1984 the primary health care (PHC) program was implemented, with one of its pillars being antenatal and postnatal care services. They also handle routine deliveries in rural settings. Recent years have seen a marked improvement in maternal care. 96% of deliveries are attended by doctors and trained nurses in Saudi Arabia (WHO, 2015) [20].This study investigated risk factors associated with U5MR in Tabuk Region, Saudi Arabia. It was found that the likelihood of U5MR was higher for child disease (factor 1) than accidents and injuries (factor 2). The first factor with the highest loading comprised: other communicable, perinatal and nutritional conditions; birth asphyxia and birth trauma, acute lower respiratory infections; and diarrhea diseases. The second factor included: other non-communicable diseases; and pertussis. This discrepancy, observed from national health statistical annuals in the Tabuk Region. The results of the present study suggest that the probability of mortality within the first five years of life is associated with specific disease causes or risk factors of U5MR. The association of U5MR with diseases considered particularly risky for mortality in the Tabuk Region include diarrhea diseases; pertussis; meningitis/encephalitis; acute lower respiratory infections; prematurity; birth asphyxia and birth trauma; sepsis and other infectious conditions of the newborn; congenital anomalies; injuries; other communicable, perinatal and nutritional conditions; and other non-communicable diseases. Understanding the causes of death among U5MR is significant because it relates to policy and programs. Patterns and trends in causes or risk factors of U5MR help decision-makers assess programmatic needs.
5. Conclusions
- This study concluded that the main causes are communicable diseases, perinatal and nutritional conditions (factor 1) and non-communicable diseases and child injuries (factor 2). This result corroborates global data indicating that about 70% of all child deaths are due to acute lower respiratory infections (mostly pneumonia, diarrhea and measles); neonatal conditions (mainly pre-term birth and birth asphyxia) and infections; and malnutrition, which is a factor in more than half of the children who die after the first month of life. [21]This study presents an understanding of the drivers of U5MR in the Tabuk Region of Saudi Arabia. There is evidence of greater risk of mortality associated with infectious disease, respiratory infections, malnutrition, neonatal condition and birth asphyxia. A successful child health program to reduce U5MR differentials should be based on knowledge of specific causes or risk factors of the different regions and settings, because of differences from one region or setting to another in terms of socio-economic factors, type of diseases, and traditions of feeding and so on. It is suggested that programs to improve child health care should ensure the expansion of primary health care facilities and better access to health services, based on community participation, with the education of mothers in the context of the cultural and religious characteristics of the population.