-
Paper Information
- Paper Submission
-
Journal Information
- About This Journal
- Editorial Board
- Current Issue
- Archive
- Author Guidelines
- Contact Us
International Journal of Statistics and Applications
p-ISSN: 2168-5193 e-ISSN: 2168-5215
2021; 11(2): 19-27
doi:10.5923/j.statistics.20211102.01
Received: Jun. 3, 2021; Accepted: Jun. 23, 2021; Published: Jul. 15, 2021

Uncertainty and Sensitivity Analysis of Thin-layer Drying Models Based on Seed Maize Drying Data
 Abstract
 Reference
 Full-Text PDF
 Full-text HTML
Augustine B. Makokha1, Isaiah E. Muchilwa1, Samwel C. Melly2
1Department of Mechanical Engineering, Moi University, Eldoret, Kenya
2Department of Processing & Engineering, Kenya Seed Company Ltd, Kitale, Kenya
Correspondence to: Augustine B. Makokha, Department of Mechanical Engineering, Moi University, Eldoret, Kenya.
| Email: |  |
Copyright © 2021 The Author(s). Published by Scientific & Academic Publishing.
This work is licensed under the Creative Commons Attribution International License (CC BY).
http://creativecommons.org/licenses/by/4.0/

Thin-layer drying models (TDMs) have been widely utilized as predictive tools to guide the design, scale-up and optimization of food drying processes. However, these models are empirically calibrated using experimental data. As such, the variability in the experimental data directly affects the uncertainty margins in the model predictions and subsequently impact on the model reliability. In this work, model prediction uncertainty for five selected TDMs namely; Page, Henderson & Pabis, Logarithmic, Verma et al and Diffusion, was evaluated and profiled, using variance based methods. Also, the sensitivity of model outputs to model input parameters was assessed using Sobol’ indices. The nominal values of the parameters were estimated by fitting the models to experimental data. An array of pseudo-random numbers was generated around the nominal value of the input parameter considered and within a defined domain range. Then for each model, the outputs corresponding to the array of values were computed. The moisture ratio displayed high sensitivity to both the drying rate coefficient ( ) and the drying time
  during the falling rate drying period. The Page model and Logarithmic model returned wider uncertainty margins, which is attributable to the model structure. The uncertainty importance of parameter K was relatively higher than parameter
  in all models albeit Verma et al. The findings are of significance for advancing the understanding of uncertainty intervals and limitations of thin-layer drying models in prediction of drying kinetics and for scale-up of drying processes.
Keywords: Uncertainty, Sensitivity analysis, Thin-layer models, Moisture
Cite this paper: Augustine B. Makokha, Isaiah E. Muchilwa, Samwel C. Melly, Uncertainty and Sensitivity Analysis of Thin-layer Drying Models Based on Seed Maize Drying Data, International Journal of Statistics and Applications, Vol. 11 No. 2, 2021, pp. 19-27. doi: 10.5923/j.statistics.20211102.01.
Article Outline
1. Introduction
- Food drying is an intricate operation that requires accurate process design and control in order to achieve optimum product quality in a cost efficient manner. As a result, it has attracted continued research. In fact, in value addition processes, the food quality is strongly characterized by the drying conditions. It is generally accepted that the time and energy expended to dehydrate material in a dryer to the desired moisture level is an indication of the process efficiency and varies intimately with the drying kinetics [1-3]. Hence, it is important that the kinetics of drying processes are adequately understood and characterized with the highest degree of certainty as a keystone to achieving optimal and efficient drying.Often, simulation models are deployed to generate critical information of the underlying drying kinetics and provide insights needed for design, scale-up and optimization of the complex drying processes such as the case of intermittent drying. The ultimate goal is to maximize the energy efficiency in drying and minimize the drying time, while preserving product quality. As there are many types of food dryers and the physical properties of the food products vary over a wide range, no single modelling approach can be regarded as ‘fit-for-all’. As such dryer designers consider model predictive behavior together with the sensitivity profile and uncertainty pattern in ascertaining the model adequacy. This serves to minimize on error propagation from model scale (laboratory scale) to full scale drying systems. Indeed uncertainty has always been inherent in laboratory experimental data due to noise, incompleteness and inconsistency.Thin-layer drying models (TDMs) find popular application in design and optimization of drying processes due to their simplicity and ease of use as opposed to classical complex distributed models [4-6]. But notwithstanding the merits of TDMs, the empiricism and idealization in the modelling process impacts the parameter sensitivity and prediction accuracy of these models. Further, the calibration studies of thin-layer drying models have mostly been accomplished using laboratory data and the results extrapolated to industrial scale through scale-up methodologies. The inherent uncertainties in the measured variables and their levels of sensitivity would inevitably influence the model adequacy and cause performance mismatch in the full scale drying system. In this regard, it is essential to take these uncertainties into account at the onset of drying process design or optimization. Thus, for successful industrial scale-applications, it is necessary to ensure that TDMs projections are reliable and accurate with well-defined uncertainty intervals. Indeed, majority of researchers concur that knowledge of uncertainty margins and sensitivity profiles of models is necessary to ascertain the model validity [7-9].Generally, sensitivity and uncertainty analyses are concomitantly implemented in model development process. The sensitivity analysis is performed to assess the variability in model output corresponding to uncertainties in the model structure and input parameters. [10,11] This helps to visualize the real model behavior when used in practice. The relative impact of measurement errors in model parameters and input data on model predictions can be established. This knowledge can assist in efforts to enhance the precision of model projections while also contributing to better understanding of the relationships between model assumptions, parameters, data and model predictions. Note that reliability of model predictions is the primary basis for decision making regarding model utilization. Therefore, sensitivity analysis serves as an essential guiding tool for determining model behavior when it is used for prediction or for decision support. Literature on uncertainty and sensitivity of TDMs is limited. Available studies [10,12] are largely addressed to static drying conditions with no considerations for the dynamic drying conditions that are characteristic of industrial drying processes. Under static drying conditions the moisture diffusivity is unchanged during drying, the drying product is homogeneous, the physical and thermodynamic properties are time independent and no temperature gradients occur within the product [13]. Strictly speaking, a complete drying profile comprises the first stage of drying (the equilibrium air temperature is greater than the temperature of the product), a constant-rate period, and a falling-rate period. In grain and crop drying, the dominant stage is the falling rate period, in which the drying conditions are dynamic [13]. It is worth mentioning that moisture diffusivity and activation energy are the principal kinetic parameters in thin-layer modelling [4,14,15]. In practice, these parameters vary dynamically along the drying profile and viciously influence the characteristic drying time and energy consumption in the falling rate period of drying. It is imperative that the sensitivity behavior and uncertainty ranges of thin layer drying models under dynamic kinetic conditions is established as a prerequisite for process design and scale-up application.The objective of this study is to evaluate the sensitivity of TDMs and quantify the uncertainty levels of these models in prediction of the moisture ratio under dynamic kinetic conditions, relevant to industrial drying processes. The primary model parameters considered in this work are the drying coefficient and the characteristic drying time. The latter corresponds to the falling rate period of drying. As a contribution of this work, the sensitivity analysis will provide improved understanding of the limitations and uncertainty intervals of thin-layer drying models in prediction of drying kinetics. This would help to keep the propagation of model prediction errors to within the acceptable level of accuracy for reliable model based simulation and scale-up of drying processes. The net outcome shall be improved product quality and energy efficient drying processes.
2. Theoretical Background and Context
2.1. Theory of Thin-layer Drying
- With reference to grain drying, a thin-layer can be considered as a single kernel freely suspended in the drying air or one layer of grain kernels [16,17]. Also it could be considered as a poly-layer of many grain thicknesses in which the temperature and the relative humidity of the drying air is in the same thermodynamic state at any time of drying. Premised on this definition, it can be deduced that the thickness of a thin layer may change with the velocity, temperature and relative humidity of the drying air and that the thermodynamic state of the drying air approaches the equilibrium state in heat and mass transfer with the grain dried in this layer [18]. Generally, industrial dryers are designed based on the theory of thin layer drying.
2.2. Thin-layer Modelling and Dynamic Drying Kinetics
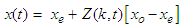
- TDMs are semi-theoretical in form, derived from the Fick’s second law of diffusion and Newton’s law of cooling by integrating theoretical and practical approaches [19,20]. Due to the usage of experimental data, they are easier and require fewer assumptions, but have limited validity tied to the process conditions applied. Equation 1 represents the general description of thin-layer drying [21]. The moisture content
 of the drying product varies in proportion to the equilibrium moisture (
 ). The equilibrium moisture is attained when the moisture flux between the wet product and the drying air is zero for a given thermodynamic state of the air (i.e. vapor pressures at the product surface and air are equal).
 | (1) |
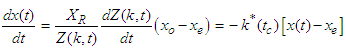
 in equation 1 is the drying coefficient (per unit time) which is influenced by material moisture content, temperature, and size, as well as air humidity and velocity. Equation 2 represents the moisture ratio
  in the thin layers of the drying product under static drying conditions [17].
 | (2) |
 is the moisture content at any time (kg water/kg dry matter),
  is the initial moisture content (kg water/kg dry matter),
  is the moisture ratio,
  is the number of terms (1, 2, 3, …) and
  is the drying time (seconds). The term Z(k,t) is an approximation correlation for the variation of moisture ratio as a function of time and drying coefficient. The drying coefficient
  is defined in terms of an effective diffusion coefficient, D and the geometric parameter, L of the drying product as
  The inherent relation between moisture diffusivity and activation energy is expressed in form of equation 3.
 | (3) |
 is the universal gas constant (kJ/mol.K),
  is the absolute air temperature and Do a factor in the Arrhenius equation (m2/s). Therefore,
  is defined by both the diffusivity and activation energy as follows:
 | (4) |
 | (5) |
 | (6) |
 | (7) |
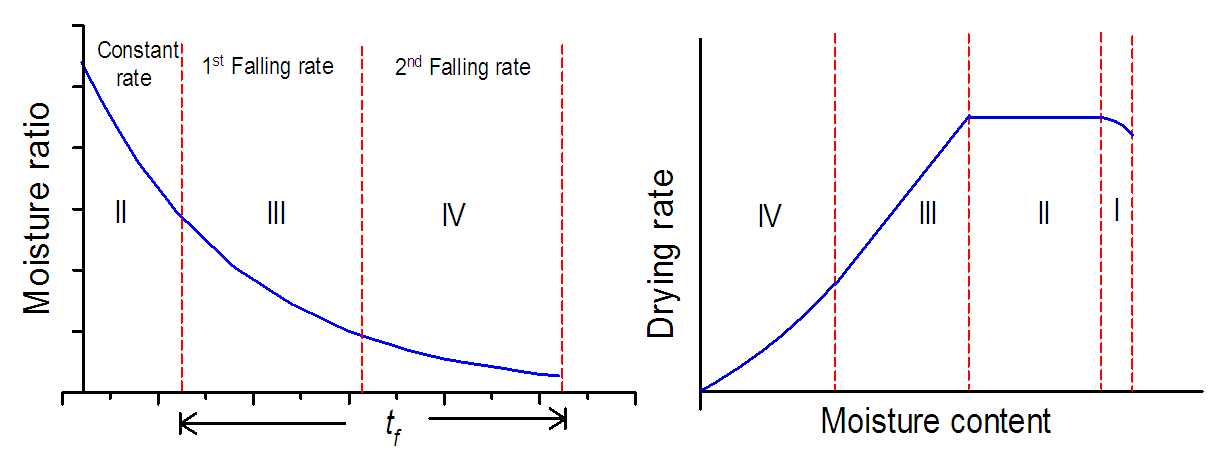 | Figure 1. Representation of a complete drying curve showing the constant rate and falling rate periods |
|
3. Materials and Methods
3.1. Experimental Data
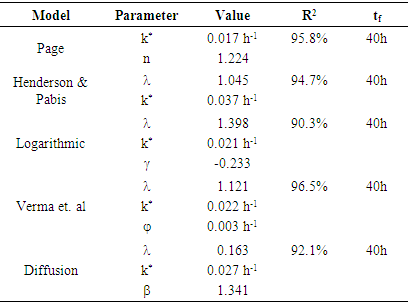
- The experimental equipment used for data collection is described in detail in the recent work by Makokha et al [28]. The equipment was manufactured by PETKUS Technologies, Germany. It is designed to operate in double pass reversing system for drying of seed maize with ability to handle input grain moisture of up to 30%. The plant has capacity of drying 600 tons of maize on cob over duration of 48 to 72 hours in 12 drying bins. The maize grain was dried at low temperature of 35 to 42 degrees. The moisture content of the grain was measured using Dolmar-MM400 Agromatic digital moisture meter with resolution of 0.1% and error tolerance of 0.05% of moisture content conforming to International Organization of Legal Metrology (OIML) margin of tolerances for Class 1 meters. The maize grain was dried from the moisture level of 19.1 to 13%. The data obtained of moisture ratio was fitted to five selected thin-layer models to estimate the drying coefficients and shape coefficients. The fit results are presented in Figure 2.
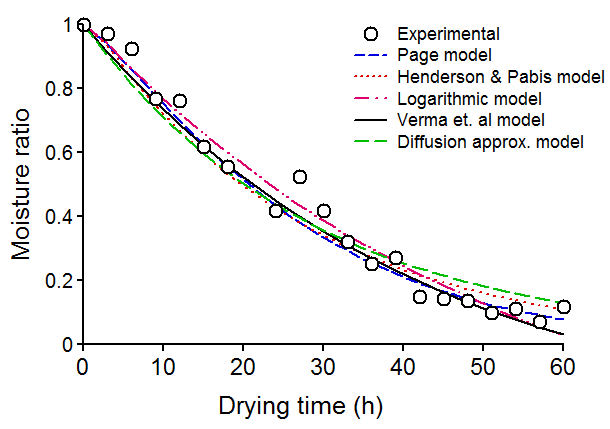 | Figure 2. The measured and model predictions of moisture ratio for maize grain at low temperature drying (35 – 42°C) |
|
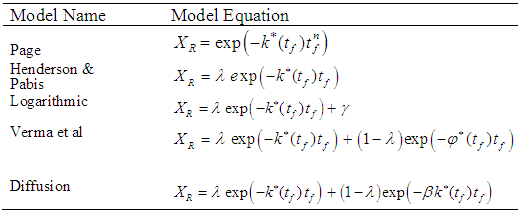
3.2. Sensitivity Analysis
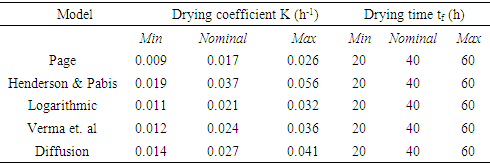
- Various methods of sensitivity analysis exist that are employed in various modelling situations. The simplified form of the Smirnov test statistics [29,30] based on relative mean deviation (RMD) and the Sobol’s method [31] were adopted in the current analysis to assess the sensitivity of the models. Sensitivity analysis was performed on five selected thin-layer models presented in Table 1 to assess the relative influence of the two input uncertainty parameters considered (i.e. -drying coefficient and the drying time). Since the region of interest for this study is the falling rate drying period, the drying time considered here corresponds to the falling rate period on the drying curve. The Monte Carlo technique was used to generate a set of random model outputs for each pseudo-random input parameter through repeated simulations. The values were uniformly distributed in the defined domain of ±50% of the nominal values as presented in Table 3. This provides an equal likelihood of occurrence for each combination of model parameter values. The reported ranges of drying coefficient (K) for different products at drying temperatures of 10 – 80°C, air velocity of 0 - 10m/s and relative humidity of 10 – 70% are as follows [4,32,33]; Cereals (0.005 – 0.3), Fruits (0.01 – 0.08), Vegetables (0.003 – 0.12) and Others (0.001 – 0.44).
|
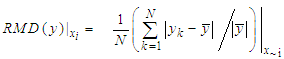 | (8) |
 value of RMD where N is the total number of data points/observations. The other approach employed in this study uses Sobol’ indices, which is a variance based technique for sensitivity analysis of a model output. Given a model of the form
  , the total-order Sobol’ index
  can be estimated using equation 9 [31]. The index
  represents the contribution of each input parameter
  on the response y considering interaction of
  with other model input parameters.
 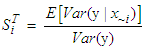 | (9) |
 is a vector containing all input parameters except
  while the expression
  computes the variance of y taken over all possible
  values. For non-purely additive models, the sum of the Sobol’ indices equals to unity,
3.3. Analysis of Uncertainty Propagation
- Quantification of uncertainty and uncertainty propagation, particularly the characterization of model output uncertainty due to input uncertainty is an important part of any modelling process. The quantification of uncertainty in thin layer model predictions is both a notable challenge and an important goal. Majority of the methods presented in literature for quantifying uncertainty are statistical due to stochastic nature of uncertainty and among them the polynomial chaos approximation and variance based techniques are commonly used. Uncertainty in model input values can result from the statistical error in analysis of data or experimental errors in measurements. Consequently, input may be treated as a random variable with a probability distribution. There is a large choice of probability distributions available for mapping the propagation of uncertainty of inputs to model outputs. The uniform distribution puts equal weight on each value in the uncertainty range. In most cases, however, the extreme values of the uncertainty ranges are less likely than the middle values. The well-known Gaussian and Normal distribution are often convenient since they require only the specification of a mean value and a standard deviation. Uncertainty quantification based on covariance analysis has been applied in our analysis [12]. This method is sensitive to the variability in input parameters and propagates this effect through the model to the response. Here, the model response is the moisture ratio.The uncertainty
 in the response y at the confidence interval of
  for
for  degrees of freedom is obtained as a product of the standard deviation of the input parameters and the t-test value as shown by equations 10 [12].
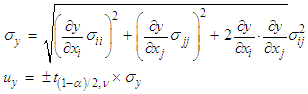 | (10) |
 and
and  are the input parameters. The terms
  and
and  represent the covariance,
  and
and  respectively.The uncertainty importance
  is used here as an index that characterizes the degree of reliability of model output. The uncertainty importance
  of the input parameter
  is defined as the expected reduction in the variance of the output y attributable to ascertaining the value of
  [7]. It is mathematically expressed as:
 | (11) |
 mean less sensitivity of the model response to variability pattern of input parameters, which implies reliable model predictions.
 4. Results and Discussion
- The results and discussion of sensitivity and uncertainty evaluation for five selected thin-layer drying models are presented in this section. In order to compare the sensitivity of individual model parameters and their level of contribution to the model uncertainty, the moisture ratios were computed for all randomly-generated values of model parameters in the defined range.Presented in Figures 3 (a-j) are surface and contour plots of model response data, demonstrating the trends in predicted moisture ratio with changes in the values of input parameters in a defined domain (Table 2), for each of the five thin-layer models (Table 1). Notice that the scatter plots have been superimposed onto contour plots to display the distribution of random values of the model input parameters
 as generated from Monte Carlo simulation.
 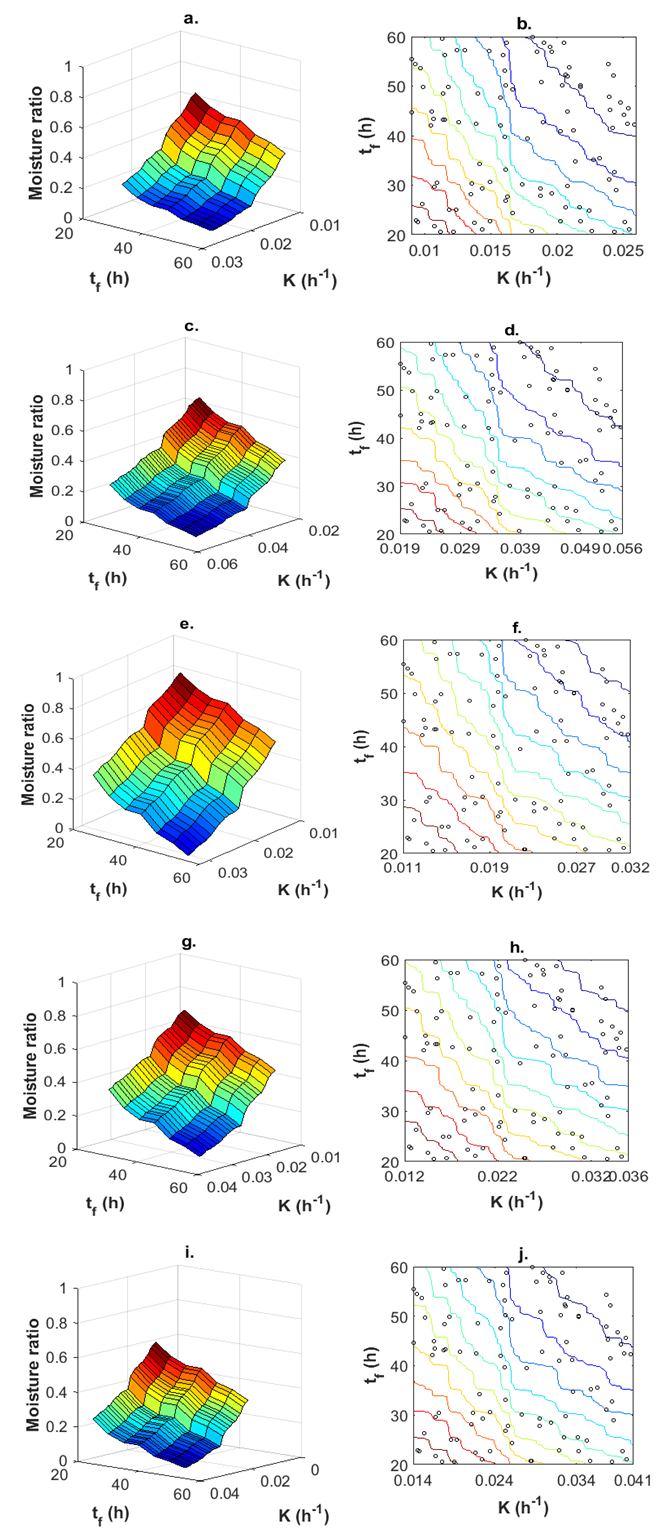 | Figure 3. Profile of predicted moisture ratio at varying levels of input parameters,  for five models tested: (a, b) Page model; (c, d) Henderson & Pabis model; (e, f) Logarithmic model; (g, h) Verma et al model; (i, j) Diffusion model for five models tested: (a, b) Page model; (c, d) Henderson & Pabis model; (e, f) Logarithmic model; (g, h) Verma et al model; (i, j) Diffusion model |
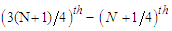
 to the variance of the moisture ratio. Values for Quartile 1 (Q1), Median, and Quartile 3 (Q3) are delineated. The line within the box marks the median while the whiskers above and below the box indicate the furthest points that are within 1.5 times the interquartile range from the end of the box.
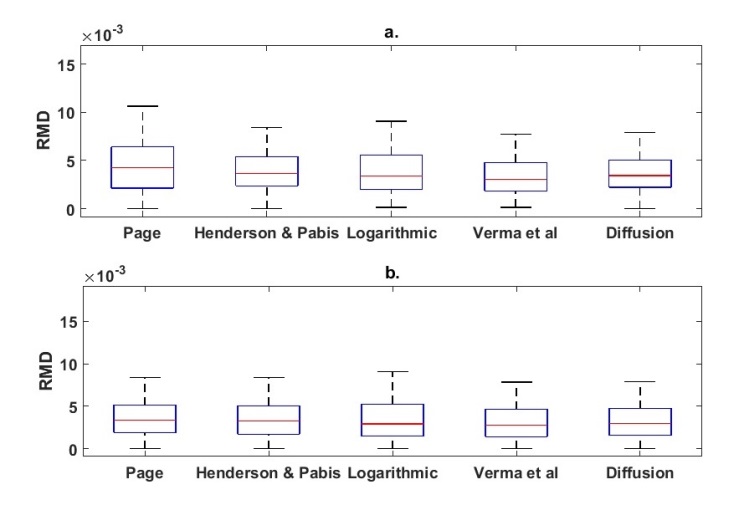 | Figure 4. Box plots of the relative mean deviation (RMD) in the model response data for the five thin-layer models for two scenarios (a) effect of parameter K and (b) effect of parameter  |
 . It is clearly evident that parameter K has a relatively stronger influence on uncertainty level of the Page model while parameter
  appears to exert more influence on the Logarithmic model. On the other hand, Henderson & Pabis model, Verma et al model and Diffusion model all exhibit nearly the same level of uncertainty in both cases, implying equal influence by the two parameters, K and
  . The possible explanation for higher level of variability exhibited by Page model relates to the structure of the model (see Table 1). The page model contains a power exponent (n), which in effect (for n>1) would allow errors to grow by a factor of n. The Logarithmic model has an extra additive parameter γ that also contributes to the total variance of the model response. On the premise of these observations, it can be deduced that the both Page and Logarithmic model could be less adequate in the scale-up applications where drying conditions are dynamic. In order to quantify the impact of individual model input parameters on the variance of the moisture ratio, a sensitivity analysis was carried out using Sobol’s total sensitivity index
  Figure 5 shows the results of the sensitivity analysis for the five models investigated. The advantage of using total sensitivity index lies in the ability to estimate the contribution of individual parameters including interaction effects. From the results presented, the respective contribution by the parameters
  to uncertainty in the predicted moisture ratio is evaluated as, 67 and 34% for Page model; 55 and 46% for Henderson & Pabis; 50 and 53% for Logarithmic, 50.5 and 51% for Verma et al, and 54 and 45% for Diffusion model.
 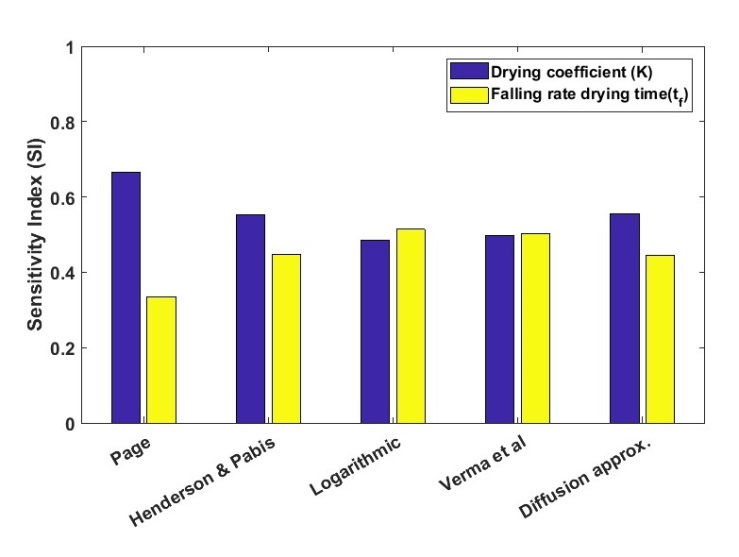 | Figure 5. Bar plots showing the relative sensitivity of the model parameters,  based on Sobol’s index based on Sobol’s index |
 for Page, Henderson & Pabis and Diffusion model. Further, the results show a marginally higher sensitivity of moisture ratio to the parameter
  than K for Logarithmic model, but display equal sensitivity of both parameters for Verma et al model. Notice that for Verma et al model, the drying constant has been partitioned into two i.e. K* and
  (see Table 1), corresponding to constant rate and falling rate drying periods respectively. From a quantitative point of view, it can be deduced that the moisture ratio is sensitive to both parameters,
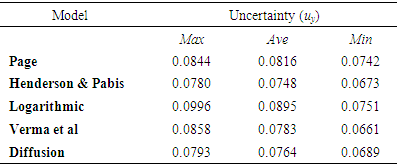
  Uncertainty assessment is important for enhancing the model results interpretation and usability. [8] Table 4 presents results of uncertainty observed in the predicted moisture ratio data characterized at 95% confidence interval and 9999 degrees of freedom (10000 data points -1). The maximum and minimum values are based on the student t-test values.Henderson & Pabis model displays the lowest average value of uncertainty. This has to be attributable to the model structure having fewer parameters and no additive empirical terms. Conversely, Logarithmic model has an empirical additive parameter that has to be estimated from experimental data. This would increase the uncertainty in the model predictions as evidenced in the results in Table 4. Page model is formulated with a power exponent. As a consequence of this, the uncertainty propagates more rapidly.
|
 . The respective values of uncertainty importance of the parameters
  to model predictions of moisture ratio are evaluated as, 0.14 and 0.10 for Page model; 0.12 and 0.11 for Henderson and Pabis; 0.17 and 0.15 for Logarithmic, 0.13 and 0.13 for Verma et al and 0.12 and 0.11 for Diffusion model. It is apparent that the uncertainty importance of parameter K is higher relative to
  in all cases except for Verma et al. Again, this is reminiscent of the pattern observed for sensitivity indices in Figure 4. The level of uncertainty importance for K relative to
  is the same for both Henderson & Pabis model and Diffusion model. The highest values of uncertainty importance of K and
  are associated with the Logarithmic model.
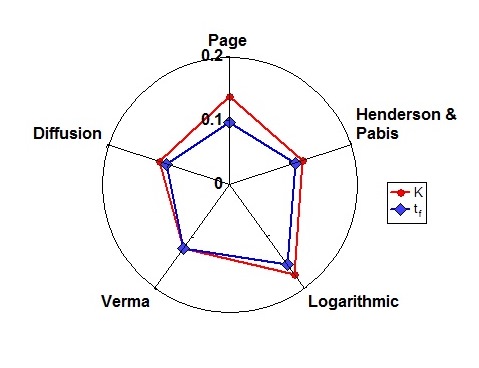 | Figure 6. Radar plot showing the relative uncertainty importance (Iu) of the model parameters  for the five thin-layer models tested for the five thin-layer models tested |
 would vary across the different thin-layer models. Therefore, the predictive applications of thin-layer models in dynamic drying processes should be performed judiciously guided by data of the sensitivity indices of model parameters and the magnitude of uncertainty that could be propagated from model parameters to the model output.
5. Conclusions
- The objective of this work was to analyze sensitivities of thin-layer models and comparatively evaluate the extent to which the model parameters influence the level of uncertainty in the predicted values of moisture ratio. Two fundamental parameters were evaluated for five selected thin-layer models. The investigation of parameter sensitivity and uncertainty propagation was accomplished through variance based statistical methods. In all the cases tested, the results revealed that moisture ratio is highly sensitive to both the drying rate coefficient (parameter
 ) and the falling rate drying time (parameter
  ), and that parameter K has a higher uncertainty importance than parameter
  , which is a salient facet of our results. The highest level of uncertainty was displayed by Page and Logarithmic models, which is attributable to the model structure. Further, it was observed that the moisture ratio has equal sensitivity to both parameters
  in the predictions by Verma et al model. Also, the uncertainty importance of
  was noted to be indifferent for Verma et al Model. The findings of this study have provided indicative insight on the reliability of thin-layer drying models under dynamic drying kinetics at low temperature drying of 35 to 42°C. This information is fundamental to accurate design and scale-up, effective monitoring and better control of dynamic drying processes.
 ACKNOWLEDGEMENTS
- The authors gratefully acknowledge Kenya Seed Company for availing their plant for experimental work.