Ayman Orabi1, Dalia Ziedan2
1Department of Management Information Systems Higher Institute for Specific Studies, Egypt
2Faculty of Graduate Studies for Statistical Research, Cairo University, Egypt
Correspondence to: Dalia Ziedan, Faculty of Graduate Studies for Statistical Research, Cairo University, Egypt.
| Email: |  |
Copyright © 2021 The Author(s). Published by Scientific & Academic Publishing.
This work is licensed under the Creative Commons Attribution International License (CC BY).
http://creativecommons.org/licenses/by/4.0/

Abstract
In this paper, the estimation of the parameters for the Marshal-Olkin extended linear exponential (MOLELE) distribution is discussed in the presence of outliers or extreme observations. Three methods are used to estimate the parameters, maximum likelihood, percentile, and M methods. A simulation study is conducted in the presence of outliers to examine the performance of the estimation methods. The results confirmed that, the M-estimation method is a suitable estimation method than the other methods when there are outliers in the data. Also, a real dataset application is carried out to confirm these results.
Keywords:
Marshall–Olkin Extended Linear Exponential, Maximum Likelihood Estimator, Percentile Estimator, M-estimator, Robust estimator, Outliers
Cite this paper: Ayman Orabi, Dalia Ziedan, Robust Estimators for Marshal-Olkin Extended Linear Exponential Distribution, International Journal of Statistics and Applications, Vol. 11 No. 1, 2021, pp. 12-18. doi: 10.5923/j.statistics.20211101.03.
1. Introduction
The linear exponential (LE) distribution is a two-parameter distribution was introduced by Kodlin (1967) as a possible model for response time. The linear exponential distribution has many applications. It has been used by many biometricians, statisticians, mathematicians, medical scientists and others, for example, Broadbent (1958) used it to describe the service of milk bottles that are filled in a dairy, circulated to customers, and returned empty to the dairy. Also, Carbone et al (1967) used it to study the survival pattern of patients with plasmacytic myeloma. In the literature, various methods have been used to generalize linear exponential distribution. Sarhan and Kundu (2009) introduced a generalization of the linear exponential distribution, named as the generalized linear failure rate distribution. Also, Mervoci and Elbatal (2015) introduced a four-parameter generalized version of the linear exponential distribution which is called Kumaraswamy linear exponential distribution. Marshall and Olkin (1997) introduced a new family of the distributions based on adding a new parameter  , this distribution called Marshall-Olkin extended distribution. Suppose that
  be the survival function of the baseline distribution. Then, the survival function of the Marshall-Olkin extended distribution can be defined as following
 | (1) |
Where  is an additional parameter and
  . Hence, the probability distribution (pdf) and the cumulative distribution for the new distribution are given by, respectively
 | (2) |
 | (3) |
Okasha and Kayid (2016) introduced a new family of Marshall-Olkin extended generalized linear exponential distribution, the unknown parameters are estimated by the maximum likelihood method. In the presence of outliers in the data, the traditional methods of estimation do not give good results. So, the robust method of estimation can be used to estimate the unknown parameters. Kantar and Yildirim (2015) considered various robust estimators for the extended Burr Type III distribution for complete data with outliers by using different methods of robust estimation. Mousa (2017) used M-estimation as a robust method to estimate the prameters of the Marshal-Olkin extended burr III distribution for complete data with outliers. Almongy and Almetwally (2020) discussed robust estimation for point estimation of the shape and scale parameters for generalized exponential (GE) distribution using a complete dataset in the presence of various percentages of outliers. The rest of this paper is organized as follows: Section (2) is concerned with describing the MOELE distribution. The maximum likelihood, Percentile and M estimators are given in Section (3). A simulation study is carried out in Section (4). Finally, a real data example is given in Section (5).
2. Marshall - Olkin Extended Linear Exponential Distribution
Let  be a random variable that have a linear exponential distribution with shape parameters
  and
and  . Then the probability density function is given by
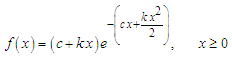 | (4) |
And, the cumulative density function is given by 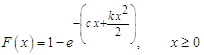 | (5) |
Substituting (4) and (5) in (2) and (3) we obtain a Marshall-Olkin Extended Linear Exponential distribution denoted by MOELE distribution with the following pdf and cdf, respectively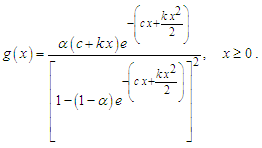 | (6) |
In particular for  the original distribution, i.e., the linear exponential distribution is recovered. Also, for
  the MOELE becomes the Rayleigh distribution. And, for
  , the MOELE becomes exponential distribution.MOELE distribution is more flexible than the linear exponential distribution, because of the presence of the shape parameter. Figure (1) shows the plots of pdf for MOELE distribution for some values of the parameters.
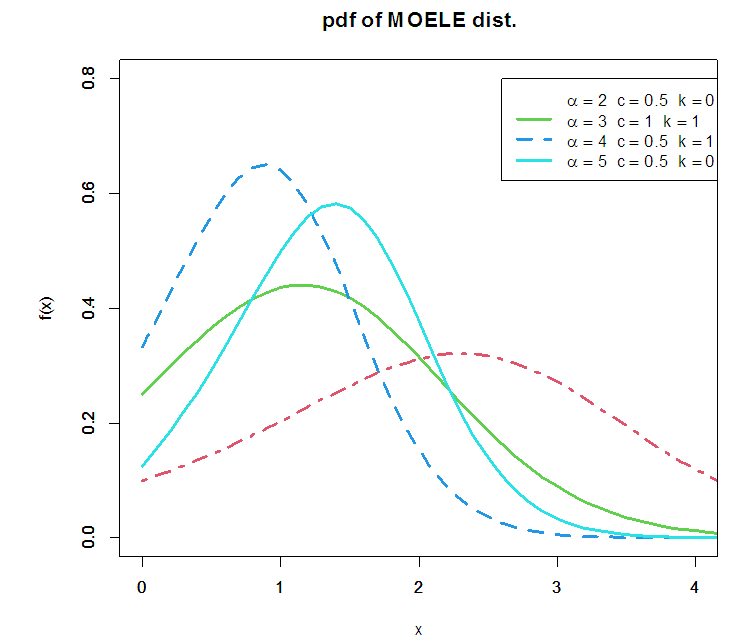 | Figure (1) |
3. Parameters Estimation
In this section, we consider three procedures to estimate the parameters of the MOELE distribution.
3.1. The Maximum Likelihood Estimation
Suppose that  is a random sample from
  , then the log-likelihood function,
  , is given by
 | (7) |
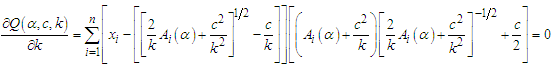
The normal equations become: | (8) |
 | (9) |
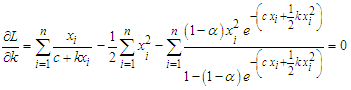 | (10) |
Since the above normal equations cannot be solved analytically, we will use some numerical methods to solve it.
3.2. Estimators Based on Percentiles
This method was originally explored by Kao (1958, 1959). In this case, the estimators are obtained by fitting a straight line to the theoretical points obtained from the distribution function and the sample percentile points. Now, we apply this approach on the MOELE distribution to obtain estimators based on percentile (PC). Since, the MOELE distribution has the form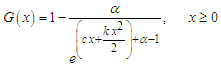 | (11) |
Now, let  be the
  order statistics,
 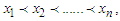 then the quantile function is
 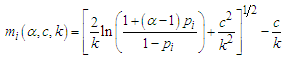 | (12) |
so,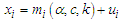 | (13) |
where,  denotes some estimate of
  and
and  is the error term, then the estimate of
  can be obtained by minimizing
 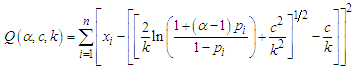 | (14) |
In fact, there are several estimators of  the unbiased estimator of them of
  is
is  , so we consider it. Hence,
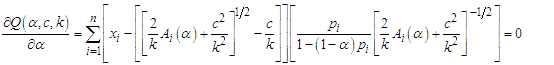 | (15) |
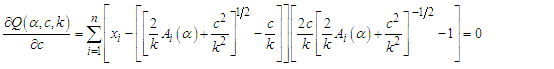 | (16) |
 | (17) |
where  The equations (15), (16) and (17) is a non-linear system. So, it is possible to use some numerical methods to estimate
  simultaneously. These estimators we call as percentile estimators
  .
.
3.3. Robust Estimation for the MOELE Distribution
Robust estimation is an estimation method that is used when there are some outliers that affect the model. Robust estimation is used to detect outliers and provide results that are resistant to the outliers. One of the robust estimation methods is M estimator. In the past three decades, there are considerable works in the literature devoted to developing statistical procedures that are resistant to outliers and stable (or robust) with respect to deviations from a given distributional model. In particular, methods for robust regression, estimation, and testing on regression models have received much attention. Among these, procedures based on M-estimators play an important and complementary role. In this paper we proposed a robust estimation method based on M-estimation method proposed by Huber (1964). The robust M-estimator method to estimate the parameters of the MOELE distribution is performed as following: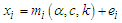 | (18) |
where  is the quantile function was given in equation (12), and
  is the error term after scaling as following
 | (19) |
Where,  is the error term was given in equation (9),
  and
and . [See Hampel et.al. (1986)]Now, minimize the objective function
  for all invariant errors with respect to the parameters
  . There many
  functions used in robust statistical analysis, we will use Tukey's Bisquare and Huber's weight [See Huber (1981)].Tukey's Bisquare objective function is
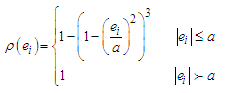 | (20) |
with derivative is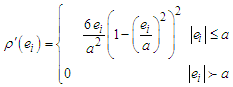 | (21) |
where  the tuning constant determines if an observation is an outlier or not.Huber's weight objective function is
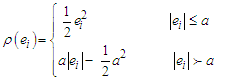 | (22) |
with derivative is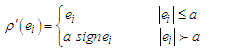 | (23) |
where  Since
Since  is differentiable, M estimates can be obtained for the two selected objective function by minimize
  with respect to
  , and equating to zero as following:
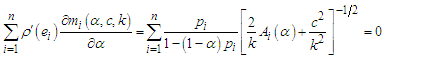 | (24) |
 | (25) |
 | (26) |
Since equations (24) - (26) are non-linear equations, so the numerical methods will apply to solve these equations.
4. Simulation Study
In this section, a simulation study is conducted in the presence of outliers to examine the performance of the estimation methods was given in section 3. The data were generated from the MOELE distribution by using inverse transform method, and the different values of  are used. The procedures are performed as:Step (1): We generate random samples
  of sizes
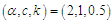
  from the MOELE distribution. We have taken parameter values
  .Step (2): For each random sample, the outliers are generated from the uniform distribution as
  , where
  is the sample mean and
  is the standard deviation of
  . For the small sample size
  one outlier is taken, for the moderate sample size
  two outliers are taken and for the largest sample size
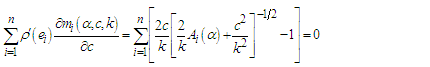
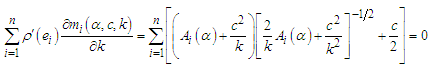
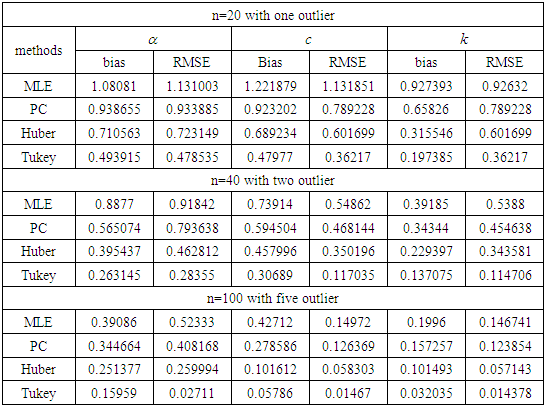
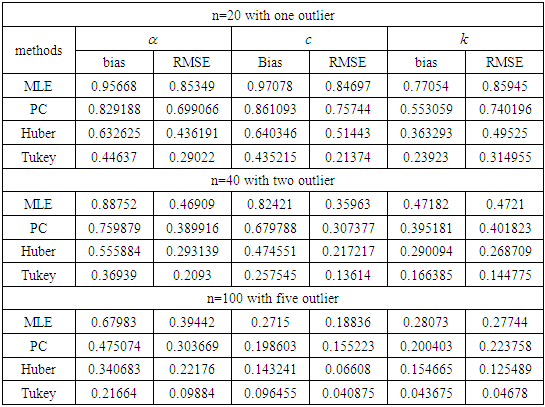
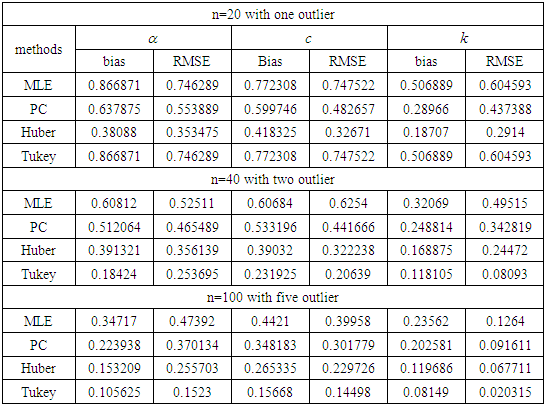
  five outliers are taken. [See Wei and Fung (1999)].Step (3): Solve equations (8) - (10) simultaneous to obtain the ML estimators, and solve equations (15) - (17) simultaneous to obtain the PC estimators. Also, solve equations (24) - (26) simultaneous to obtain the M estimators. Step (4): Calculate the bias and the mean square error (MSE) for the estimators obtained in step (3).Step (5): Steps from (1) to (4) will be repeated 100 times. The tables from 1 to 3 show the values of the bias and the RMSE for the ML, PC and robust (Tukey and Huber) estimators under different values of
  and different values of
  in the presence of outliers. It is obvious from the tabulated results that: (i) The robust estimator based on Tukey's Bisquare function has the smallest bias and the smallest RMSE in the most.(ii) The robust estimator based on Huber's weight function has bias and RMSE smaller than ML and PC estimators.
Table 1. The Bias and RMSE for
 and different sample sizes and different sample sizes
 |
| |
|
Table 2. The Bias and RMSE for
 and different sample sizes and different sample sizes
 |
| |
|
Table 3. The Bias and RMSE for
 and different sample sizes and different sample sizes
 |
| |
|
5. Real Data Example
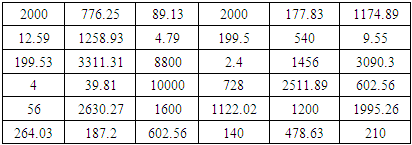
In this section, we apply on a real data set to verify how our estimators work in practice. The data given by shao (2000) is used. This data is used by Mousa (2017) to fit a Marshall –Olkin extended Burr III distribution. The data set is resulted from the study of influence of the proportion of toxicity of chromium in marine water. Table (4) contains 36 values for chromium marine water.Table 4. Chromium in marine water
 |
| |
|
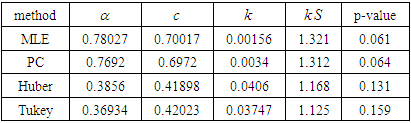
To estimate the parameters, the values of data set are divided by 365 for more fitting to MOLE distribution and Kolmogorov-Smirnov (KS) test is used. The estimation of the unknown parameters  and P-values are obtained in table (5).
Table 5. Estimation of parameters for real data set
 |
| |
|
From table (5), we note that(i) The Tukey estimator is the best estimator because the KS value is the smallest value and the P-value is the biggest value.(ii) the Huber estimator is better than the ML and PC estimators based on the values of KS an P-value.
6. Conclusions
In this paper, the estimation of the unknown parameters for the MOELE distribution is discussed in the presence of outliers. The traditional estimation methods such as ML and PC methods are used. Also, the M-estimation method is used based on the two objective functions, i. e. tukey's Bisquare and Huber. The simulation study and the real data are proved that, the M- estimation method is more efficient in estimating the unknown parameters of the MOELE distribution than the traditional methods when the data contains outliers or extreme observations.
References
| [1] | Almongy, H. M., and Almetwally, E. M. (2020). Robust estimation methods of generalized exponential distribution with outliers. Pak.j.stat.oper.res, 16(3), 545-559. |
| [2] | Broadbent, S., (1958). Simple mortality rates. Journal of Applied Statistics, 7, 86. |
| [3] | Carbone, P., Kellerthouse, L., and Gehan, E. (1967). Plasmacytic Myeloma: A study of the relationship of survival to various clinical manifestations and anomalous protein type in 112 patients. American Journal of Medicine, 42, 937-948. |
| [4] | Kodlin, D. (1967). A new response time distribution. Biometrics, 23, 227-239. |
| [5] | Hampel, F.R., Ronchetti, E.M., Rousseeuw, P.J., and Stahel, W.A. (1986). Robust statistics: The approach based on influence functions. Wiley, New York. |
| [6] | Huber, P. J. (1964). Robust estimation of a location parameter. The Annals of Mathematical Statistics, 35, 73-101. |
| [7] | Huber, P.J. (1981). Robust statistics. Wiley, New York. |
| [8] | Kantar, Y. M., and Yildirim, V. (2015). Robust estimation for parameters of the extended burr type III distribution. Communications in Statistics-Simulation and Computation, 44(7), 1901-1930. |
| [9] | Kao, J. H. K. (1958). Computer methods for estimating weibull parameters in reliability studies. Transaction of IRE-Reliability and Quality Control, 13, 15-22. |
| [10] | Kao, J. H. K. (1959). A graphical estimation of mixed weibull parameters in life testing electron tubes. Technometrics, 1, 389-407. |
| [11] | Marshall, A. W., and I. Olkin. (1997). A new method for adding a parameter to a family of distributions with application to the exponential and Weibull families. Biometrika. 84, 641–652. |
| [12] | Merovci, F., and Elbatal, I. (2015). A new generalization of linear exponential distribution. J. Stat. Appl. Pro. Lett, 2(1), 1-14. |
| [13] | Mousa, S. A. (2017). Robust estimators for marshall-olkin extended burr III distribution. International Journal of Research in Applied Natural and Social Sciences. 5, 69-79. |
| [14] | Okasha, H.M. and Kayid, M. (2016). . Journal of Computational and Applied Mathematics. 296, 576-592. |
| [15] | Sarhan, A., and Kundu, D. (2009). Generalized linear failure rate distribution. Commun. Statist. Theory Methods. 38 (5), 642-660. |
| [16] | Shao, Q. (2000). Estimation for hazardous Concentrations based on NOEC toxicity data: An Alternative Approach. Environmetrics. 11, 583–595. |
| [17] | Wei, W.H., and Fung W.K. (1999). The mean-shift outlier model in general weighted regression and its application. Computational Statistics & Data Analysis. 30, 429–441. |

 Abstract
 Reference
 Full-Text PDF
 Full-text HTML