Md. Shahidul Hoque, Muhammad Alamgir Islam
Department of Statistics, University of Chittagong, Chattogram, Bangladesh
Correspondence to: Md. Shahidul Hoque, Department of Statistics, University of Chittagong, Chattogram, Bangladesh.
| Email: |  |
Copyright © 2020 The Author(s). Published by Scientific & Academic Publishing.
This work is licensed under the Creative Commons Attribution International License (CC BY).
http://creativecommons.org/licenses/by/4.0/

Abstract
This study is exhibited to compare public universities and private universities in Chattogram division and also to explore quality of a university.This study emphasis on the context where education and the satisfaction of students are the foremost issue. The paper endeavors to develop insights into comparative estimations of both public and private universities from a student's perspective in areas of satisfaction and quality. It has been found that there is a significant difference between public and private university students regarding satisfaction on different factors. The quality of faculties in public universities is much better than that of private universities because the faculties in public universities get enormous opportunities to pursue higher degrees from abroad enjoying study leave from the own working place. Cost of the programme is notable factor in achieving in higher education. Cost of the programme in public universities is much less than that of private universities because the public universities are state funded. The scale of timely completion of the programme in private universities is highly satisfied compared to public universities. Residential facilities, canteen facilities, library facilities in public universities are much better than those of private universities. Information technology facilities in private universities are better than those of public universities.On the basis of the findings some recommendations have prescribed to uplift the overall situation.
Keywords:
Comparative study, Student’s satisfaction, Factor analysis, The KMO statistic, Bartlett’s test
Cite this paper: Md. Shahidul Hoque, Muhammad Alamgir Islam, A Comparative Study on Public and Private Universities in Chattogram Division- A Factor Analysis Approach, International Journal of Statistics and Applications, Vol. 10 No. 6, 2020, pp. 160-170. doi: 10.5923/j.statistics.20201006.03.
1. Introduction
The development of modern society depends to a large extent on the nature and standard of higher education. In the era of globalization, the growing value of knowledge can hardly be understated. Higher education grooms skilled people for assuming various tasks. Higher education has enormous possibilities in pressing forward prosperity in the developing countries [13]. Universities are the Higher Education Institutions (HEIs) in any country in the world and it bears a significant status in relation to the other institution. Higher educations in Bangladesh are graced with the increasing number of public universities and private universities. Both higher educational institutions aim at producing excellent quality and competitive products at a higher level to meet the domestic and global demand in the job market. By offering a favorable learning environment that covers various aspects of facilities, this can help the university to achieve that goal. Satisfaction is a well-researched topic in both academic and non-academic (workplace) settings. In academic settings, student’s satisfaction data help universities to be more responsive to the needs of a changing market place. Student’s satisfaction is an important element in determining the quality services offered by the HEIs. The emphasis on students’ satisfaction is very important to gain a good image and develop positive perceptions towards the services provided. Therefore, to ensure improvement in the quality of the given services, HEIs should take into account the needs of users as the key to succeed in the educational sector [3]. Student’s satisfaction is often analyzed based on the quality of education that they receive from education institutions. Quality or service quality is an essential criterion which assists students in determining the universities of their choice. Therefore, the extent to which the lecturers become professionally trained and qualified may bring changes for the long term growth of the further education sector [4].Public UniversitiesBangladesh has 53 public universities to the bulk of higher studies students. These universities are funded by the government while managed as self-governed organizations. There are thirteen public universities in Dhaka division, seven in Chattogram division, five in Khulna division, three in Rajshahi division. Each of Mymensingh Division, Rangpur division, Sylhet division & Barisal division has two. The University Grants Commission (UGC) of Bangladesh has introduced the cluster system for students’ enrollment. According to this system all public universities in Bangladesh should be sorted in five clusters i.e. one for agricultural universities; one for science and technology universities, one for engineering universities, one for medical universities and the last one for general studies universities.Private UniversitiesEstablishment of private universities in Bangladesh was initiated after the institutions of the Private University Act 1992. There are 80 such universities that are operational in five out of seven divisions of the country. The total number of approved private university is now 97 (as of April 2018).Most of the private universities are in Dhaka Division, totaling 51. All of them have their campuses in Dhaka city, concentrated mostly in the Gulshan, Dhanmondi, Panthapath and Uttara regions of the city. Two private universities in Dhaka specialize in science and technology, one specializes in women's studies, and the others are general universities. Six private universities are located in Chattogram Division. All six have their main campuses in Chattogram city. International Islamic University, Chittagong has its urban campus in Kumira, outside the main city. Five of them are general universities, while one specializes in science and technology. The only private university in Rajshahi Division has its campus in Bogra. In Sylhet Division there are four private universities, all having their main campuses in Sylhet city. There is no private university in Barisal Division and Rangpur Division [5].
2. Objective of the Study
The main objective of this study is to identify the different factors of public and private universities. The specific objectives of the study are as follows:1. To compare the mean score of the variables for the public and private universities.2. To identify the determining factors that provides significant satisfaction and dissatisfaction to the students of public and private universities.3. To suggest some policies and plans for the dissemination of better education among the citizenry by the public and private universities.
3. Literature Review
Higher education sector of Bangladesh has been intensively researched. This study reviewed the literatures focused on comparative study of public and private universities in Bangladesh. Among those, some relevant studies are reviewed and summarized as follows: Islam and Jahur (2007), studied on identifying the influential factors of private university education. They identified six factors, namely, course curricula, cost, exposure, human resource, competitive and image which are influencing factors for the students to be admitted into the private universities [9].A study by Fahmeda Yeasmin and et.al (2018), A Comparative Analysis between Public and Private University students regarding fear of English Language in Bangladesh. She attempt to bring the light on to identify the causes of fear in English Language at the university level of Bangladesh; to compare the causes of fear in English Language among the students of public and private university in Bangladesh; and to find out its effect.Bhuiyan and Hakim (1995), showed that the cost of higher education in public universities is lower (very insignificant) than the private universities. The study further shows that this cost is even cheaper compared to the cost of the same in other developed countries [10]. Quamrul H. Mazumder (2014), showed that the students in public universities of Bangladesh had lowest level of satisfaction and the private universities of Bangladesh had highest satisfaction [8].Husain and et.al (2012), revealed that both administrative and faculty characteristics jointly express quality of education to a higher extent, whereas institutional features and students' characteristics express quality of education to a moderate extent. The study also showed that perceptions toward quality of education depend on students' current status and socio-economic background [12].Lameck Ondieki Agasa and et.al (2018), used factor analysis and they found that three behaviour changes factors; pupils engaging in drugs, pupils being disobedient and pupils engaging in early marital sex explained 58.09% variance of the behaviour changes [11].Mohammad Nur Nobi (2012), revealed that confrontational student politics, session jam, limited enrollment opportunity and lack of modern class room facilities in public universities are responsible for increasing students’ enrollment in private universities [14]. There have been several studies related to comparative study on public and private universities in Bangladesh, but none of these studies have dealt with factor analysis. In this respect, the present study can have an important contribution in filling this research gap by using factor analysis. The present study mainly focused on the endeavors to develop insights into comparative estimations of both public and private universities from a student's perspective in areas of satisfaction and quality.
4. Data and Methodology
The area of different public and private universities in Chattogram division is covered by the survey. The primary data have been used for the purpose of the study. Due to the paucity of both time and money, the students studying in Chattogram division (private or public universities) are treated as the population of the study. In our survey, we have considered three public universities like Chittagong University (CU), Comilla University (CoU), Noakhali Science and Technology University (NSTU) and three private universities like International Islamic University, Chittagong (IIUC) and Premier University (PU), Port City International University (PCIU). We have collected data from the students of above mentioned public and private universities in Chattogram division for the year 2018. In this case we have followed direct approach and have been able to collect opinion on 17 variables on 5-point Likert type scale. We have collected information from a sample of 240 students through a structured questionnaire designed in the light of the objectives of the study. Collected data has been tabulated and analyzed by powerful multivariate technique of factor analysis-principal component Varimax Rotated Factor Analysis Method.Factor AnalysisFactor analysis is a method for reducing a large number of variables (Tests, Scales, Items, Persons etc.) to a small number of presumed underlying hypothetical entities called factor (Fruncher, 1967) [6]. It tries to simplify complex and diverse relationship that exists among a set of observed variables by uncovering common dimensions of factors that link together the seemingly unrelated variables and consequently provides insight into the underlying structure of the data (Dillion and Glodstein, 1984) [7].In order to define the group membership, an algorithm may be used to uncover a structure purely on the basis of the co-relational structure of the factors. One such popular algorithm of generating cluster in an explanatory factor analysis of the item-item correlation matrix using a principal axis factor analysis followed by a Varimax Rotation. Factor loadings those greater than 0.5 (ignoring the sign) have been considered as important one. In this study, this model of factor analysis (principal component Varimax Rotated Factor Analysis Method) has been used to group the variables. Finally ranking of the factors has been made on the basis of factor scores.The Kaiser-Meyer-Olkin (KMO) statisticThe KMO statistic varies between 0 and 1. A value of 0 indicates that the sum of partial correlations is largely relative to the sum of correlations, indicating diffusion in the pattern of the correlations (hence factor analysis is inappropriate). A value close to 1 indicates that the pattern of correlations is relatively compact and so factor analysis is distinct and reliable factors. Kaiser (1974) recommends accepting values greater than 0.5 as acceptable. Furthermore, values between 0.5 and 0.7 are mediocre, values between 0.7 and 0.8 are good, and values between 0.8 and 0.9 are very good and above 0.9 are excellent. Bartlett’s testBartlett’s measure tests the null hypothesis that the original correlation matrix is an identity matrix. For factor analysis to work we need some relationships between variables and if the R-matrix were an identity matrix then all correlation coefficient would be zero. Therefore, we want this test to be significant. A significant test tells us that the R-matrix is not an identity matrix; therefore, there are some relationships between the variables we hope to include in the analysis.
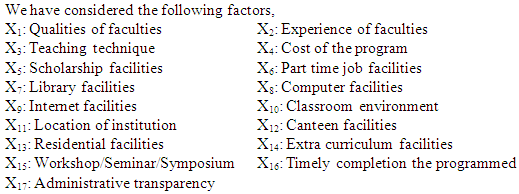
5. Different Factors in the Study
6. Results and Discussion
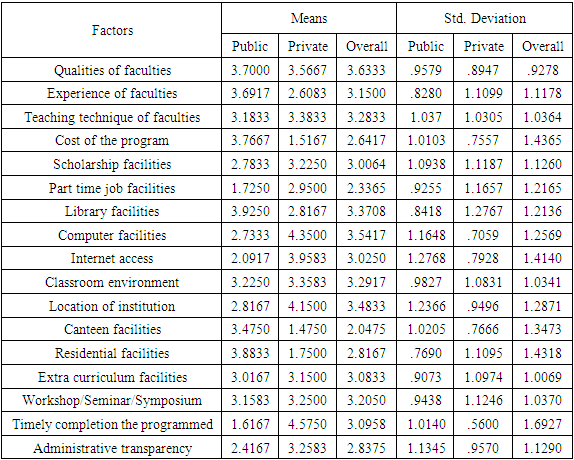
Table 1. Comparison of means and standard deviations for the public and private universities according to different factors
 |
| |
|
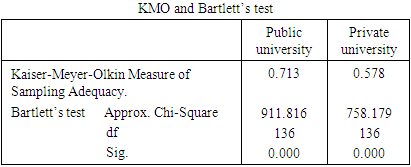
Factors that differentiate public universities from private universities:Experience of faculties: From the above table we have observed that the mean of the experience of faculties in public universities is greater than that of private universities. The main reason of this difference is that the faculties in public universities are stable and they do not change their job place. On the other hand the faculties of private universities change their job place to better area. Cost of the program: Cost of the program is remarkable factor in achieving in higher education. The above table shows that the mean of the Cost of the program in public universities is much less than that of private universities because the public universities are state founded.Library facilities: it is also observed that the mean of the library faculties in public universities is greater than that of private universities. The libraries in public universities are well oriented and huge number of books is available.Computer and internet facilities: Computer and internet facilities are more important factors in modern education system. The above table shows that the mean of both factors are higher in private universities than that of public universities because in most of the private universities have technical subject such as computer science and engineering, telecommunication etc. as a result there are rich computer library.Location of institution: Location of institution is an important factor of education facilities. From the above table we have seen that the mean of the location of private universities is much more than that of public universities. The main reason is that all the private universities are situated in city area.Residential and canteen facilities: Residential and canteen facilities are also notable factors in achieving education. The table indicates that the mean of the residential and canteen facilities in public universities are much more than that of private universities. The identified reason is that most of the private universities don’t have permanent campus. So there are few residential hall and canteen in private universities.Timely completion the programmed: Time is the most valuable factor in human life and timely completion of the graduation degree from universities is significant factor in attaining higher education. The analysis shows that the mean of timely completion of graduation degree in private universities is much more than that of public universities. Table 2. The Kaiser-Meyer-Olkin (KMO) and Bartlett’s test for public and private university
 |
| |
|
From the Table-1 we have seen that the value of KMO is greater than 0.5 and Bartlett’s test statistic is highly significant (p<0.001), so we are confident that factor analysis is appropriate for the data set.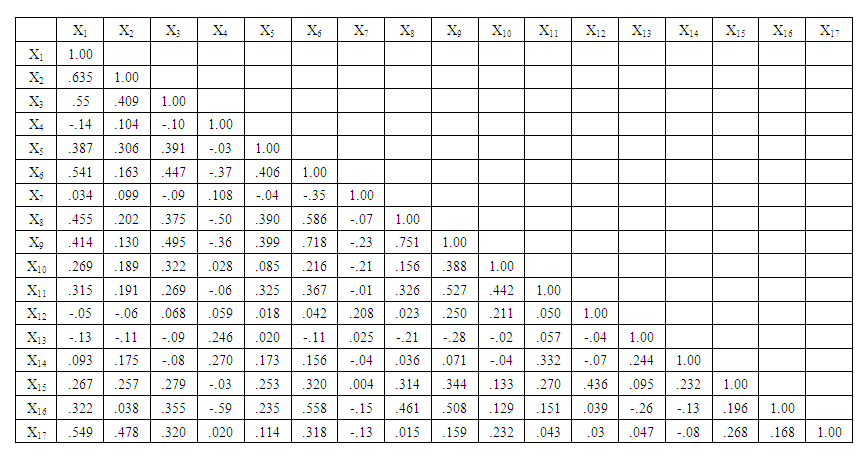 | Table 3. Correlation of public universities data |
Comment: The correlation matrix reveals that variable X1 (Qualities of faculties) is positively and significantly correlated with X2 (Experience of faculties), X3 (Teaching technique), X6 (Part time job facilities) and X17 (Administrative transparency) and their degrees of correlation are 0.635, 0.55, 0.541 and 0.549 respectively. Variable X6 (Part time job facilities) is found to have positive and very significant relationship with variables X8 (Computer facilities), X9 (Internet facilities) and X16 (Timely completion the programmed) and their magnitude of correlation are 0.586, 0.718 and 0.558 respectively.Variable X8 (Computer facilities) is found have significantly correlated with variable X9 (Internet facilities) in the magnitude of 0.751. Variable X9 (Internet facilities) is positively and significantly correlated with variables X11 (Location of institution) and X16 (Timely completion the programmed)and their magnitude of correlation are 0.527 and 0.508 respectively.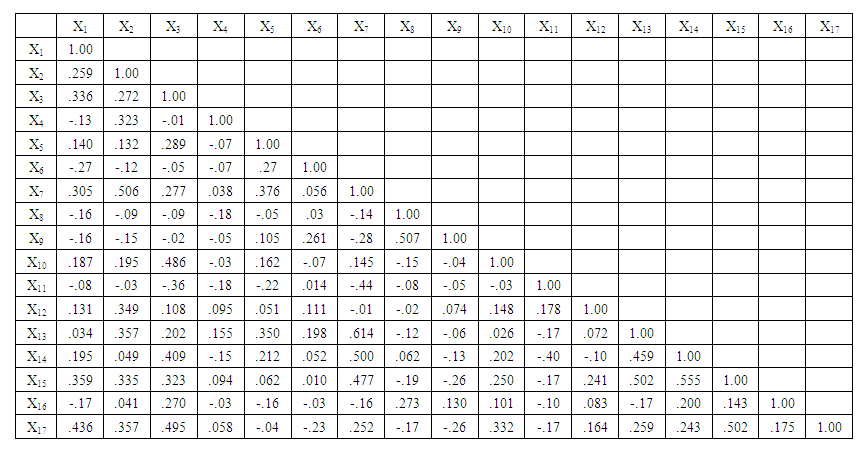 | Table 4. Correlation of private universities data |
Comment: The correlation matrix reveals that variable X2 (Experience of faculties) is positively and significantly correlated with variable X7 (Library facilities) and their degrees of correlation is 0.506. Variable X7 (Library facilities) is positively and significantly correlated with variables X13 (Residential facilities) and X14 (Extra curriculum facilities) and their degrees of correlation are 0.614 and 0.500 respectively.Variables X8 (Computer facilities) and X9 (Internet facilities) are positively and significantly correlated and their magnitude of correlation is 0.507. Variables X13 (Residential facilities) and X15 (Workshop/Seminar/Symposium) is positively and significantly correlated and their correlation coefficient is 0.502. Variables X14 (Extra curriculum facilities) and X15 (Workshop/Seminar/Symposium) is positively and significantly correlated and their correlation coefficient is 0.555. Variables X15 (Workshop/Seminar/Symposium) and X17 (Administrative transparency) is positively and significantly correlated and their degrees of correlation is 0.502.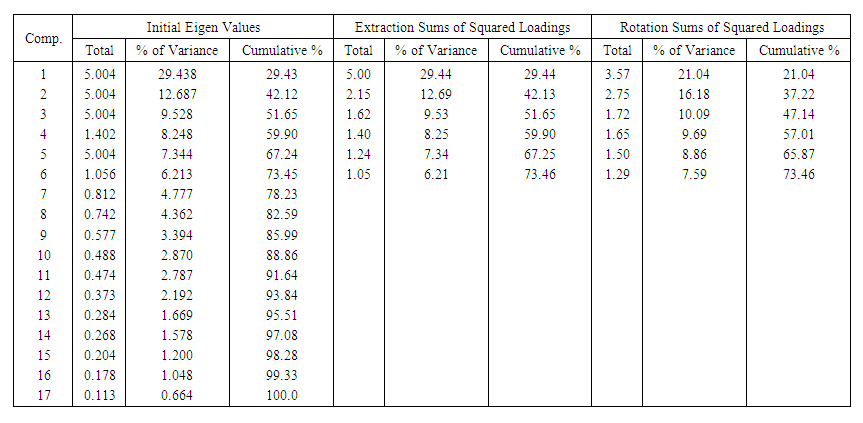 | Table 5. Total Variance Explained in public university |
The eigen values associated with each factor represent the variance explained by the particular linear component and SPSS also displays the eigen values in terms of the percentage of variance explained (so factor 1 explains 29.44% of the total variance). It should be clear that the first few factors explain relatively large amounts of variance (especially factor 1) whereas subsequent factors explain only small amount of variance. SPSS then extracts all factors with eigen values greater than 1, which leaves us with six factors. The eigen values associated with these factors are again displayed percentage of variance in the columns labeled Extraction Sums of Squared Loadings. The values in this part of the table are the same as the values before extraction, except that the values for the discarded factors are ignored. In the final part of the table (labeled Rotation Sums of Squared Loadings), the eigen values of the factors after rotation are displayed. Rotation has been effect of optimizing the factor structure and one consequence for these data is that relative more importance of the six factors is equalized. Before rotation. Factor 1 accounted for considerably more variance than the remaining five (29.44% compared to 12.69, 9.53, 8.25, 7.34 and 6.21), however after extraction it accounts for 21.04% of variance (compared to 16.18, 10.09, 9.69, 8.86 & 7.59) respectively.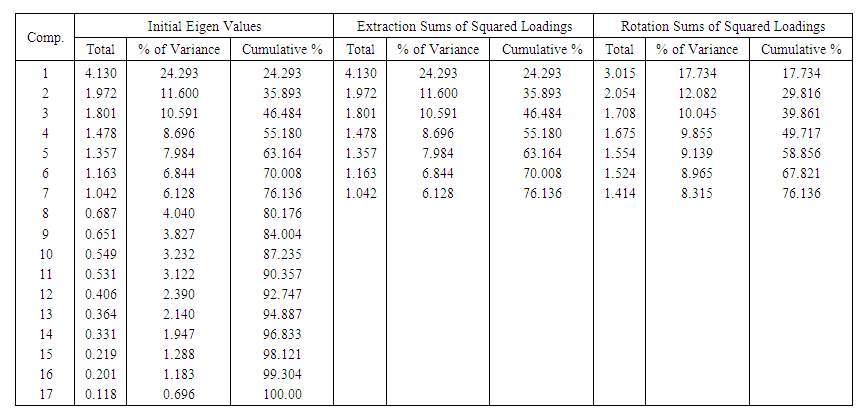 | Table 6. Total Variance Explained in private university |
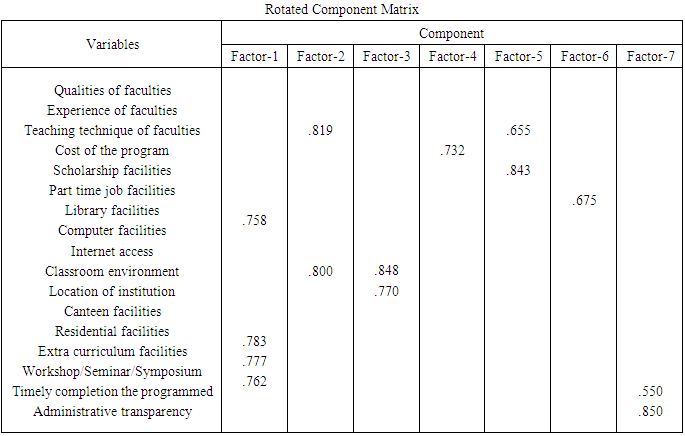
The Eigen values associated with each factor represent the variance explained by the particular linear component and SPSS also displays the eigen values in terms of the percentage of variance explained (so factor 1 explains 24.293% of the total variance). It should be clear that the first few factors explain relatively large amounts of variance (especially factor 1) whereas subsequent factors explain only small amount of variance. SPSS then extracts all factors with eigen values greater than 1, which leaves us with seven factors. The eigen values associated with these factors are again displayed percentage of variance in the columns labeled Extraction Sums of Squared Loadings. The values in this part of the table are the same as the values before extraction, except that the values for the discarded factors are ignored. In the final part of the table (labeled Rotation Sums of Squared Loadings), the eigen values of the factors after rotation are displayed. Rotation has the effect of optimizing the factor structure and one consequence for these data is that relative more importance of the seven factors is equalized. Before rotation Factor 1 accounted for considerably more variance than the remaining six (24.293% compared to 11.60, 10.591, 8.696, 7.984, 6.844 and 6.128), however after extraction it accounts for 17.734% of variance (compared to 12.08, 10.045, 9.855, 9.139, 8.965 & 8.315) respectively.Rotated Component Matrix:The rotated component matrix (also called rotated factor matrix in factor analysis) which is a matrix of the factor loadings for each variable onto each other. This matrix contains the same information as the component matrix except that it is calculated after rotation. There are several things to consider about the format of this matrix. Factor loadings less than 0.5 have not been displayed because we asked for these loadings to be suppressed. For this matrix I have allowed the variable levels to be printed to aid interpretation.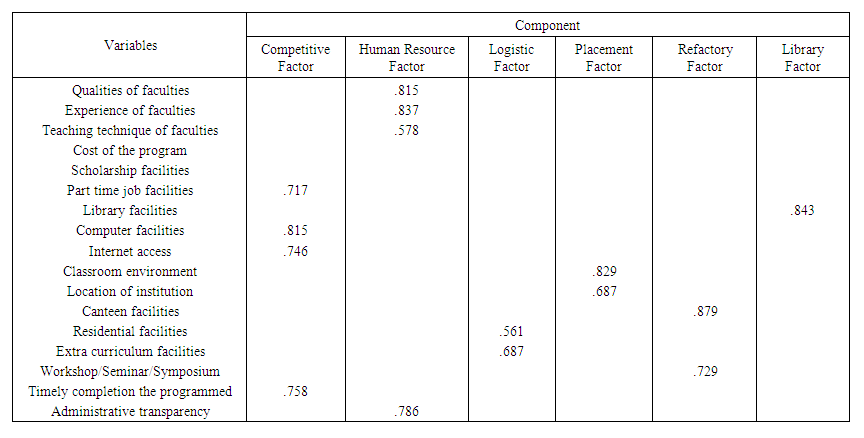 | Table 7. Rotated Component Matrix for public university |
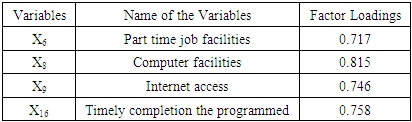
Factor-1 explains 81.1% of total variations existing in the variable, set for students of the sample public universities.Factor 1. Competitive Factor
 |
| |
|
Factor-1 has quite higher loading on variables X6, X8, X9 and X16, which have formed this cluster. The factor appears to be a major cluster. The factors – part time job, Computer facilities, Internet access and Timely completion the programmed dominated this factor. It is also found that all the variables in this factor are positively correlated and expected to move in the same direction. The reason for clubbing these variables may be explained in this way that these variables are contributing to building of competitive edge of public university.Scale-Reliability: Cronbach alpha coefficient is an indicator of internal consistency of the scale. A high value of the Cronbach alpha coefficient suggest that the items make up the scale “hang together” and measure the same underlying construct. A value of Cronbach alpha above 0.70 can be used as a reasonable test of scale reliability.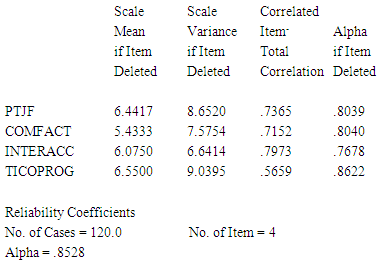 Since the overall value of alpha is 0.8528, so our test is reasonable test of scale of reliability.
 Factor 2. Human Resource Factor
 |
| |
|
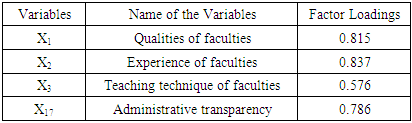
Factor-2 has quite a higher loading on variables X1, X2, X3 and X17, which have formed this cluster. The factor appears to be a major cluster. The factors-Qualities of faculties, Experience of faculties, teaching technique of faculties and Administrative transparency dominated this factor. It is also found that all the variables in this factor are positively correlated and expected to move in the same direction. The reason for clubbing these variables may be explained in this way that these variables are contributing to building of competitive edge of public university.Scale-Reliability: Cronbach alpha coefficient is an indicator of internal consistency of the scale. A high value of the Cronbach alpha coefficient suggest that the items make up the scale “hang together” and measure the same underlying construct. A value of Cronbach alpha above .70 can be used as a reasonable test of scale reliability.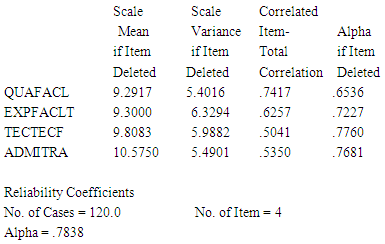 Since the overall value of alpha is 0.7838, which is greater than 0.70, so our test is reasonable test of scale of reliability.
 Factor 3. Logistic Factor
 |
| |
|
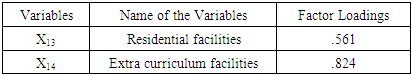
Factor-3 has quite a higher loading on variables X13 and X14, which have formed this cluster. The factor appears to be a major cluster. The factors-Residential facilities and Extra curriculum facilitiesdominated this factor. It is also found that all the variables in this factor are positively correlated and expected to move in the same direction. The reason for clubbing these variables may be explained in this way that these variables are contributing to building of competitive edge of public university.It is observed that the factor loadings for the variables residential facilities and extra curriculum facilities are respective loadings 0.567 and 0.824. So it can be concluded that these two variables are associated with the factor-3.Factor 4. Placement Factor
 |
| |
|
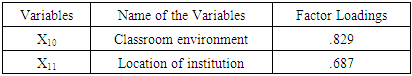
It is observed that the factor loadings for the variables classroom environment and location of institution are respective loadings 0.829 and 0.687. So it can be concluded that these two variables are associated with the factor-4.Factor 5. Refactory Factor
 |
| |
|
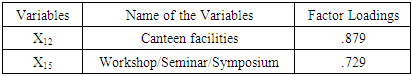
It is observed that the factor loadings for the variables canteen facilities and Workshop/Seminar/Symposium are respective loadings 0.879 and 0.729. So it can be concluded that these two variables are associated with the factor-5.Factor 6. Library Factor
 |
| |
|
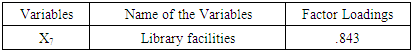
It is observed that the factor loading for the variable library facilities is 0.843.Ranking of the Decision Factors:The ranking obtained on the basis of the factor-wise average score are shown in the following table: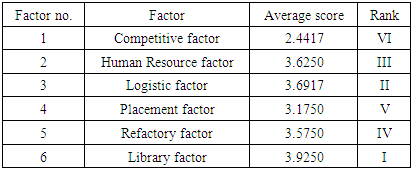 Comment: The ranking shows that library facilities (X7) are the most important factor in public university of Bangladesh. Logistic factor is found to be the second most important factor which indicates that sample students consider residential facilities (X13) and extra curriculum facilities (X14) as a deterministic criterion in choosing public universities. The third most important factor is human resource factor this reflects qualities of faculties (X1), experience of faculties (X2), teaching technique of faculties (X3) and administrative transparency (X17) that influence the students to select the public universities.
Table 8. Rotated Component Matrix for private universities
 |
| |
|
Factor 1. Opportunity factor
 |
| |
|
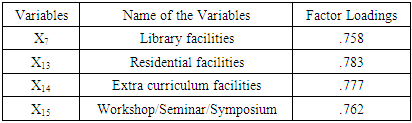
Factor-1 has quite a higher loading on variables X7, X13, X14 and X15, which have formed this cluster. The factor appears to be a major cluster. The factors-Library facilities, Residential facilities, Extra curriculum facilities and Workshop/Seminar/Symposium dominated this factor. It is also found that all the variables in this factor are positively correlated and expected to move in the same direction. The reason for clubbing these variables may be explained in this way that these variables are contributing to building of competitive edge of private university.Scale-Reliability: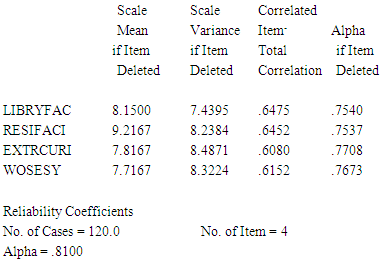 Since the overall value of alpha is 0.8100, which is greater than 0.70, so our test is reasonable test of scale of reliability.
 Factor 2. Teaching environment
 |
| |
|
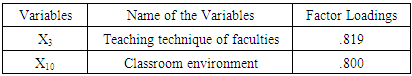
It is observed that the factor loadings for the variables classroom environment and Teaching technique of faculties are respective loadings 0.800 and 0.819. So it can be concluded that these two variables are associated with the factor-2.Factor 3. Technological factor
 |
| |
|
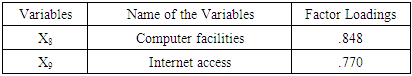
It is observed that the factor loadings for the variables Computer facilities & Internet access are respective loadings 0.848 and 0.770. So it can be concluded that these two variables are associated with the factor-3.Factor 4. Qualities of faculties
 |
| |
|
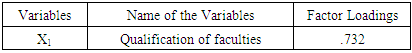
It is observed that the factor loadings for the variable qualification of faculties are 0.732. So it can be concluded that this variable is associated with the factor-4.Factor 5. Skill & fee factor
 |
| |
|
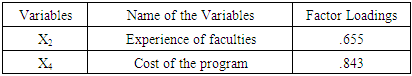
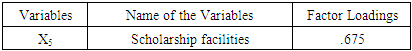
It is observed that the factor loadings for the variables experience of faculties and cost of the program are respective loadings 0.655 and 0.843. So it can be concluded that these two variables are associated with the factor-5.Factor 6. Scholarship facilities
 |
| |
|
It is observed that the factor loading for the variable Scholarship facilities is 0.675. So it can be concluded that this variable is associated with the factor-6.Factor 7. Infrastructural factor
 |
| |
|
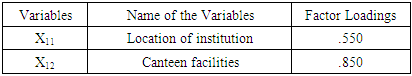
It is observed that the factor loadings for the variables location of institution and canteen facilities are respective loadings 0.550 and 0.850. So it can be concluded that these two variables are associated with the factor-7.Ranking of the Decision Factors:The ranking obtained on the basis of the factor-wise average score are shown in the following table: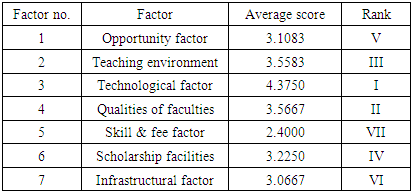 Comment: The ranking shows that Technological facilities that reflects computer facilities (X8) and internet access (X9) are the most important factor in private universities in Bangladesh. Quality factor is found to be the second most important factor which indicates that sample student’s consider qualification of faculties (X1) as a deterministic criterion in choosing private universities. The third most important factor is teaching environment this reflects teaching technique (X3) and classroom environment (X10) that influence the students to select the private universities.
7. Conclusions
The purpose of this study is to explain the factors that differentiate the education in public and private universities. From the analysis, we have seen that the means of the experience of faculties in public and private universities are 3.6917 & 2.6083 respectively which indicate that experience of faculties in public universities is much better than those of private universities. The main reason of this difference is that the faculties in public universities are stable and they do not change their job place. On the other hand the faculties of private universities change their job place to better area. The timely completion of the program in private universities is more satisfactory than that of public universities. The cost of the program in public universities is more satisfactory than that of private universities, because public universities are state founded but private universities are based on profit motive. Library facilities, canteen facilities and residential facilities in public universities are better than those of private universities because public universities get huge subsidy from government. Public universities have permanent campus but private universities don’t have permanent campus. Internet and computer facilities in private universities are much better than that of public universities. Because most of the private universities offer program in technical subjects such as computer science and engineering, telecommunication etc. and as a result the computer laboratories in those universities are found to be very rich. Finally, we can conclude that the several facilities such as qualities of faculty, library facilities, cost of the program and canteen facilities in public universities are much better than those of private universities. On the other hand, computer facilities, internet access, location of faculties and timely completion of the program in private universities are much better than those of public universities.
8. Recommendations
To improve this present scenario, several measures can be taken as probable solutions. Based on the findings and related literature of the study the following recommendations should be considered.• Information technology facilities should be increased in public universities.• Programme should be completed timely for reducing session jam in public universities.• Classroom environment in public universities should be congenial for the students.• It is essential to recruit experienced teachers in private universities.• Tuition fee is very high in private universities so tuition fees for the programme should be brought to means of the common people.• It is necessary to take proper action to increase residential, canteen and library facilities in private universities.
References
| [1] | Bhuiyan M.N. (1995), Comparative cost of Higher Education in some selected countries: An analysis ‘’Dhaka University Journal of Business Studies, vol. 16(1). |
| [2] | Fahmeda Yeasmin and et.al (2018), “A Comparative Analysis between Public and Private University Students Regarding Fear of English Language in Bangladesh”. International Journal of Humanities Social Sciences and Education (IJHSSE), vol 5, no.12, pp. 21-27. |
| [3] | W. N. Mahmood and et.al (2014), Investigating Students’ Satisfaction Level on Implicit Services of Malaysian Public Higher Education Institutions, Grading Business and Management Journal Volume 18, Number 1, 41-59. |
| [4] | JuraifaJais and et.al, Determinants of Effective Teaching: A Focus-Group Study, College of Business and Accounting (COBA), UNITEN, Sultan Haji Ahmad Shah Campus, Muadzam Shah 26700. |
| [5] | https://en.wikipedia.org/wiki/List of universities in Bangladesh. |
| [6] | Fruchter (1967), Introduction to factor, London: Von Netherlands. |
| [7] | Dillion, W.R and et.al (1984), Multivariate Analysis: Methods and Application, London; Wiley & Sons. |
| [8] | Quamrul H. Mazumder (2014), Analysis of Quality in Public and Private Universities in Bangladesh and USA, International Journal of Evaluation and Research in Education (IJERE) Vol.3, No.2, June 2014, pp. 99~108. |
| [9] | Islam, M.A. and Jahur, M.S. (2007). Factors Influencing the Students in Selecting Private Universities in Bangladesh: An Explorative Study. Journal of Business Studies, Vol. 11, Islamic University. |
| [10] | Bhuiyan, M.N.U. and Hakim, M.A. (1995), Comparative Cost of Higher Education in Some Selected Countries: An Analysis, Dhaka University Journal of Business Studies, 16 (1). |
| [11] | Lameck Ondieki Agasa and et.al (2018), Factor Analysis of Behaviour Change among Pupils in Public Primary Schools in Kisii County, Kenya. International Journal of Statistics and Applications 2017, 7(6): 316-319 DOI: 10.5923/j.statistics.20170706.07. |
| [12] | Husain and et.al (2012), Perception of education quality in private universities of Bangladesh: a study from students' perspective, journal of marketing for higher education volume 22, 2012 - issue 1: marketing for higher education in developing countries. |
| [13] | Sheikh Md. Monzurul Huq and et.al (2014), Public and Private Higher Education Concerns and Challenges: A Case of Bangladesh, Higher Education in the MENA Region, Policy and Practice (pp.420-441) Edition: 1st Edition, Publisher: IGI Global, United States of America. |
| [14] | Mohammad Nur Nobi (2012), A Comparative Study of the Socioeconomic Profile of Public and Private University Students in Bangladesh, The Chittagong University Journal of Social Sciences Vol. 30, (p.43-56). |

 Abstract
 Reference
 Full-Text PDF
 Full-text HTML