-
Paper Information
- Paper Submission
-
Journal Information
- About This Journal
- Editorial Board
- Current Issue
- Archive
- Author Guidelines
- Contact Us
International Journal of Statistics and Applications
p-ISSN: 2168-5193 e-ISSN: 2168-5215
2020; 10(6): 150-159
doi:10.5923/j.statistics.20201006.02
Received: Nov. 20, 2020; Accepted: Dec. 11, 2020; Published: Dec. 15, 2020

Bayesian Estimation of Variance Components, Heritability and Genetic Advance from Multi-Year and Location Chickpea Trials in Indian Environments
 Abstract
 Reference
 Full-Text PDF
 Full-text HTML
Siraj Osman Omer1, Abdel Wahab Hassan Abdalla2, Narendra Pratap Singh3, Hemant Kumar3, Murari Singh4
1Experimental Design and Analysis Unit, Agricultural Research Corporation (ARC), Wad Medani, Sudan
2Department of Agronomy, Faculty of Agriculture, University of Khartoum, Sudan
3Indian Institute of Pulses Research (IIPR), India
4International Center for Agricultural Research in the Dry Areas (ICARDA), Amman, Jordan
Correspondence to: Siraj Osman Omer, Experimental Design and Analysis Unit, Agricultural Research Corporation (ARC), Wad Medani, Sudan.
| Email: |  |
Copyright © 2020 The Author(s). Published by Scientific & Academic Publishing.
This work is licensed under the Creative Commons Attribution International License (CC BY).
http://creativecommons.org/licenses/by/4.0/

Mixed models are suited to describe the parameterization needed to estimate variance components due to genotypes, the environment and genotype × environment interaction over several locations and years. In Bayesian approach, incorporating the prior information of variance component from multi environment trials on the genotypic parameters available from previous similar trials has potential for adding value to the crop breeding program and genetic variability. The objective of this study was to obtain Bayesian estimates of variance components, heritability in broad-sense and genetic advance due to selection for seed yield of chickpea. Chickpea yield (kg/ha) on twelve genotypes data were collected from a series of multi-year multi-location trials conducted in randomized complete block designs in Indian environments. An MCMC estimator is implemented in the WinBUGS and R software for Bayesian posterior. The differences in variance component estimates obtained by two approaches, the classical approach using restricted maximum likelihood method and the Bayesian approach, were investigated. Bayesian estimate of heritability for seed yield on the plot-basis was different from that on the mean-basis, as may be expected. For seed yield, the Bayesian estimates of heritability were 9% on plot basis and 52% on mean basis, and the genetic advance due to selection was 7% using half-t prior. and were 13% on plot-basis and 58% on mean-basis, and the genetic advance due to selection was 8% using half-normal prior, which is higher in comparison to the frequentist approach.
Keywords: Bayesian analysis, Variance Components, Heritability, Genetic Advance, MCMC
Cite this paper: Siraj Osman Omer, Abdel Wahab Hassan Abdalla, Narendra Pratap Singh, Hemant Kumar, Murari Singh, Bayesian Estimation of Variance Components, Heritability and Genetic Advance from Multi-Year and Location Chickpea Trials in Indian Environments, International Journal of Statistics and Applications, Vol. 10 No. 6, 2020, pp. 150-159. doi: 10.5923/j.statistics.20201006.02.
Article Outline
1. Introduction
- In plant breeding the genotype-by-environment interactions play important role in developing specifically or broadly adapted genotypes across a wide range of environments. Therefore, the G×E interaction effect should be accounted for in the Bayesian model to predict breeding values [1]. Bayesian statistical analysis assumes that all uncertainty should be shaped with probability and that statistical inferences should be logical decision the laws of probability [2]. Plant breeders evaluate the lines in several locations and years for estimating the genetic performance [3]. Analysis of variance of an estimation of variance components from data arises in many areas of agricultural experimentation, especially in agronomy and plant breeding research. However, Bayesian estimation of variance components in multiple locations and years of balanced dataset has appeared in extremely limited cases [4]. The effects of G×E (genotype x environment) interaction on selection efficiency is negative in the case of qualitative effects (i.e. when G×E interactions change the ranking of genotypes in different environments). When discussing these interactions, it is essential to define whether ‘E’ indicates the year (Y), location (L) or a combination of the two [5]. However, although the breeding consequences of genotype by year (G×Y) interaction (GYI), genotype by location (G×L) interaction (GLI) and genotype by year within a location (GYIwl) interaction are quite different, a large part of the literature on G×E interaction does not make this distinction and, instead, lumps Y and L together as ‘environments’ [6]. Dror and Steinberg has applied Bayesian analysis that exploits a discretization of the parameter space to efficiently represent the posterior distribution [7], Bayesian solutions have been to some decision problems in crop management and variety selected [8]. Orellana used a Bayesian approach to estimate variance components in a hierarchical model under heterogeneous error and GEI variances applied to corn yield data [9]. To understand the criteria breeding strategies, the knowledge of genetic gains and heritability are useful in selection of recommendable features [10]. Omer et al., have stated clearly and in detail the Bayesian estimation of genotype-by-environment interaction in sorghum variety trials when interactions were GxE [4]. Bayesian approach is required a basic strategy to be used for analyzing a multiple environmental trial (METs) data, the good practice of analysis of variance and set out methods of presenting posterior results that comparing with a classical approach [11]. Jiang and Skorupski examined a Bayesian statistic to estimating variance components within a multivariate generalizability theory framework. In most of the METs data are normally tested over a wide range of environments (locations, years, growing seasons, etc.) and reliable statistical information can obtain using ANOVA or linear mixed models [12].In this study the models will be investigated for partially hierarchical ANOVA for the combined analysis of sets of experiments laid out in randomized complete block designs. In Bayesian approach the standard computational approach is to use Markov chain Monte Carlo (MCMC) methods to draw samples from posterior distributions [13]. Gibbs sampler and Metropolis Hastings algorithm are the two commonly used Markov chain Monte Carlo (MCMC) methods [14]. Application of Bayesian methods for variance component model in agricultural trials were reported by [15]. Luo et al., performed statistical approach of Bayesian inference for genetic parameter estimation of categorical traits of the direct and maternal genetic effects by Gibbs sampling [16]. Recently, Da Silva et al., studies Bayesian methods for Heterogeneity variance component under the additive main effects and multiplicative interaction (AMMI) model for multi environmental trials [17]. Also, Sun et al., has discussed different Bayesian methods for variance component model [18]. Incorporating the prior information of variance components from multi environment trials on the genotypic parameters available from previous similar trials has potential for adding value to the crop breeding program [15]. The variance components will be estimated using the appropriate mixed model structures fitted using experimental design data. To assess the relative contribution of genotype and genotype interactions, we estimated the variance components due to genotype (G), location (L) and two types of interaction: The G×L interaction and the G×Y interaction within location pooled over all the locations [19]. In plant breeding adaptation strategy and yield stability goals, variance components are used for determining most adaptable environment to genotype and genotype ×environment effects. Genotypic variance components for balanced data sets can be estimated as described in the liner mixed model [20]. An estimate of the former is obtained from the variance of the genotypic standard deviation values estimated for individual environments through separate ANOVAs [21]. The motivation for the research work arises from the viewpoint that the selection of an accurate estimate of variance components is particularly important for breeding value in plant breeding programs [22]. In plant breeding the new varieties are grown in several locations and years under different conditions of climate and soil fertility, therefore the different from the environmental conditions contribute to the genetic components of variance [23]. The use of Bayesian approach for estimating of variance components, which deal with unknown distributions for small data sets provide an exact posterior density [24]. The objective of this study is to obtain Bayesian estimates of heritability in broad sense for seed yield, genetic advance due to selection and variance components, when the interactions include (location × variety interaction), (year × variety interaction), (location × year × variety interaction) and the plot errors.
2. Materials and Methods
2.1. Experimental Data
- The studied dataset consists of seed yield values in kg/ha on twelve genotypes of chickpea evaluated for three years (2006, 2007 and 2008) at six locations: Delhi, Sriganganagar, Kanpur, Faizabad, Sehore and Junagarh, in India. The experimental design was a randomized complete block with three replications in each location and year. Twelve chickpea genotypes were BG256, DCP92-3, GNG469, HC3, HC1, ICCV10, ICCV2, JG11, JGK1, PantG186, Radhey and RSG 888. The chosen locations represented the chickpea production regions in India.
2.2. Frequentist Approach for Linear Mixed Model
- The linear mixed includes model where the three-factor interaction among genotype, year, and location (GYLI) is interpretable. If the test locations are geographically close (e.g., they might be the areas in nearby blocks of the same field) then the constituents of the ‘year’ factor can reasonably be assumed to be nearly the same over all the locations each year. In this case, it is possible to evaluate both the spatial interaction of genotype with location and the temporal interaction of genotype with year. This allows researchers to measure changes in the genotype × location (spatial) interaction in relation to year (time), as well as changes in the genotype × year (temporal) interaction in relation to location (space). ANOVA models as well as the REML models are herein considered for the combined analysis of sets of experiments laid out in randomized complete block designs. The ANOVA models comprise four factors assuming that the location is fixed while replication effects, genotype effect, and all other factor effects are random [25]. The interactions include location × genotype interaction (GLI), year × genotype interaction (GYI), location × year × genotype interaction (GLYI) and the plot errors. The yield response
 is modeled as follows:
 | (1) |
 is the yield response of the genotype i in the location j, year (or season) t and block k;
  = grand mean,
  is the effect of the genotype i,
  is the effect of the location j.
  is the effect of the year t and
  is the effect of block k within location (j) and year (t). This model is useful for multiple experiments trials conducted over locations and repeated in different time; with associated subscripts,
  is the effect interaction between locations and years,
  is the effect interaction between genotypes and locations,
  is the effect interaction between genotypes and years,
  is the effect interaction between genotypes, locations and years.
  is the residual error from the plot for
  , and assumed to be normally distributed with homogeneous variance
  It is assumed that
 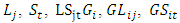 and
and  are normally and independently distributed, with means zero and variances
 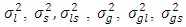 and
and  respectively. The values of vector indices are
  and
and  where
where  and
and  are number of locations, years, genotypes and blocks respectively. Bayesian estimation of variance component estimation will be based on the linear mixed model in equation (1). Bayesian approach therefore uses wide- adaptation rather than specific- adaptation where one pools the GY and the GLY interaction components to estimate temporal stability of genotypes [26].
2.3. Bayesian Approach for Linear Mixed Model
- In Bayesian application, the observations are assumed to be exchangeable samples (modeled as independent samples from some probability distribution) [27]. Thus, from a normal distribution as follows:
 where
where  The next level of the Bayesian hierarchy includes prior distributions for location, year, and location parameters (i.e., means)
  and their variances. In REML model all priors distribution were implied as normal distribution with means zero and variances defined to condition the desired level of information sharing among levels of the factor [28]. Independent prior distributions were assigned for the parameters used. These are specified as follows: for block effect =
 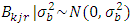 , effect of location =
 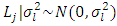 , effect of year =
  , effect of location and year interaction =
  , effect of genotypes =
  , effect of genotypes and location interaction =
  , effect of genotypes and year interaction =
 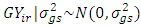 , and effect of GLS =
 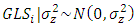 . The location factor was argued to be with random effects when the main interest of the analysis lies in the estimation of variance components for locations that are representative of the relevant production area within the target region [29].
2.4. Heritability and Genetic Advance Due to Selection
- Heritability plays a vital role in the selection process and measuring the relative influence of environment on the development of a specific quantitative trait [30]. Heritability estimates for phonetic traits are of useful of breeders using to aid in selection decisions [31]. Heritability estimates along with genetic advance is more helpful in foreseeing the genetic gain under selection than heritability estimates alone [32]. Bayesian approach for two types of heritability evaluations for each of the two models will be pursued. Denoting the estimates of genotype, Location and year, Location x year, genotype and year, genotype × Location, year variances by
 and
and  and experimental error (environmental) variance by
  .In this model the environment E is partitioned as L + S + L x S): Broad sense heritability on a mean-basis
  where
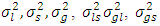
where 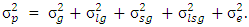 where
where  is genotypes variance,
  is estimate of location by genotypes interaction variance,
  is estimate of year by genotypes interaction variance,
  is estimate of year x location x genotypes interaction variance,
  is experimental error variance [33],
  where the phenotypic variance,
 Gelman reviewed several options for non-informative priors for scale parameters in hierarchical models and suggested the use of uniform,
  and half-normal families of distributions [34]. Crossa et al., used inverse-gamma distribution as a prior for variance components [29]. Based on normal distribution of the trait, the genetic gain due to selection of model,
  , at selection intensity
  is given by
  where
where 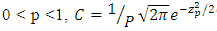 The truncation point
  in the standard normal distribution is given by the equation
 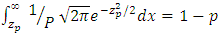 where
where  is the trial mean. When
  = 0.20,
  = 1.4 [35].
2.5. Priors for the Standard Deviation Components (SDCs)
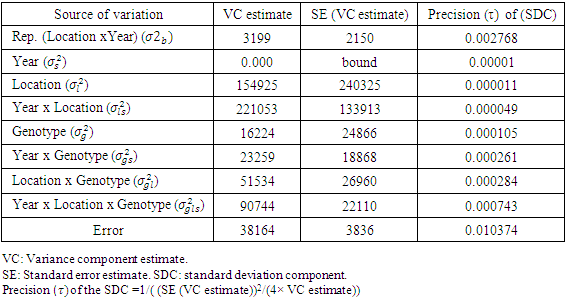
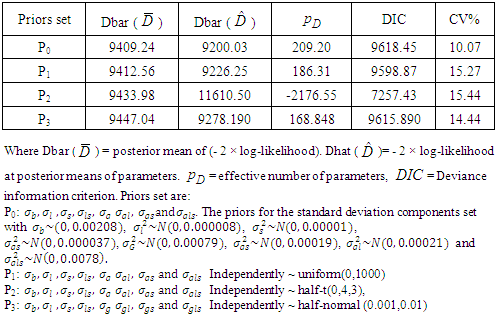
- In this study, priors were obtained by using data on seed yield values in kg/ha on 12 genotypes of chickpea evaluated for three years (2006, 2007 and 2008) in different three locations from three different experiments of same genotypes in RCBDs with three replications at Ludhiana, Ranchi and Berhampore in India. The various components of variance were estimated using restricted maximum likelihood (REML) estimation, by taking data from the three years only used as previous data for building prior information. The estimates of variance components along with their standard errors were obtained by using REML and associated directives in the Genstat software. The variance parameters of variance components the SDCs were estimated by using the approximation for variance of square-root of a random variable, say X, as Var(X)/(4X). Table 1 gives the estimates of the variance components and values of the precision parameter
 of the SDC
  , defined as the inverse of its variance. The a priori distribution for the SDC
  , may be denoted as the positively-truncated-normal:
 ,
,  ,
,  ,
,  ,
,  ,
,  ,
,  and
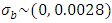
and  .2) P1: the priors for the standard deviation components
 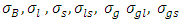 and
and  follow Uniform (0, 1000), 3) P2: the priors for the standard deviation components
  follow Half-t distribution
  = (Half-t (0, 4,3). Here,
  is non-centrality parameter and
  is the degree of freedom of the t-distribution. The values of
  and
and  are set at 5 and 2 respectively.4) P3: the priors for the standard deviation components
  follow Half-normal distribution
  = Half- normal (0.001, 0.01)I(0,),
  is precision parameter,
  given as inverse of variance.Winbugs and R codes have been presented in a Bayesian framework in appendixes presented in the paper. The example files contents of the WinBUGS and R codes are given in Appendices A1 and A2. The number of iterations was set at 50,000, the number of chains was set at three, and the last 5,000 simulated values of the parameters were taken for evaluating the posterior distributions.
3. Results and Discussion
3.1. Selection of Priors
- The standard frequentist analyses components were carried out using ANOVA and REML procedures of Genstat and the various statistics computed are presented along with the statistics using a Bayesian approach. The choices of priors for Bayesian analysis were made from the statistics given in Table 1 in case of all factors being assumed random, when the interactions include (location × variety interaction), (year × variety interaction), (location × year x variety interaction) and the plot errors. The values of DIC and pD are different for each distribution. However, the prior set P2 (half-t prior) seems to have a numerically lowest value of DIC (7257.43). We took, P0 (prior based on similar data distribution taken from a different environment) and P2 (half-t prior) for further estimation of the model parameters and providing a better understanding on how the parameters mentioned above affect the resulting Bayesian posterior parameters. Results of heritability, genetic advance and variance components of all factors are shown in Table 3 and Table 4, which provides a general picture of the relative magnitudes of the effects of genotype, location, year, and the genotype by location interaction due to genotype + location + genotype by location variations. Location was the most important source of yield.
|
|
|
3.2. Bayesian Estimation of Posterior Means, Genotypes Variance, Heritability, and Genetic Gain
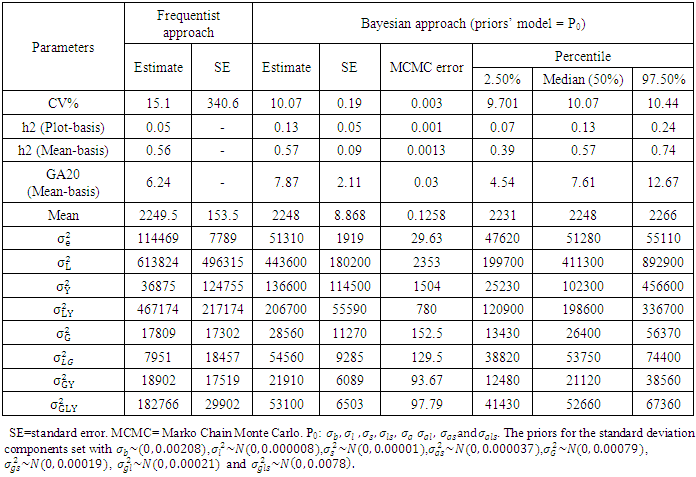
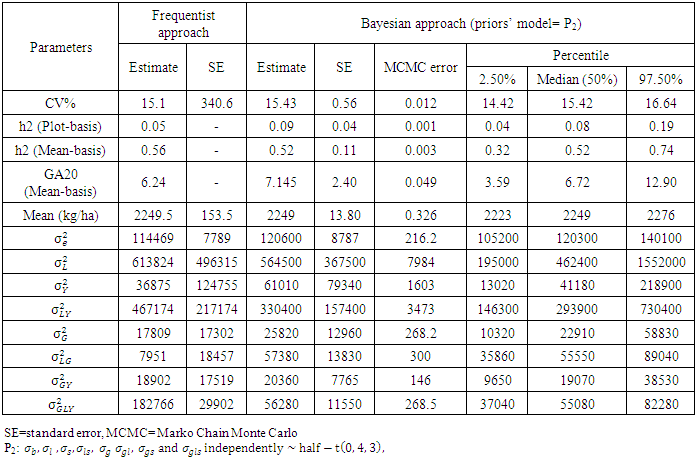
- The mean squares of the analysis of variance, heritability and genetic advance both in broad sense, estimation of variance under frequentists and Bayesian approach, as shown in Table 3 revealed significant and highly significant differences for frequentists and Bayesian approaches for heritability both in plot basis and mean basis, it was found to be high in majority cases indicated higher importance of genetic effects in control of traits. Bayesian estimate of experimental error variance
 or posterior expected value of the error variance given the plot-wise response data under the assumed linear model and half-normal prior (P0) slightly lower than the frequentists approach, and experimental error variance using half-t prior (P2) is slightly higher than the frequentists approach or classical least-square estimate. Bayesian estimate of heritability in compare to frequentist approach based on mean basis were (0.52 vs. 0.56) for P2 and (0.57 vs0.56) for P0. Bayesian estimate of heritability in compare to frequentist approach based on plot basis were (0.09 vs. 0.05) for P2 and (0.14 vs0.05) for P0. Bayesian estimate of genetic advance in compare to frequentist approach based on mean-basis were (7.2 vs 6.2) for P2 and (7.9 vs. 6.2) for P0. Half- normal distribution ((P0) given lowest CV% was 10.6 in comparing with a half-t prior and classical approach were (15.1) and (15.44) respectively. The CV% estimate based on mean value under frequentist and Bayesian approach was quite different, thus, indicating reliable numerical approximation through the number of simulations runs used. In other words, coefficients of variation for each prior are different to each other, indicating a major part of phenotypic variations belonging to genotypic variation (Table 2). The Bayesian estimate of experimental error variance based on mean value using P0 is slightly lower than that under the Frequentist approach were (51310 vs. 114469), in percentage (31% vs. 69%). The Bayesian estimate of the environment (location × variety interaction) based on mean value were (54560 vs.7951) or in percentage (87% vs. 13%) using P0 and were (57380 vs.7951) or in percentage (88% vs. 12%) using P2 are higher than that under the frequentist approach. The Bayesian estimate of the environment (year ×location interaction) based on mean value were (206700 vs.467174) or in percentage (31% vs. 69%) using P0 and were (330400 vs. 467174) or in percentage (41% vs. 59%) using P2 are higher than that under the frequentist approach. Bayesian estimate of variance components of all parameters include (year × location interaction), (location × year × variety interaction) and the plot errors are very smallest in comparison to the frequentist approach. While Bayesian estimate of variance components of all parameters include (genotypes, year × genotype interaction, location × variety interaction based on plot are very higher in comparison to the frequentist approach. Bayesian estimates of heritability and genetic advance under two approaches are more efficient; however, Bayesian approach provided confidence interval. Bayesian heritability and genetic advance estimates have been found to be useful in indicating the relative values of selection based on phenotypic expression of different characters. The Monte Carole error in all the parameters of Table 3 and Table 4 are small, indicating reliable numerical approximation through the number of simulations runs used. The distribution of variance components and heritability from Bayesian approach are skewed reflecting a remarkable difference between their means and their variances in both models. It was found that the posterior mean (i.e., the Bayesian estimates) was higher than the corresponding frequentist estimates for heritability and genetic advance. For all the estimates, the posterior standard deviations in the Bayesian approach were smaller than the corresponding standard errors in the frequentist approach.
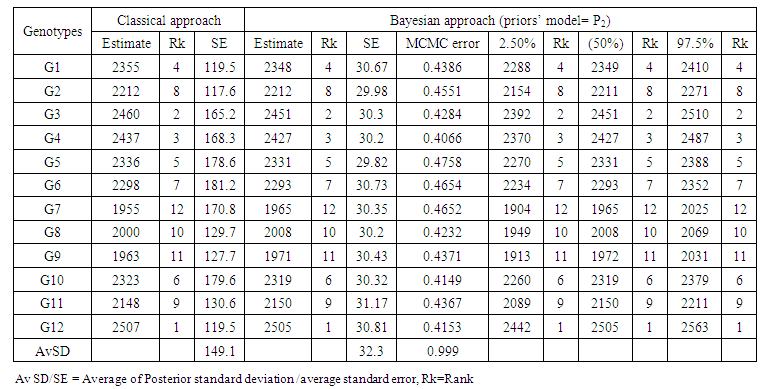 | Table 5. Predicted values of the genotypes under classical model and Bayesian approach for chickpea for seed yield from the trials in 18 environments (2006 – 2008), at (Delhi, Sriganganagar, Kanpur, Faizabad, Sehore and Junagarh) in India based on half-t-prior |
4. Conclusions
- In this paper, we navigated the Bayesian approach for statistical analysis of multi-environmental trials (MET) and compared with the commonly used frequentist approach (i.e., classical approach) The discrepancy information criteria (DIC) were used to identify the most appropriate prior models for applying the Bayesian approach on seed yield data from multi-year and location chickpea trials in Indian environments. The posterior means (i.e., the Bayesian estimates) for variance components for genotype, year, location, and their interactions were substantially lower than those of the respective estimates under frequentist approach, and the associated standard deviations of those estimates were also relatively low under the Bayesian approach. In general, Bayesian estimates of the coefficient of variation were found smaller than those under the frequentist approach. Bayesian estimates of heritability and genetic advance were substantially higher than those of the frequentist approach, although the former approach allows a greater number of parameters to be random. This reflects a desirable aspect of Bayesian approach for estimation of genetic parameters in plant breeding in multi environments trials. Both approaches showed less difference in the estimates of genotypic and phenotypic variance, and higher genotypic values compared to environmental variances. The Bayesian codes in WinBUGS of the variance components, heritability, and genetic improvement of multi environmental trails are given for analysis of similar experimental designs in crop variety trials.
ACKNOWLEDGEMENTS
- The first author is grateful to ICARDA and Arab Fund for Economic and Social Development (AFESD) for granting a Fellowship for carrying out the research study.
Appendixes
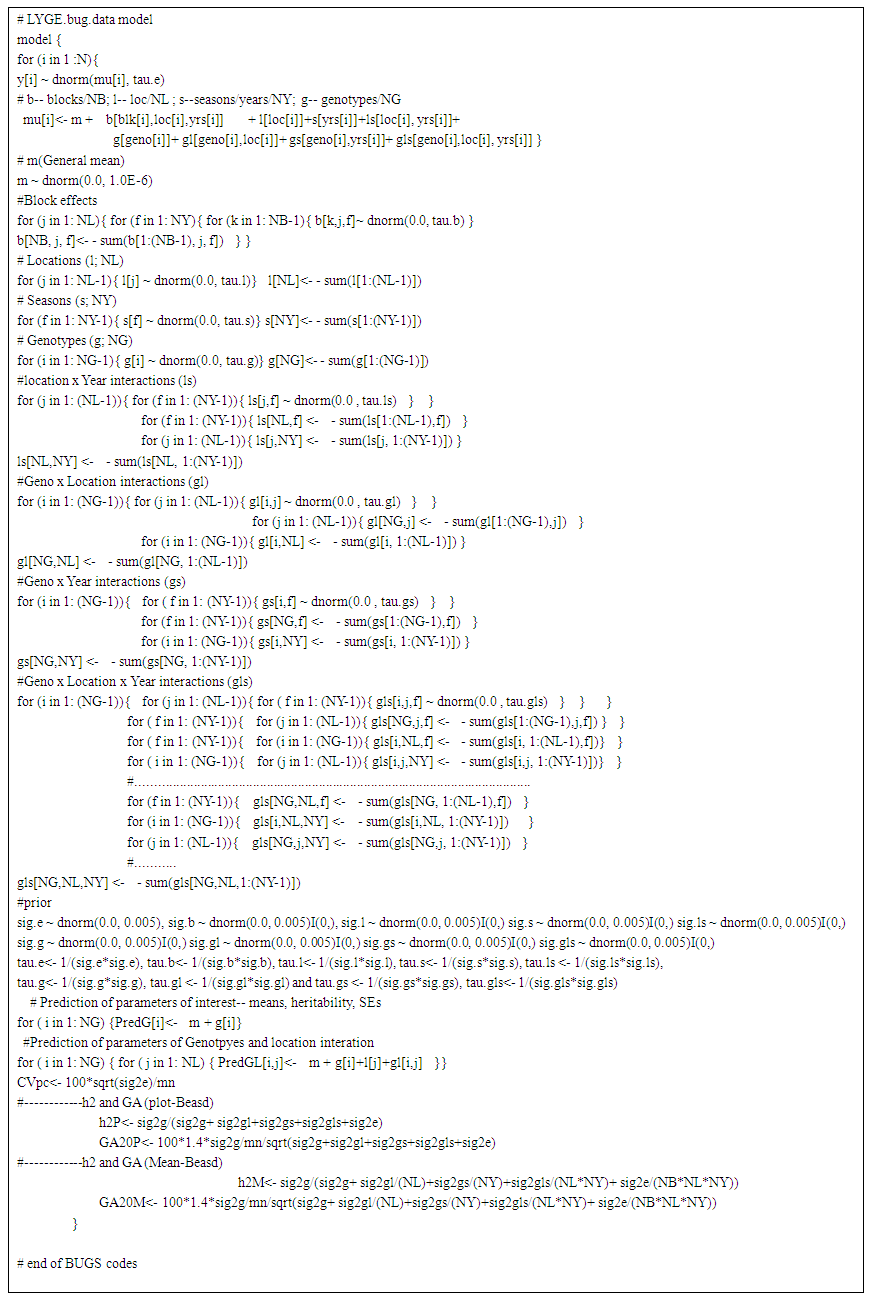 | Appendix-A1. WinBUGS Code for Bayesian analysis of variance components, heritability and genetic ddvanceconducted over several locations and years of model1 |
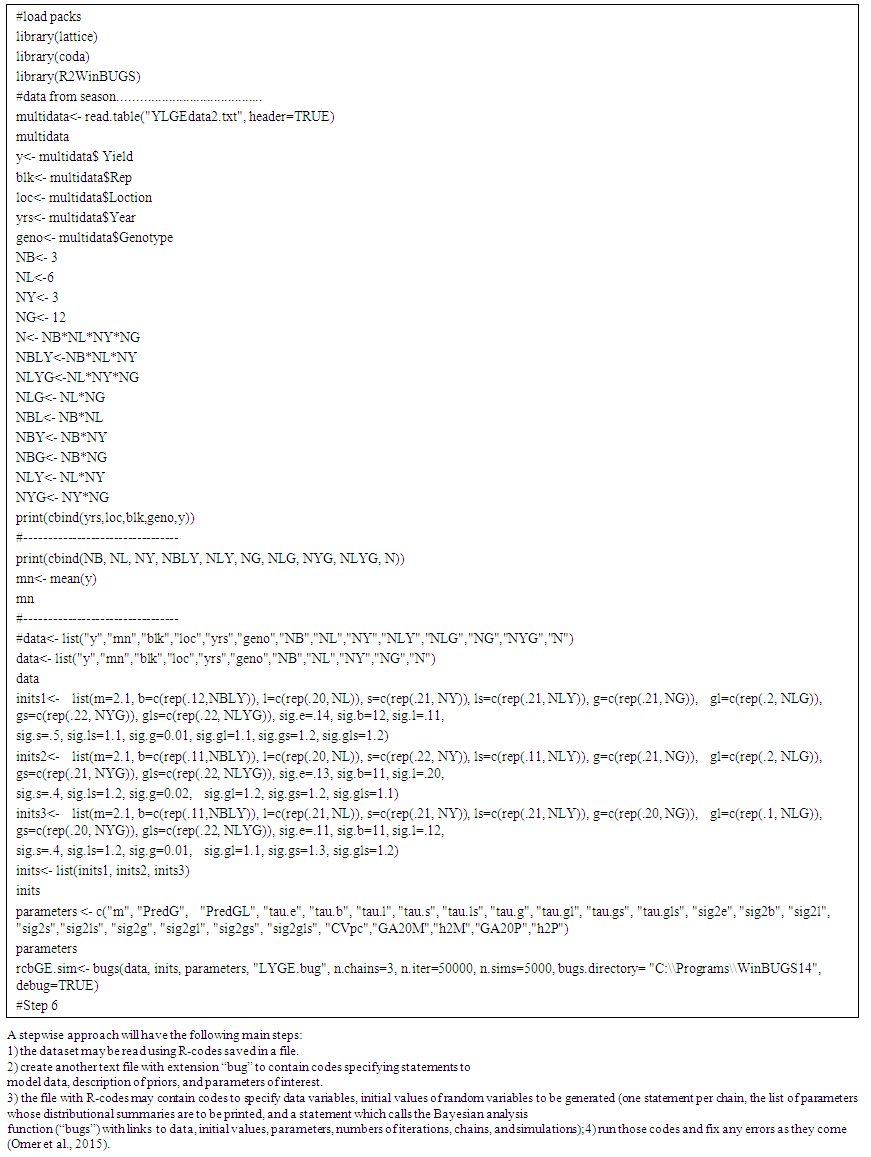 | Appendix-A2. RCode for Bayesian analysis of variance components, heritability and genetic ddvanceconducted over several locations and years |
References
| [1] | Cuevas, J., Crossa, J., Montesinos-López, O.A. and Burgueño, J. (2017). Bayesian genomic prediction with genotype environment interaction kernel models. G3: Genes, Genomes, Genetics, 7(1)43-53. |
| [2] | Crossa, J., Perez-Elizalde, S., Jarquin. D., Cotes. M.J., Viele. K., Liu, G. and Cornelius, P.L. (2011). Bayesian estimation of the additive main effects and multiplicative interaction model. Crop Science, 51(4): 1458-1469. |
| [3] | Vargas, M., Combs, E., Alvarado, G., Atlin, G., Mathews, K, and Crossa, j. (2013). META: A suite of SAS programs to analyze multi-environment breeding trials. Agronomy Journal 105(1): 11-19. |
| [4] | Omer, S.O., Abdalla, A.W.H., Mohammed, M.H. and Singh, M. (2015). Bayesian estimation of genotype-by-environment interaction in sorghum variety trials. Communications in Biometry and Crop Science 10: 82–95. |
| [5] | Shahriari, Z., Heidari, B., Dadkhodaie, A. (2018). Dissection of genotype × environment interactions for mucilage and seed yield in Plantago species: Application of AMMI and GGE biplot analyses. PLoS ONE 13(5): e0196095. https://doi.org/10.1371/journal.pone.0196095. |
| [6] | Ceccarelli, S. (2015). Efficiency of Plant Breeding. Crop Science, 55(1):87-97. doi:10.2135/cropsci2014.02.0158. |
| [7] | Dror, H.A. and Steinberg, D.M. (2008). Sequential experimental designs for generalized linear models. Journal of the American Statistical Association, 103(481): 288-298. |
| [8] | Omer, S. O., Abdalla, M. S., Alzain, I. N. and Dafaalla, A. (2017). Bayesian credible intervals for maize grain yields of the maintenance varieties evaluated in Sudan. International Journal of Applied Sciences and Biotechnology, 5(3): 390-396. https://doi.org/10.3126/ijasbt.v5i3.18303. |
| [9] | Orellana, M.A. (2012). Bayesian prediction of crop performance modeling genotype by environment interaction with heterogeneous variances. Graduate Theses and Dissertations, 12740. |
| [10] | Stock, K.F., Distl, O., and Hoeschele, I. (2007). Influence of priors in Bayesian estimation of genetic parameters for multivariate threshold models using Gibbs sampling. Genetics Selection Evolution. 39(2): 123–137. |
| [11] | Singh M., Al-Yassin A. and Omer, S.O. (2015) Bayesian estimation of genotypes means, precision and genetic gain due to selection from routinely used barley trials. Crop Science 55: 501–513. |
| [12] | Jiang, Z. and Skorupski, W. (2018). A Bayesian approach to estimating variance components within a multivariate generalizability theory framework. Behavior Research 50: 2193–2214. |
| [13] | Gelman, A., Brooks, S., Jones, G., Meng, X.L. (2011). Handbook of Markov chain Monte Carlo: methods and applications. Chapman and Hall/CRC, New York. |
| [14] | Bardsley, J.M. and Cui, T. (2019). A Metropolis-Hastings-within-Gibbs sampler for nonlinear hierarchical-Bayesian inverse problems. In: Wood D., de Gier J., Praeger C., Tao T. (eds) 2017 MATRIX Annals. MATRIX Book Series, vol 2. Springer, Cham. https://doi.org/10.1007/978-3-030-04161-8_1. |
| [15] | Searle, S. R., Casella, G. and McCulloch, C. E. (2006). Variance Components. Wiley, NewYork. |
| [16] | Luo, M.F., Boettcher, P.J., Schaeffer, L.R. and Dekkers, J.C. (2001). Bayesian inference for categorical traits with an application to variance component estimation. Journal of Dairy Science, 84(3): 694-704. Doi: 10.3168/jds.S0022-0302(01)74524-9. |
| [17] | Da Silva, C.P., de Oliveira, L.A., Nuvunga, J.J., Pamplona, A.K.A. and Balestre, M. (2019). Heterogeneity of variances in the Bayesian AMMI model for multi environment trial studies. Crop Science, 59(6): 2455-2472. Doi: 10.2135/cropsci2018.10.0641. |
| [18] | Sun, L., Hsu, J.S.J., Guttman, I. and leonard. T. (1996). Bayesian methods for variance component model. Journal of the American Statistical Association 91(434): 743-752. |
| [19] | Burgueño, J., Crossa, J., Cotes, J. M., Vicente, F. S. and Das, B. (2011). Prediction Assessment of Linear Mixed Models for Multienvironment Trials. Crop Science, 51(3): 944. doi: 10.2135/cropsci2010.07.0403. |
| [20] | Schmidt, P., Hartung, J., Rath, J. and Piepho, H.P. (2019). Estimating Broad-Sense Heritability with Unbalanced Data from Agricultural Cultivar Trials. Crop Science, 59(2): 525-536. |
| [21] | Gauch, H.G. (2006). Statistical analysis of yield trials by AMMI and GGE. Crop Science, 46(4): 1488–1500. |
| [22] | Aguate, F., Crossa, J. and Balzarini, M. (2019). Effect of missing values on variance component estimates in multi environment trials. Crop Science, 59(2): 508-51. Doi: 10.2135/cropsci2018.03.0209. |
| [23] | Zorić, M., Terzić, S., Sikora, V., Brdar-Jokanović, M. and Vassilev, D. (2016). Effect of environmental variables on performance of Jerusalem artichoke (Helianthus tuberosus L.) cultivars in a long term trial: A statistical approach. Euphytica, 213(1): 23. doi: 10.1007/s10681-016-1819-7. |
| [24] | Omer, S. O., Slafab, E. H. and Rathore, A. (2015). Bayesian analysis for genotype x environment interactions and the GGE-biplot assessment: Evaluation of balanced classifications with missing values. International Journal of Applied Sciences and Biotechnology, 3(2): 210-217. https://doi.org/10.3126/ijasbt.v3i2.11908. |
| [25] | Meyer, K. (2009). Factor-analytic models for genotype × environment type problems and structured covariance matrices. Genet Sel Evol 41, 21. https://doi.org/10.1186/1297-9686-41-21. |
| [26] | Lee, C. and Wang, C.D. (2001). Bayesian inference on variance components using Gibbs sampling with various priors. Asian-Australasian Journal of Animal Science, 14(8): 1051-1056. |
| [27] | Satagopan, J. M., Olson, S. H., & Elston, R. C. (2015). Statistical interactions and Bayes estimation of log odds in case-control studies. Statistical Methods in Medical Research, 26(2): 1021–1038. doi: 10.1177/0962280214567140. |
| [28] | Edwards, J.W. and Jannink, J.L. (2006). Bayesian modeling of heterogeneous error and genotype and environment interaction variances. Crop Science, 46(2): 820–833. |
| [29] | Crossa, J., Burguen˜o, J., Vargas, M. (2010). Statistical models for studying and understanding genotype 9 environment interaction in an era of climate change and increased genetic information. In: Reynolds M (ed) Climate change and crop production, CABI Climate Change Series. CIMMYT, Mexico, pp 263–283. |
| [30] | Srinivasan, M.R. and Ponnuswamy, K.N. (1993) Estimation of variance components based on triallel mating design. Theoretical and Applied Genetics 85: 593–597. |
| [31] | Wiggins, B., Wiggins, S., Cunicelli, M., Smallwood, C., Allen, F., West, D. and Pantalone, V. (2019). Genetic gain for soybean seed protein, oil, and yield in a recombinant inbred line population. The Journal of the American Oil Chemists' Society 96(1): 43-50. |
| [32] | Bekele, A. and Rao, T.N. (2014). Estimates of heritability, genetic advance and correlation study for yield and it is attributes in maize (Zea mays L.). Journal of Plant Sciences, 2(1): 1-4. |
| [33] | Omer, S.O., Abdalla, A. H., Ceccarelli, S., Grando, S. and Singh, M. (2014) Bayesian estimation of heritability and genetic gain for subsets of genotypes evaluated in a larger set of genotypes in a block design. European Journal of Experimental Biology, 04(03): 566-575. ISSN 2248-921. |
| [34] | Gelman, A. (2006). Prior distributions for variance parameters in hierarchical models. Bayesian Analysis 1: 515–533. |
| [35] | Singh M., Grando S., Ceccarelli S. (2006) Measure of repeatability of genotypes by location Interaction using data from barely trails in Northern Syria. Experimental Agriculture 42: 189–198. |