Tanmoy Samanta
Dept. of Economics, Tamralipta Mahavidyalaya, Tamluk, India
Correspondence to: Tanmoy Samanta, Dept. of Economics, Tamralipta Mahavidyalaya, Tamluk, India.
| Email: |  |
Copyright © 2020 The Author(s). Published by Scientific & Academic Publishing.
This work is licensed under the Creative Commons Attribution International License (CC BY).
http://creativecommons.org/licenses/by/4.0/

Abstract
Are chemical fertilizers associated with the increased yield rate of the principal crop in West Bengal? Using data of 18 districts of West Bengal for the period 2000-01 to 2011-12 this paper examines whether the marginal and partial (or better orthopartial, 2008) explanatory power of chemical fertilizers in explaining the yield rate of the principal crop in West Bengal is significant or not. By considering different types of chemical fertilizers it is observed that nitrogen, phosphate, potash, and total chemical fertilizer are both marginally and partially significant for increasing the yield rate of the principal crop in West Bengal.
Keywords:
Yield rate of principal crop, Marginal significance, Partial (Orthopartial) significance
Cite this paper: Tanmoy Samanta, Marginal and Partial Significance of Chemical Fertilizer Explaining Yield Rate of the Principal Crop: Special Reference to West-Bengal, International Journal of Statistics and Applications, Vol. 10 No. 5, 2020, pp. 131-139. doi: 10.5923/j.statistics.20201005.03.
1. Introduction
Linear multiple regression is a very popularly and conveniently used econometric technique in empirical research. The general form of a linear multiple regression model is | (1) |
With the help of this model (1), we generally examine how the explanatory variables X1, X2,…, Xk explain the variability of the explained variable Y. The coefficient of Xj, denoted by βj, measures the amount of change in Y for one-unit change in Xj, keeping the values of all other X remain constant.The null hypothesis that a particular explanatory variable Xj has no significant role in explaining Y, i.e., H0: βj = 0 is tested against the alternative that H1: βj ≠ 0 with the help of t-statistic in the existing literature. From this t-statistic a squared correlation between Y and Xj is obtained as  and is explained as the squared partial correlation between them. This t-statistic and the corresponding partial correlation is used to test the partial significance of the explanatory variables in the multiple regression model (Amemiya, 1985 [1]; Anderson, T. (1972) [2]; Davidson and MacKinnon, 1993 [5]; Fomby et al., 1984 [6]; Goldberger, 1964 [9]; Greene, 2000 [10]; Jonston and DiNardo, 1997 [12]; Kmenta, 1986 [16]; Maddala, 1989 [17]; Rao and Miller 1971 [20]).With the help of the t-statistic in the existing literature sense, we can here be tested the partial effect of chemical fertilizer on the yield rate of the principal crop in West Bengal. That is, the null hypothesis that the coefficient of chemical fertilizer is equal to zero is tested against the alternative hypothesis that the coefficient of chemical fertilizer is not equal to zero by t-statistic in the existing literature sense. The test of significance of the coefficient of chemical fertilizer based on the t-value of the estimated coefficient of chemical fertilizer, basically examines whether the degree of linear association between the yield rate of principal crop and chemical fertilizer, after eliminating the effects of all other explanatory variables from both yield rate of principal crop and chemical fertilizer, is significant or not. Thus, the yield rate of the principal crop is regressed on all other explanatory variables except chemical fertilizer and the errors from this regression, denoted by ‘U’, and if chemical fertilizer is regressed on other explanatory variables to obtain the errors denoted by ‘V’. If we take a simple regression of U on V, will give the same regression coefficient, estimated standard error (and hence t-value) with the same degrees of freedom (n-k-1), as are found in multiple regression. The degrees of freedom of yield rate of the principal crop in the deviation form being (n-1), the degrees of freedom of the residual U is {n-1-(k-1)} = (n-k). Automatically, the degrees of freedom of the residual in the regression of U on V become (n-k-1). The squared correlation (R2) in the regression of U on V, which is also related to the corresponding t-statistic (t) by R2 = t2/ (t2 + n – k – 1), is called the partial correlation between the yield rate of principal crop and chemical fertilizer on the logic that the variability of chemical fertilizer, when all other independent variables except chemical fertilizer remain unchanged, is observed only in the variability of V and its effect on yield rate of the principal crop is observed through its effect on U.The statement that the coefficient of chemical fertilizer measures the amount of change in yield rate of the principal crop for one unit change in chemical fertilizer, keeping the values of all other explanatory variables constant can be expressed as the coefficient of chemical fertilizer measures the amount of change in yield rate of the principal crop for one unit change in that part of chemical fertilizer which is not influenced by other explanatory variables. The effect on the yield rate of the principal crop of such a change in chemical fertilizer will be on that part of the yield rate of the principal crop which is not influenced by other explanatory variables.Thus, the coefficient of chemical fertilizer has two distinct interpretations:• It can be interpreted as the amount of change in that part of the yield rate of the principal crop, which is not influenced by other explanatory variables for one-unit change in that part of chemical fertilizer which is not influenced by other explanatory variables.• It can also be interpreted as the amount of change in yield rate of the principal crop for one-unit change in that part of chemical fertilizer, which is not influenced by other explanatory variables.The estimate of chemical fertilizer, its standard error, and the t-value obtained from the regression of U on V are relevant when we are interested in the first interpretation of the coefficient of chemical fertilizer. But in the existing literature, they are used for both interpretations. Now a crucial question is how can we use the method relevant for the first interpretation of the coefficient of chemical fertilizer when we are interested in the second interpretation of it? Actually, when we are interested in examining whether chemical fertilizer (out of several explanatory variables) has a significant partial effect on the yield rate of principal crop or not, the estimated coefficient of chemical fertilizer in the multiple regression of yield rate of the principal crop on all factors, or the estimated coefficient of V in the regression of U on V may be relevant but their common standard error (or t-value) are not. Actually, the standard error or the t-value (existing literature sense) does not explain the partial significance of chemical fertilizer (here), but does explain the marginal significance of it; the significance of chemical fertilizer in explaining the variability of that marginal part of yield rate of the principal crop which is not explained by other explanatory variables.
1.1. Factors Affecting Agricultural Production: A Brief Survey of Literature
By yield rate of the principal crop, we mean the production of principal crops per hectare of agricultural land.Most of the research work in the field of agriculture in West Bengal have emphasized on the growth pattern of the agricultural sector. The studies by Boyce (1987) [3], Saha and Swaminathan (1994) [21], Chattopadhyay and Das (2000) [4], and Ghosh and Kuri (2007) [8] are based on the growth pattern of agriculture in West Bengal. Majumdar and Basu (2005) [18] point out that growth in agricultural production mainly arises from two sources viz., expansion of land area put to agricultural use and/or more productive utilization of existing cultivable land area. However, the first possibility appears to be exhausted in the state of West Bengal due to population growth and increasing demand for land for non-agricultural uses and thus, the second source is increasingly assuming greater importance in enhancing agricultural production (Ghosh and Kuri, 2005) [7]. Saha and Swaminathan (1994) find that in the period 1965–1980 the growth of agricultural production in West Bengal is exceptionally low compared to the rest of the country. However, the situation changed distinctly in the 1980s. Agricultural growth is accelerated, and West Bengal does better than other eastern states and the rate of growth of food grain production is the highest among 17 major states in the country.In addition, another work by Kaur, Malhi, and Kiran (2015) [14] and they see that there is an increasing trend in the cropped area under cotton at the state level and the country as a whole in India but slight ups and downs are observed at the district level. Production of cotton also shows an overall increasing trend at the state and district level and its yield shows an upward trend at the district level in India. Likewise, there is also an increasing trend in the area under castor crop at the country level, and variations are found at state and district levels in India. Its production also shows instability but the average increase is observed at the state and district level in India. The yield of castor crops also shows variations but on average an increasing trend is observed in India. Furthermore, the area under banana crop shows variations at all three levels in India. Its production shows annual instability at the state level but overall decreases at the district level. Its yield also shows a decreasing trend at the district level. Kannan and Sundaram (2011) [13] explain that there is a marked shift from the cultivation of food grains to commercial crops in India. The use of technological inventions, irrigation, and fertilizers were important factors that ensured higher growth in crop production.Several factors are responsible for explaining the variation in agricultural production in a region/country. Badar, Ghafoor, and Adil (2007) [11], have tried to identify the factors that affect agricultural production in Punjab (Pakistan) by considering the Cobb-Douglas agricultural production model for Punjab. They state that the total cropped area, agricultural laborer, distribution of seed, budgetary expenditure on agricultural research and extension, land reclamation, and wheat price positively affect agricultural production whereas fertilizer and expenditure on food trading services affect it negatively. On the other hand, Kayet and Dolai (2017) [15] have also tried to identify some factors that affect food grain production in West Bengal and they conclude that along with other relevant factors chemical fertilizer has a significant positive role in explaining food grain production in West Bengal.However, using the data of 18 districts of West Bengal for the period 2000-01 to 2011-12 this paper tries to examine whether chemical fertilizer has only a significant marginal role or both marginal as well as partial (or better orthopartial) role or not any significant role in explaining the yield rate of the principal crop in West Bengal.
2. Methodology
We should consider both the marginal significance as well as the partial significance of an explanatory variable in explaining the variability of the explained variable as,An explanatory variable may be both marginally as well as partially significant. It may be marginally significant but may not be partially significant. It may be neither marginally nor partially significant.If the first case arises then it can easily be said that the explanatory variable has an incredibly significant role in determining the variability of explained variable. If the second case arises, we can say that the variable has a significant marginal role for determining the variability of the explained variable but has not a partial role. But if unfortunately, the third case arises then we must be ignored that variable. Though in the existing literature the partial significance of an explanatory variable is measured by considering the estimated standard error (and hence the estimated t-value) of the coefficient of the corresponding variable by the formula like equation (2) it should be treated as the marginal significance of that variable as proposed by Mondal (2008) [19]. And following Mondal (2008) we propose that the partial significance of the variable can be measured by the formula like equation (3) and it is better named as the orthopartial significance (orthopartial means true partial) proposed by Mondal (2008). The marginal significance and the partial significance of chemical fertilizer in explaining the yield rate of the principal crop in West Bengal can be estimated by the formulas given below.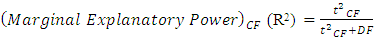 | (2) |
CF denotes chemical fertilizerDF denotes degrees of freedom and DF = {n-(k+1)} for testing the marginal significance. | (3) |
R2 = t2/ (t2+DF)R2 (t2+DF) = t2R2t2 + R2DF = t2t2 (1- R2) = R2DFt2 = R2DF/ (1- R2)t = √ {R2DF/ (1- R2)}. Degrees of Freedom = (n-2) for testing the partial significance.R2new means R-square after the addition of chemical fertilizer as an explanatory variable and R2old means R-square before the addition of chemical fertilizer as an explanatory variable.
3. Database
The study uses both cross-section and time-series data. The sample consists of a cross-section of 18 districts of West Bengal. The sample period begins in 2000-01 and ends in 2011-12. The yield rate of the principal crop in West Bengal is used as a dependent variable. The raw data of yield rate of the principal crops are collected from the Directorate of agriculture, Govt. of West Bengal, and are measured by kilograms per hectare.Rainfall is expected to have an ambiguous effect on the yield rate of the principal crops in West Bengal. The data of total rainfall are collected from the Agricultural meteorologists, Directorate of agriculture, Govt. of West Bengal, and are measured by millimeter.Share of the irrigated area under principal crop is obtained from the total irrigated area under principal crop dividing by the total area under principal crop and is measured by percentage term. The raw data of total irrigated areas under principal crops are collected from the Directorate of agriculture, Govt. of West Bengal, and are measured by hectare. It is expected to have a positive role in explaining the yield rate of the principal crops in West Bengal.Per hectare working capital for the principal crop is expected to have a positive role in explaining the yield rate of the principal crop in West Bengal. The working capital from different agricultural credit societies is used as total working capital for the principal crops. The raw data of working capital for the principal crops are collected from the Assistant Registrar of Co-operative Societies and are measured by rupees in 2009-10 constant prices.Chemical fertilizer is also expected to have a positive role in explaining the yield rate of the principal crops in West Bengal. The data of chemical fertilizer are collected from the Directorate of agriculture, Govt. of West Bengal, and are measured by tonnes.
4. Different Tests for Panel Estimation
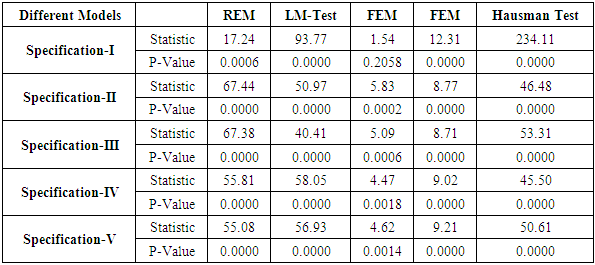
The study uses the data consisting of 18 districts of West Bengal for the referred period. First of all, all models are estimated by three popular and convenient test techniques of panel data analysis viz., the fixed-effect model (FEM), the random effect model (REM), and the pooled regression (OLS) and later only the pooled regression technique is applied for the empirical test. (i). The random effect model is the fittest model if the probability value of the test statistic of Breusch-Pagan LM test for random effect (Chi-bar2) is statistically significant at a certain level and if the probability value of the test statistic of Hausman specification test (Chi2) is statistically not significant at a certain level.(ii). The fixed-effect model is the fittest model if the probability value of the test statistic of Breusch-Pagan LM test for random effect (Chi-bar2) is statistically significant at a certain level, if the probability value of the test statistic of FEM (F) is statistically significant at a certain level and if the probability value of the test statistic of Hausman specification test (χ2) is statistically significant at a certain level.(iii). Ordinary least square model is the fittest model if the probability value of the test statistic of Breusch-Pagan LM test for random effect (Chi-bar2) is statistically not significant at a certain level if the probability value of the test statistic of FEM (F) is statistically not significant at a certain level and if the probability value of the test statistic of Hausman specification test (χ2) is statistically not significant at a certain level.Table 1. Results of Different Tests for Panel Data Analysis
 |
| |
|
Table 1 gives the estimated values of different test statistics and their corresponding significance levels under the Random Effect and Fixed effect models of panel data analysis. The relevant tests are chi-square and chi-bar-square (LM-Test) for REM, F-tests for FEM, and chi-square (Hausman) for specification tests. Though from the results in table 1 it seems that the fixed effect model is better fitted than the random effect model in all the above specifications as the values of the statistic of Hausman Test are highly significant (at less than one percent level) and though the FEM seems to be better than OLS, for this work pooled regression technique (ordinary least square technique) is applied for the present art of inference in terms of marginal and orthopartial significance of different explanatory variables in general and those of chemical fertilizer in particular. To be more specific, the pooled regression technique is considered due to the following reasons: (1) The main focus of this paper is to examine whether chemical fertilizer has an only a marginal role or both marginal as well as partial (orthopartial) role in explaining yield rate of principle crop in West Bengal. (2) The panel regression technique gives three types of the coefficient of determination (R2); within R2, between R2, and overall R2 and if we calculate orthopartial effect of chemical fertilizer on the yield rate of principal crops it gives three different orthopartial explanatory power which may sometimes contradict each other. (3) The above problem does not arise when we consider pooled regression technique (OLS) because it gives only one coefficient of determination (R2) and if we calculate orthopartial effect of chemical fertilizer on the yield rate of principal crops it gives only one orthopartial explanatory power.
5. Findings
5.1. Basic Result
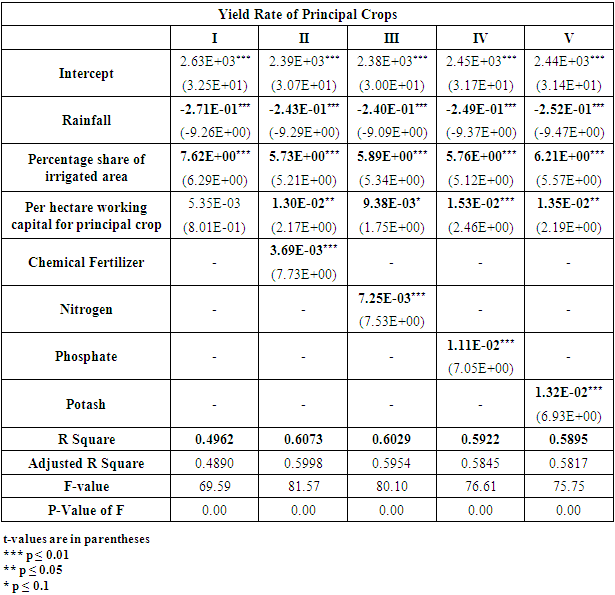
Table 2 reports the pooled regression (ordinary least square) results of the effect of various factors on the yield rate of principal crops in West Bengal. The specifications vary with the extent of control for the various chemical fertilizer variables (Nitrogen, Phosphate, and Potash). The first specification includes rainfall, percentage share of irrigated area, and per hectare working capital for principal crop while the second specification includes total chemical fertilizer along with other measurable variables. The third specification further includes only nitrogen as chemical fertilizer, other factors remaining unchanged. The fourth specification further includes the only phosphate as chemical fertilizer, other factors remaining unchanged. The fifth specification again includes only potash as chemical fertilizer, other factors remaining unchanged. The probability values of F-statics of all specifications are almost zero which indicates the entire models are highly significant.The explanatory variables of specification-I, specification-II, specification-III, specification-IV and specification-V explain 49.62 percent (R2 = 0.4962), 60.73 percent (R2 = 0.6073), 60.29 percent (R2 = 0.6029), 59.22 percent (R2 = 0.5922) and 58.95 percent (R2 = 0.5895) respectively of the variation in yield rate of principal crops in West Bengal.Table 2. Basic Result: Pooled Regression (OLS) Dependent Variable: Yield Rate of Principal Crop in West Bengal
 |
| |
|
From table 2, we find that the coefficient of rainfall is negative for all specifications (-2.71E-01 in the first specification, -2.43E-01 in the second specification, -2.40E-01 in the third specification, -2.49E-01 in the fourth specification, and -2.52E-01 in the fifth specification) and all are significant at 1 percent level suggesting that yield rate of principal crops are negatively associated with rainfall in West Bengal. For table 2, it can be stated that, for an increase in average rainfall by one millimeter, the production of principal crops per hectare in West Bengal reduces by 0.24 to 0.27 kilograms. The coefficient of percentage share of irrigated area is positive for all models (7.62 in first specification 5.73 in the second specification, 5.89 in the third specification, 5.76 in the fourth specification, and 6.21 in the fifth specification) and significant at 1 percent level suggesting that the yield rate of principal crops is positively associated with a percentage share of irrigated area in West Bengal. In this case, for a one percent increase in the irrigated area the production per hectare increases by 5.73 to 7.62 kilograms in West Bengal. These two results apparently seem contradictory to each other as rainfall is observed to have a negative effect while the share of irrigated areas is observed to have a positive effect on yield rate. But the real fact is that these two results are not contradictory because through irrigation crops are provided water according to their requirement, while rainfall being a natural and uncontrolled variable may not be able to provide according to the requirement. If there is an excessive rainfall a negative impact of it on yield rate may occur and probably this is the case for West Bengal. The coefficient of per hectare working capital for the principal crop is positive for all and significant for all but first specifications (1.30E-02 and significant at 5 percent level in the second specification), (9.38E-03 and significant at 10 percent level in the third specification), (1.53E-02 and significant at 1 percent level for the fourth specification) and (1.35E-02 and significant at 5 percent level in the fifth specification). This suggests that the yield rate of principal crops is positively associated with per hectare working capital for the principal crop in West Bengal. In this case, for one rupee increase in working capital per hectare, the production per hectare increases by 0.0094 to 0.013 kilograms in West Bengal. From the estimated results in the second specification, we observed that the coefficient of total chemical fertilizer (sum of nitrogen, phosphate, and potash) is positive (3.69E-03) and significant at the 1 percent level. This suggests that for an increment of one tonne in total chemical fertilizer in principal crop there will be an increasing impact on the production of principal crops per hectare by 0.0037 kilograms in West Bengal. When only nitrogen is taken into account as chemical fertilizer, we find that the coefficient of nitrogen is also positive (7.25E-03) and significant at 1 percent level (third specification) which suggests that the yield rate of principal crops increases by 7.25E-03 kilogram per hectare with a one-tonne increase in nitrogen use in the production of principal crops in West Bengal. In addition, when the only phosphate is taken into account as chemical fertilizer, we see that the coefficient of phosphate is also positive (1.11E-02) and significant at 1 percent level (fourth specification) which suggests that the yield rate of principal crops increases by 1.11E-02 kilogram per hectare with a one-tonne increase in phosphate in West Bengal. Finally, when only potash is taken into account as chemical fertilizer, we observe that the coefficient of potash is also positive (1.32E-02) and significant at 1 percent level (fifth specification) which suggests that the yield rate of principal crops increases by 1.32E-02 kilogram per hectare with a one-tonne increase in potash in West Bengal.
5.2. Marginal and Partial (Orthopartial) Significance of Chemical Fertilizer
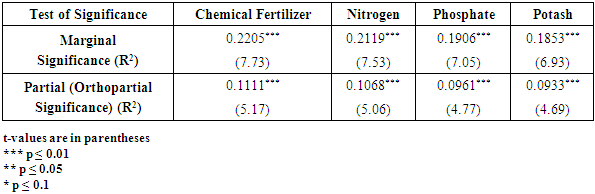
Calculation Procedure of Marginal Significance of Chemical FertilizertCF = 7.726671t2 = 59.70144653DF = {216 – (4+1)} = 211MSCF (R2) = t2/ (t2+DF) = {59.70144653/ (59.70144653 + 211)} = 0.220544Calculation Procedure of Partial (Orthopartial) Significance of Chemical Fertilizer: R2New = 0.607277858R2Old = 0.496159PSCF (R2) = (R2New - R2Old) = (0.607277858 - 0.496159) = 0.111119DF = (216 – 2) = 214t = √ {R2DF/ (1- R2)} = √ {(0.111119 * 214)/ (1- 0.111119)} = 5.172243In a similar manner the marginal and partial (orthopartial) significance of all explanatory variables can be calculated.From table 3 it is observed that chemical fertilizer significantly marginally explains the yield rate of the principal crop by 22.05 percent while it significantly partially explains only 11.11 percent. This proves the first case mentioned in section 2 suggesting that chemical fertilizer has a very significant role in determining the variability of yield rate of the principal crop in West Bengal. Now, chemical fertilizer is divided into three broad categories viz. nitrogen, phosphate, and potash and also try to examine whether they have any significant marginal as well as partial explanatory power in explaining the yield rate of the principal crop in West Bengal or not. From the estimated results given in table 3, it is also seen that nitrogen can significantly marginally explain the yield rate of the principal crop by 21.19 percent while it can significantly partially explain only 10.68 percent. In addition, phosphate can significantly marginally explain the yield rate of principal crops by 19.06 percent while it can significantly partially explain only 9.61 percent. Similarly, potash can significantly marginally explain the yield rate of principal crops by 18.53 percent while it can significantly partially explain only 9.33 percent. These also prove the first case mentioned in section 2 suggesting that nitrogen, phosphate, and potash have an incredibly significant individual role in determining the variability of yield rate of principal crops in West Bengal. Table 3. Estimated results of Marginal Significance and Partial (Orthopartial) Significance of different chemical fertilizers in explaining yield rate of principal crop in West Bengal
 |
| |
|
5.3. Marginal and Partial (Orthopartial) Significance of Other Considerable Factors
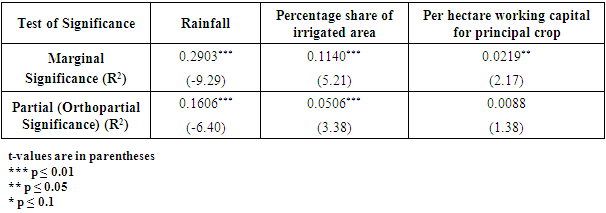
From table 4 it is observed that, rainfall significantly marginally explains yield rate of principal crop by 29.03 percent while it significantly partially explains 16.06 percent. Similarly, percentage share of irrigated area significantly marginally explains yield rate of principal crop by 11.40 percent while it significantly partially explains only 5.06 percent. These prove the first case mentioned in section 2 suggesting that rainfall and percentage share of irrigated area have significant role for determining the variability of yield rate of principal crop in West Bengal.Table 4. Estimated results of Marginal Significance and Partial (Orthopartial) Significance of other considerable factors in explaining yield rate of principal crop in West Bengal
 |
| |
|
On the other hand, per hectare, working capital for the principal crop can only significantly marginally explain the yield rate of the principal crop by 2.19 percent but not partially. This proves the second case mentioned in section 2 suggesting that per hectare working capital for the principal crop has a significant marginal role for determining the variability of the yield rate of the principal crop but has not any partial role.
6. Conclusions
This article has tried to establish that an explanatory variable should be treated as partially significant if it has not only a marginal but also a partial (better orthopartial) explanatory power for explaining the variability of the explained variable. From the estimated results of our work it is observed that after duly controlling for other relevant variables, total chemical fertilizer has significant marginal and partial explanatory power for increasing the yield rate of principal crops in West Bengal. From the results, it is also seen that three broad types of chemical fertilizer viz. nitrogen, phosphate, and potash used in agriculture in West Bengal have also significant marginal and partial explanatory powers for increasing the yield rate of principal crop. According to the existing literature on econometrics, chemical fertilizer, when considered with other relevant explanatory variables, can partially explain the variability of yield rate of the principal crop in West Bengal by 22.05 percent. But as suggested by Mondal (2008) this is the pseudo partial (better marginal) explanatory power of the variable. The true partial explanatory power of the variable as obtained from the squared orthopartial correlation is 11.11 percent.
Appendix
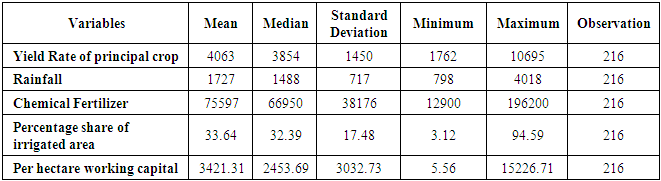
A-Table 1. Summary Statistics of All Variables
 |
| |
|
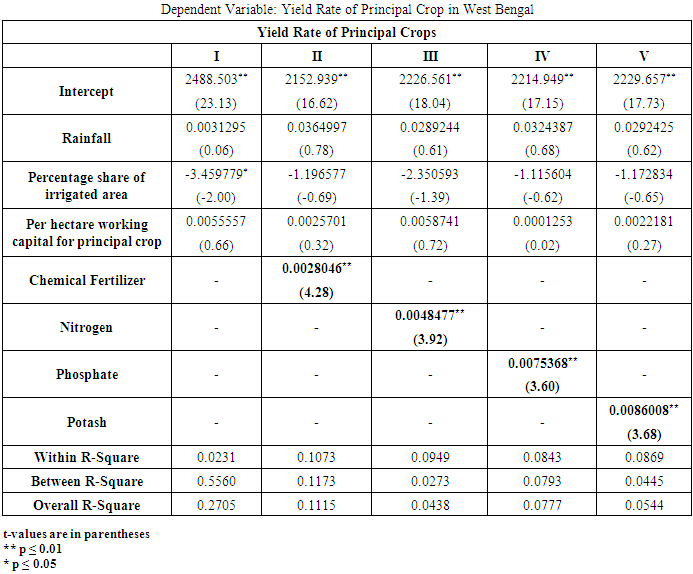
Like ordinary least square results for all specifications now we have to test whether chemical fertilizer has any significant role in the yield rate of principal crops in West Bengal or not in panel regression for robustness checking. A-Table 2 reports the panel regression (Fixed Effect Model) results of the effect of various types of chemical fertilizer and also total chemical fertilizer along with other relevant factors on the yield rate of principal crops in West Bengal. From A-Table 2 it seems that total chemical fertilizer has a significant positive role in explaining the yield rate of principal crops in West Bengal. In addition, nitrogen, phosphate, and potash have also a significant positive role in explaining the yield rate of principal crops in West Bengal. A-Table 2. Panel Regression Results (Fixed Effect Model)
 |
| |
|
References
| [1] | Amemiya, T. (1985). Advanced Econometrics. Oxford: Basil Blackwell. |
| [2] | Anderson, T. (1972). An Introduction to Multivariate Statistical Analysis. New Delhi: Wiley Eastern Pvt. Ltd. |
| [3] | Boyce J K (1987). Agrarian Impasse in Bengal: Institutional Constraints to Technological Change’. Oxford University Press, New York. |
| [4] | Chattopadhyay A K, Das P S (2000). Estimation of Growth Rate: A Critical Analysis with Reference to West Bengal Agriculture. Indian J. Agric. Econ. 55(2) April- June. |
| [5] | Davidson, R. and MacKinnon, J.G. (1993). Estimation and Inference in Econometrics. New York: Oxford University Press. |
| [6] | Fomby, T. B., Hill, R. C. and Johnson, S. R. (1984). Advanced Econometric Methods, New York: Springer-Verlag. |
| [7] | Ghosh B K, Kuri P K (2005). Changes in Cropping Pattern In West Bengal during 1970-71 to 2000-01. IASSI Quarterly, 24(2). |
| [8] | Ghosh B K, Kuri P K (2007), ‘Agricultural Growth in West Bengal from 1970-71 to 2003-04: A Decomposition Analysis’, ICFAI J. Agric. Econ 4(4), October 2007. |
| [9] | Goldberger, A. S. (1964). Econometric Theory. New York: John Wiley & Sons, Inc. |
| [10] | Greene, W. H. (2000). Econometric Analysis. 4th ed. Englewood Cliffs, NJ: Prentice Hall International, Inc. |
| [11] | Hammad Badar, Abdul Ghafoor and Sultan Ali Adil (2007). Factors Affecting Agricultural Production of Punjab (Pakistan). Pak. J. Agri. Sci Vol. 44(3). |
| [12] | Jojnston, J. and DiNardo, J. (1997). Econometric Methods. 4th ed. New York: The Mc-Graw Hill Companies, Inc. |
| [13] | Kannan E, Sundaram S (2011). Analysis of Trends in India’s Agricultural Growth. ISEC, Bangalore. |
| [14] | Kaur R, Malhi M, Kiran G S (2015). Analysis of trends in area, production and yield of important crops of India. IJAAR, Vol. -7, No. 1, P. 86-92 (2015). |
| [15] | Kayet A and Dolai R (2017). Factors affecting food grains production in West Bengal: A panel data analysis in 18 districts during 2000-01 to 2011-12. International Research Journal of Business and Management. Vol. X, Issue No. 09, pp. 59-68. |
| [16] | Kmenta, J. (1986). Elements of Econometrics. New York: The Macmillan Publishing Company. |
| [17] | Maddala, G. S. (1989). Introduction to Econometrics. New York: The Macmillan Publishing Company. |
| [18] | Majumdar K, Basu P (2005). Growth Decomposition of Food grains Output in West Bengal: A District Level Study. Indian J. Agric. Econ., 60(2). |
| [19] | Mondal, D. (2008). On the Test of Significance of Linear Multiple Regression Coefficients. Communication in Statistics –Simulation and Computation, Taylor & Francis Group, 37: 713-730. |
| [20] | Rao, P. and Miller, R. (1971). Applied Econometrics. Wadsworth Publishing Company, Inc. |
| [21] | Saha A, Swaminathan M (1994). Agricultural Growth in West Bengal in the 1980s: A Disaggregation by Districts and Crops. Economic and Political Weekly Vol. 29, No. 13 (Mar. 26, 1994), pp. A2-A11. |

 Abstract
 Reference
 Full-Text PDF
 Full-text HTML