Alka Sabharwal1, Babita Goyal2, Rita Jain3
1Associate Professor, Department of Statistics, Kirori Mal College, University of Delhi, Delhi, India
2Associate Professor, Department of Statistics, Ramjas College, University of Delhi, Delhi, India
3Assistant Professor, Department of Statistics, Ram Lal Anand College, University of Delhi, Delhi, India
Correspondence to: Babita Goyal, Associate Professor, Department of Statistics, Ramjas College, University of Delhi, Delhi, India.
| Email: |  |
Copyright © 2020 The Author(s). Published by Scientific & Academic Publishing.
This work is licensed under the Creative Commons Attribution International License (CC BY).
http://creativecommons.org/licenses/by/4.0/

Abstract
Cognitive decline is prevalent in older adults and is associated with decline in performance of instrumental activities which adversely affects the wellbeing of older adults. The aim of this study is to build a model that would estimate the benefit from the score based 21 days’ workshop in terms of their cognitive abilities of old adults, suffering from mild cognitive disorders. A truncated binomial distribution with missing zero and one classes, having parameters (ni,p), ni known, is fitted to estimate the unknown parameter p, by the methods of maximum likelihood and simulation. The data was collected on 71 subjects residing in 5 old age homes in Delhi, India, using Mini Mental Status Examination tool before and after a score-based 21 days cognitive behaviour therapy workshop. The probability of benefiting from the workshop is estimated only for those test attempts which were more than ten percent completed. The maximum likelihood and simulation estimates of pwere 0.838552 and 0.835967 respectively. Our Zero One Truncated Binomial Distribution model computed the probability of benefit (more than or equal to 0.5) from the workshop and found that by using the estimated values of p from the methods of maximum likelihood estimation and simulation, out of 71 subjects 51 (71.83%) and 53 (74.65%) were benefitted respectively. Our study concluded that there are positive effects of psycho-social interventions on quality of life and mental health.
Keywords:
Cognitive Behaviour Therapy, Mini Mental Status Examination, Old Age Homes, Simulation, Zero One Truncated Binomial Distribution
Cite this paper: Alka Sabharwal, Babita Goyal, Rita Jain, Truncated Binomial Model to Estimate the Effect of Interactive Workshop on Cognitive Abilities of Elderly People Staying in Old Age Homes in Delhi, India, International Journal of Statistics and Applications, Vol. 10 No. 4, 2020, pp. 103-112. doi: 10.5923/j.statistics.20201004.03.
1. Introduction
Living longer does not translate to living well as the increased life expectancy does not translate to improved quality of life, due to lifestyle-related chronic non-communicable diseases and their sequel. Age related cognitive decline is a common cognitive disturbance in the elderly and is characterized by poor performance in memory, processing speed, visuospatial skills, language, and executive functioning. Several studies have shown that cognitive decline due to aging is related to disability in daily living activities and is considered as a risk factor for progression to dementia [1]. Cognitive decline in the elderly also affects quality of life, which tends to become poorer as deterioration increases and memory complaints become prevalent [2]. This is a strong predictor for chronic disease progression, and the subsequent mortality. It is projected that around one in five persons from low- and middle-income countries are going to be above 60 years of age by 2050. In countries like India, there is one elderly person for every 10 working-age persons, but this ratio will increase closer to one elderly for every 3 working-age population by 2100 [3]. With the increase in the elderly population, there would be a proportionate rise in elderly adults suffering from dementia as the prevalence of dementia in the elderly is 5 -7%. In absolute terms, there are about 35.6 million people living in the world currently with dementia and 7.7 million new cases of dementia add every year with estimated highest projections in South Asian nations such as India and China [4].Due to increased life expectancy there has been an exceptional increase in the number and proportion of older adults which along with rapid increase in nuclear families and contemporary changes in psychosocial matrix and values often compel this segment of society to live alone or in old age homes. Lack of psychosocial and emotional support has made them sink into depression and loneliness [5]. In a cross-sectional study by Nagaraj, A. K. M. et al. (2012), based on the psychiatric morbidity and quality of life of elderly people belonging to community and old age homes, random samples of size 50 from each group were selected and assessed on Mini Mental Status Examination (MMSE), Informant Questionnaire on Cognitive Decline in Elderly (IQCODE), Brief Psychiatric Rating Scale (BPRS) and Quality of life visual analogue scale. On comparison their study concluded that there was no significant difference in the total scores on MMSE, IQCODE and quality of life scale among the groups [6].Several studies show an improvement in the cognitive abilities after cognitive interventions. Carrion et al. (2018) established the importance of cognitive intervention for treating geriatric persons experiencing dementia by demonstrating the positive impact of skills training trials and mixed trials on decline of mental faculties [7]. Similarly, Kyunghwa Jo et al. (2018) too have advocated the benefits of cognitive intervention in senior citizens with or without dementia, at least in the short term and reported a comparatively greater improvement in mental faculties in the dementia group [8].The truncated distributions are quite effective where random variable is restricted to be observed on some range and these should not get into the estimation procedure. In practical life problems, truncation arises in many fields, such as industry, biology, hydrology, reliability theory and medicine. Dwivedi, A. K. et al. (2010) predicted the number of nodes involved in breast cancer patients by applying various truncated and non-truncated distributions. Their study suggested that non truncated distributions in the modelling of the involved nodes contained over-dispersion, not only due to unobserved heterogeneity but also due to excessive negative nodes (zeros) thus highlighting the efficacy of truncated models [9]. Shanker, R. et al (2015) tested the suitability of Zero-truncated Poisson distribution (ZTPD) and Zero-truncated Poisson-Lindley distribution (ZTPLD) in describing the neonatal deaths as well as of infant and child deaths experienced by mothers in Sri Lanka (Meegama)and India (Kadam Kuan, Patna). They found that fittings of ZTPD and the ZTPLD give closer fits in almost all cases except for the number of mothers of the estate area who were having at least one live birth and one neonatal death [10]. Grover G. et al. (2010) applied zero truncated binomial distribution with parameters  to obtain the probability of occurrence of Nephropathy of type -2 diabetic patients with minimum 5 years diabetic history [11].Simulation is the process of generating data artificially by pseudo-random sampling from known probability distributions. The process is used very frequently in medical data, to evaluate new methods and to compare alternative methods, particular when the data is scarce [12].The present study dealt with the psychiatric health of elderly adults, suffering from mild cognitive disorders in terms of their cognitive abilities. Here, the variable of interest was taken as ‘the number of days the test score was 7 or more’ and was considered to be a “success”. The data set was truncated for ‘zero’ and ‘one’ values of the random variable and the truncated part of the data was modelled using truncated binomial distribution missing zero and one classes (ZOTBD) with parameters,
  , where
  the number of days the test was undertaken by the
  subject and was at least 10% completed, was known. The number of successes for the
  subject was denoted by
  and p was the probability of success, which was unknown and was, estimated using the methods of maximum likelihood estimation (MLE) and simulation. Variances of both the estimators were computed. The 95% confidence intervals of p under both the methods were also compared. The p estimators obtained from both the methods were used to obtain the probability of benefit from the workshop. The data consisted of information on 96 subjects collected from 5 old age homes who were diagnosed with mild cognitive disorders as per Mini Mental Status Examination (MMSE). A 21- days cognitive behaviour therapy (CBT) workshop was conducted to study the impact of CBT on the cognitive abilities of the subjects. These elderly adults were subject to some interactive activities and games and then were given some elementary problems on arithmetic, linguistics; puzzles and quizzes. Scores were awarded to the participants after each test for all the 21 days. This is the first study to the best of our knowledge in which truncated distribution has been applied to study the effect of an interactive workshop on the cognitive abilities of people staying in old age homes. This study clearly points out the number of times the score value, if crossed the cut-off value, may lead to improvement in psychiatric health. Besides introduction this paper includes three more sections. In section 2 the model is introduced. Section 3 is about the results and discussion of the model on real data and conclusions are presented in section 4.
2. Model
The model is explained with the help of Figure 1 where X-axis denotes the subject’s identification number, and Y-axis denotes the value of scores. The total number of lines from X-axis for any subject represents the number of times the test was attempted and the height of each line indicates its test score value. The red line/s in the Figure 1 for the respective subject represent those attempts where the test attempted was less than ten percent and therefore these attempts have not been included in the total number of the attempts. The number of black lines which crossed the cut-off value for the  subject is the number of attempts for that subject. Based on the number of successful attempts we wish to estimate the probability of benefit from the workshop. As the aim is to assess the positive effect of the workshop therefore for all those subjects where each day score is less than cut-off value or crossed the cut off value only once have been truncated, therefore from the Figure 1 it is clear that subjects (Pi; i =5,30,50) will not be included.
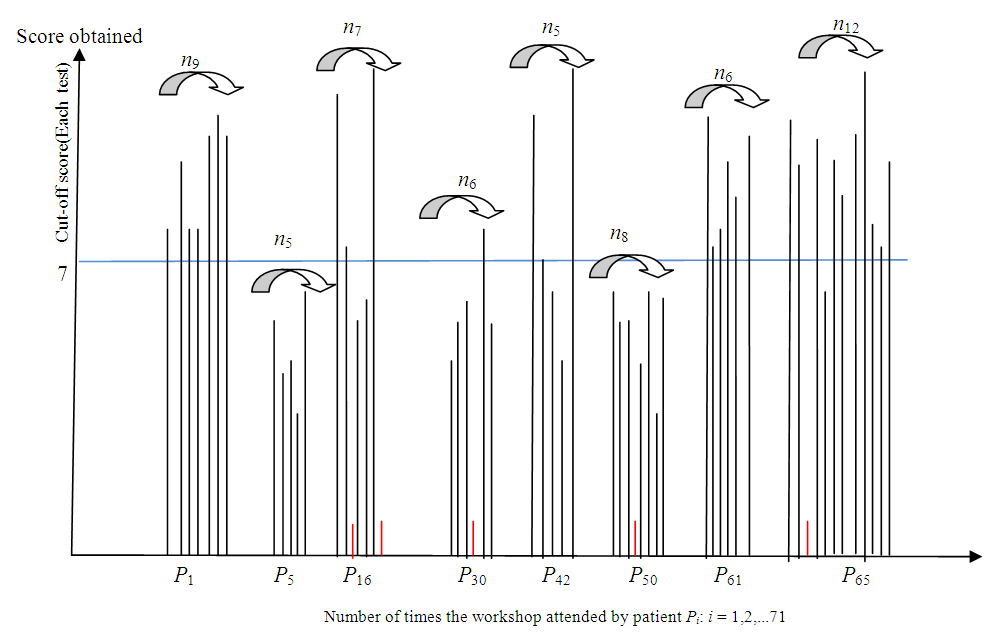 | Figure 1. Truncated Binomial Model |
2.1. Truncated Binomial Distribution Model
Truncated samples from discrete distributions arise when in the count, at least one value is not considered. Let  are independently distributed random variables following
  . Then probability mass function for the
  patient, is given by
 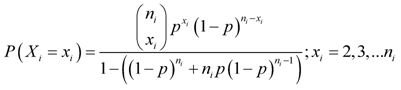 | (1) |
where  , the number of days the test was undertaken by the
  subject and was at least 10% completed, is known. Score
  is considered as a success out of everyday score of 15,
  denotes the number of successes and p is the probability of success. The parameter p is unknown and is estimated using maximum likelihood method and simulation.
2.1.1. Method of Maximum Likelihood Estimation (MLE) to Estimate the Parameter p
The likelihood function for estimating p is given by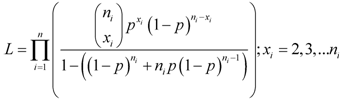 | (2) |
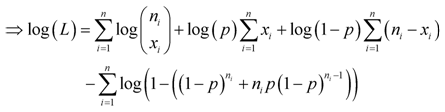 | (3) |
Differentiating  with respect to p and then, equating the derivative to zero, we have
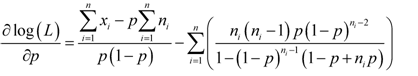 | (4) |
 | (5) |
The MLE  of p is obtained by solving the above equation by the method of iteration.
2.1.2. 95% Confidence Interval Based on MLE of p
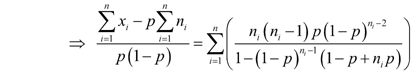
Differentiating (5) again with respect to p, we have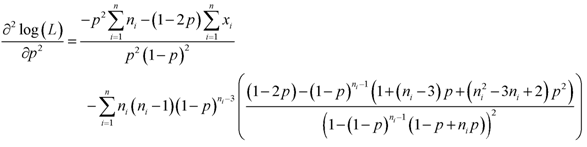 | (6) |
Then, variance of  is given by
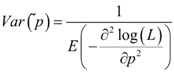 | (7) |
where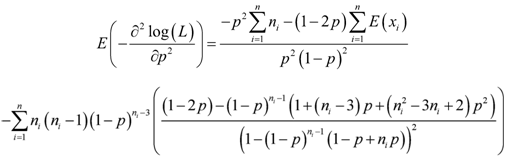 and
and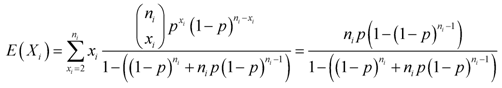 | (8) |
Finally,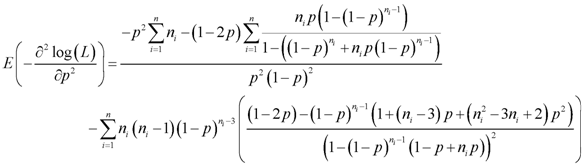 | (9) |
Then, 95% confidence interval (CI) for p is 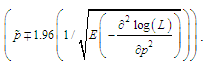
2.2. Estimation of p through Simulation
Simulation is the process of generating data artificially by pseudo-random sampling from known probability distributions. A simulation study has been carried out in order to test the proposed model. Algorithm applied for estimating p is given as follows: (i) Starting with the minimum value of  and
and  (MLE), simulate first sample of 100 truncated binomial random numbers.(ii) Compute the frequency distribution of this generated random sample.(iii) Repeat steps (i) and (ii) for every distinct value of
  .(iv) Combine all the simulated data and form the frequency distribution.The flow chart in Figure 2 describes the simulation algorithm.
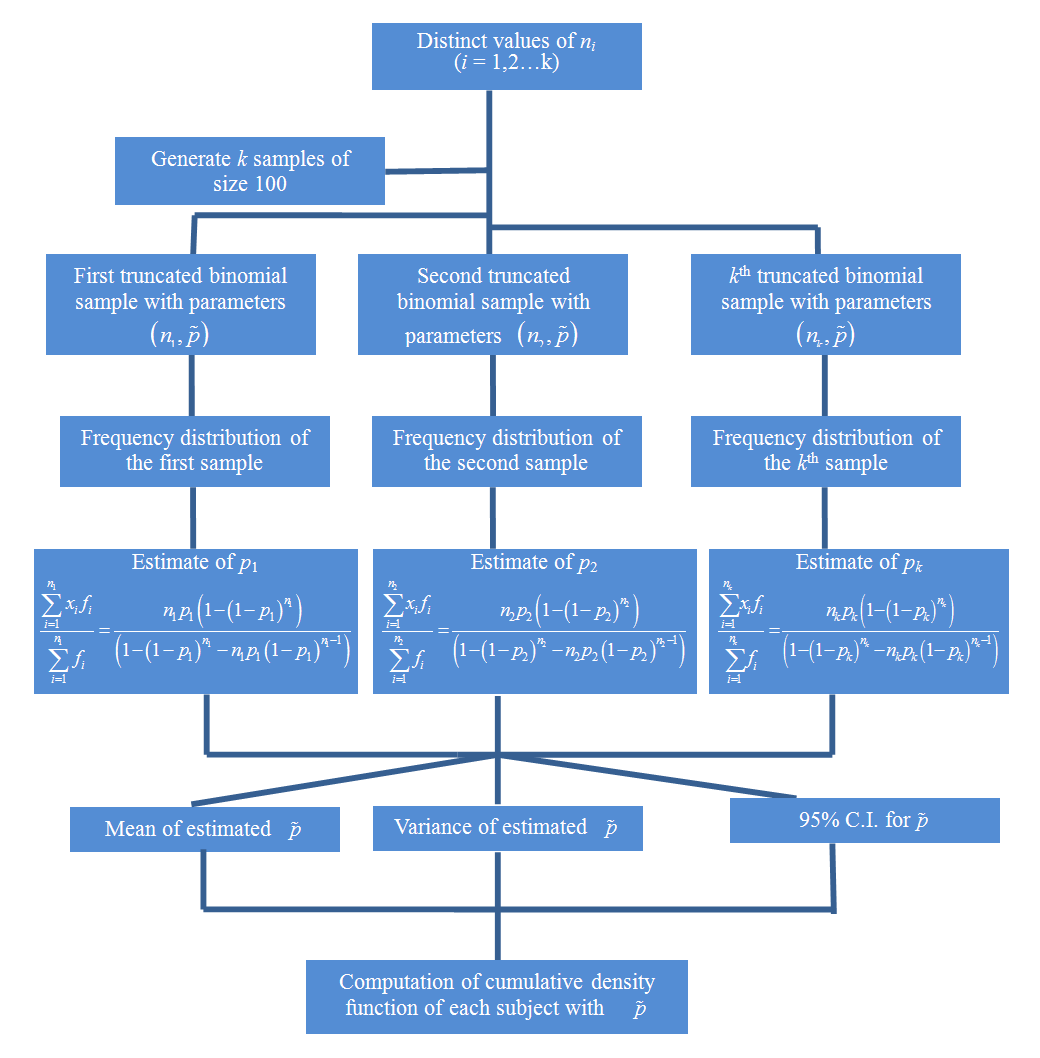 | Figure 2. Simulation Algorithm |
3. Results and Discussions
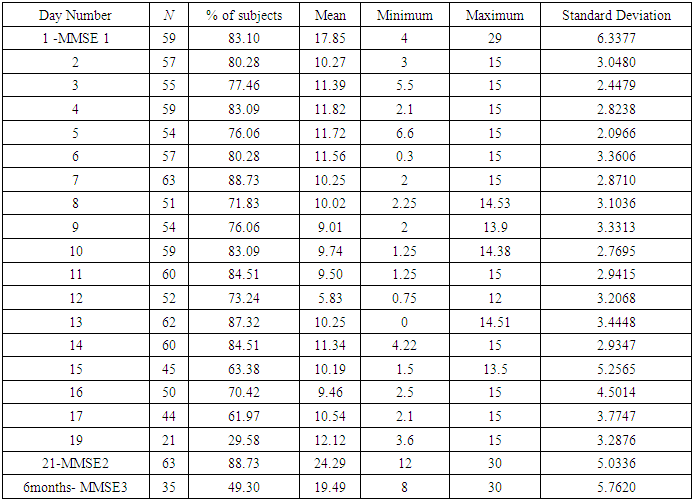
Cognitive decline adversely affects the wellbeing of older adults and is a form of intellectual disability [13]. However, very little effort has been made to develop a model of health and social care in tune with shifting of adults from their own homes to old age homes. This study was conducted by collecting data on 96 subjects from 5 old age homes that were diagnosed with mild cognitive disorders as per MMSE. The mean age of the subjects was 74.6 years. Out of these 96 subjects, 27 were males and 69 were females. Based on the MMSE scores obtained by the subjects, it was decided to conduct a CBT workshop as intervention tool. Appropriate permissions were taken from the authorities of each old age home. A 21- days CBT workshop was conducted to study the impact of CBT on the cognitive abilities of the subjects. During the workshop, each day 90 minutes sessions were conducted. Each session was divided into two parts: the first part was an interactive session in which some entertaining activities were done. In the second part the subjects were given some elementary problems on arithmetic, linguistics, puzzles and quizzes and scores were awarded to the participants after each test. The willingness of subjects to join or not to join the workshop (any day) was honoured. In each old age home approximately 25-27% of the subjects chose not to attend the workshop and hence they were excluded. Each day test scores were scaled down to 15 and the number of times score value for the  subject crossed the score 7 (cut off value) was recorded in respective test. The outcome of the workshop was measured through the scores of each test and also through a second MMSE conducted at the end of the workshop. A third MMSE was conducted six months after the workshop.The descriptive statistics of all the three MMSE scores and the day wise progression of the 71 subjects who attended the workshop are given in Table 1. The first column corresponds to the respective day of the workshop in respective old age home. The second column is denoting the number of subjects who participated on that particular day. Columns 3, 4, 5, 6 and 7 are respectively denoting the day wise valid proportion of the participants, the mean score, the minimum and the maximum scores and the standard deviation of the scores.
Table 1. Day-wise Descriptive Statistics of Scores of 71 Subjects
 |
| |
|
The figure given below is a pictorial representation of the column 2 in Table 1 above. Here ‘Present’ is the number of subjects who attended the second part of the workshop/ MMSE on a particular day.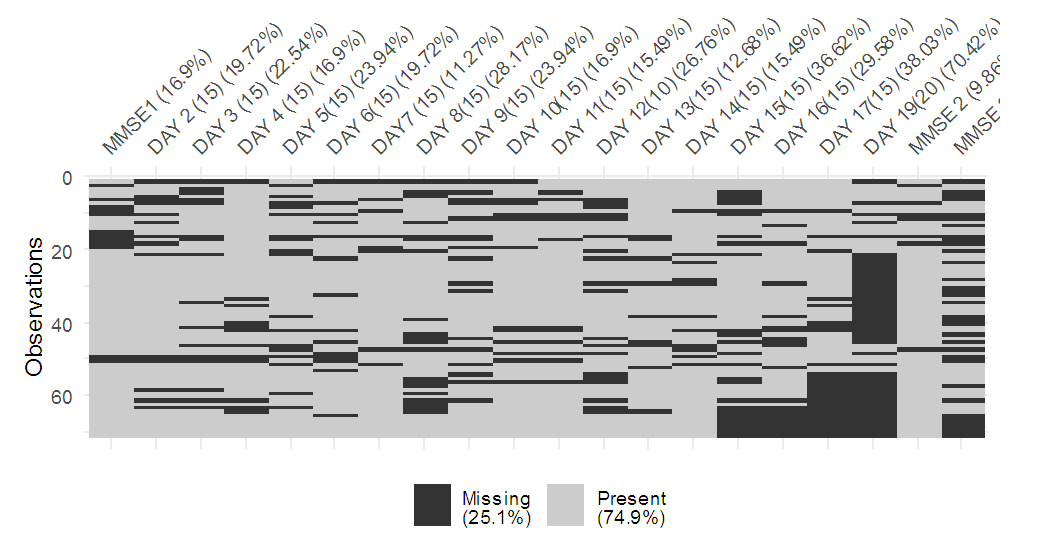 | Figure 3. Day wise Proportion of Subjects who attended the Workshop on a Particular Day |
3.1. Estimated Values of p, Variances and 95% C.I. by MLE and Simulation methods
When the scores follow  , where
  known and p was unknown, substituting the values of the total number of times the test was attempted and the total number of times the score value ≥7 ( success), respectively, in equation (5) for the subjects who belonged to group where the score was greater than cut-off value more than once, the MLE of p was obtained as
  . To estimate p by the method of simulation, we simulated 12 samples each of size 100 for each distinct value
  (number of times the workshop was attended by ith subject). Corresponding to each value of
  , the different values of pare estimated from each sample, by formulating the frequency distribution and using equation (7). Table 2 below depicted the simulated values corresponding to each value of
  . The last row in the Table 2 represented the estimated valueofp for each unique value of
  .
.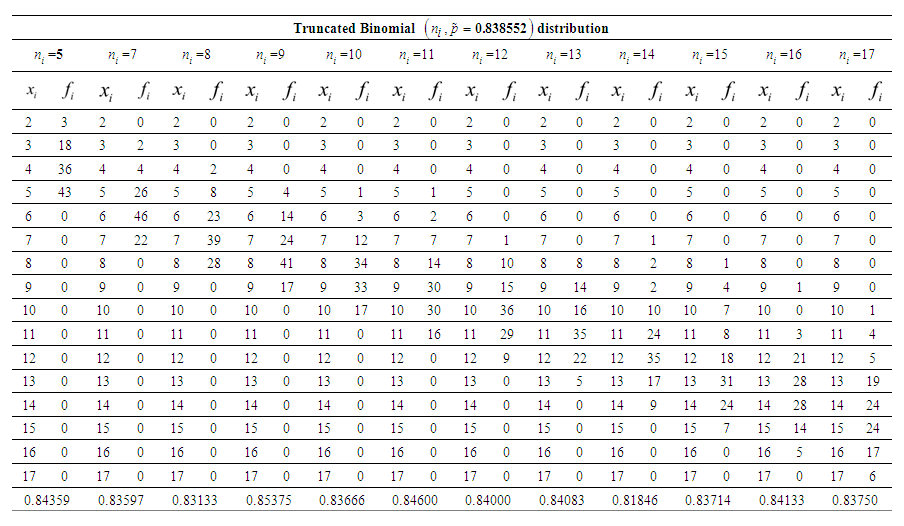 | Table 2. Simulated Values Corresponding to Each Distinct Value  of Number of Times the Workshop is attended by ith subject and estimated value of probability of success (p) for each of Number of Times the Workshop is attended by ith subject and estimated value of probability of success (p) for each  given in the last row of the Table given in the last row of the Table |
 | Table 3. The Frequency Distribution with Simulated Values.Expectations and Variances of the Estimates and Corresponding 95% Confidence Intervals from maximum likelihood estimation and simulation methods |
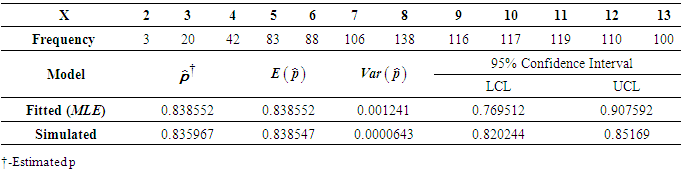
The frequency distribution obtained from the simulation study in Table 2 is presented in Table 3 above. The simulation estimate of p is  . The estimates of p,
  and 95% confidence intervals for p obtained by the methods of MLE and simulation are displayed in Table 3 above. The 95% Confidence interval of (p) from MLE is found to be wider i.e. (0.769512, 0.907592) as compared to (0.820244, 0.85169), obtained by simulation.
3.2. The Probability of Benefit from Workshop for Each Subject with ZOBTD Model
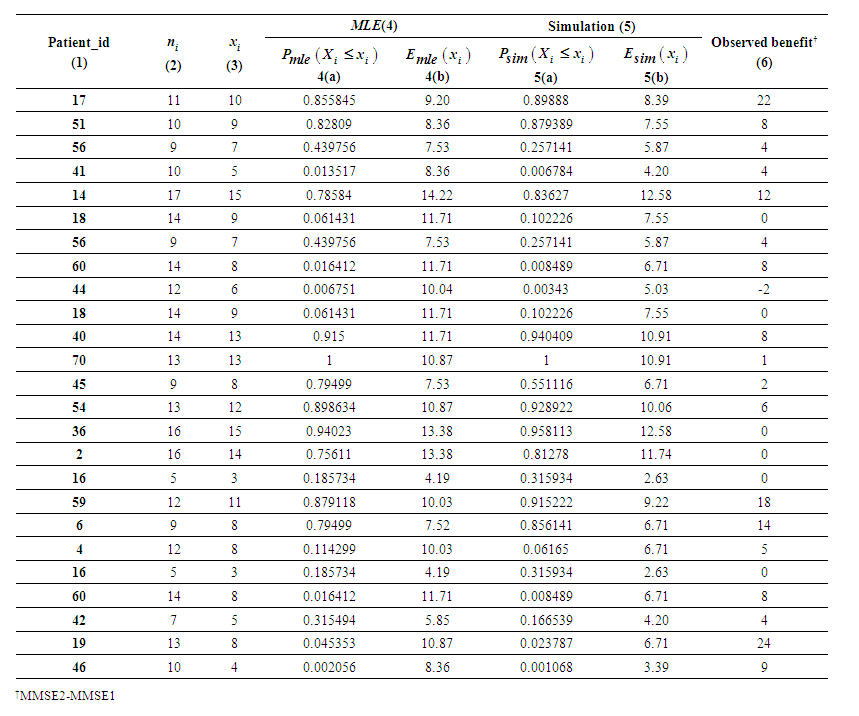 | Table 4. Probability Mass Functions and Expected Number of Successes using both the estimated values of p |
Based on the estimate of p obtained by MLE, the fitted model is found to be  known. For the model fitted on the random variable defined as the number of times the score is above the cut-off value out of the number of times the test is attempted, probability mass function and cumulative probability function for each subject is calculated. For each subject we counted the number of times the test score value crossed the cut-off value for the ith patient, and obtained
  as is shown in Figure 1. We obtained
  or probability of occurrence of benefits from the workshop and mean number of successes for all the 71 subjects. Using simple random sampling without replacement, 25 subjects are selected and the results are depicted in Table 4 above. Based on the estimated values of p from the methods of MLE and simulation, it is found that out of 71 subjects 51 (71.83%) and 53 (74.65%) respectively benefited from the workshop. From ZOTBD for all these subjects, the probability of benefit from the workshop was found to be more than or equal to 0.5. Our ZOTBD model results are found to be consistent with the MMSE scores, where 54 (76.06%) out of 71 had higher score in second MMSE test which was conducted after the workshop. But the results are found to be different from MMSE scores when a
  model was applied which estimated that 47 subjects (66.2%) benefitted from the workshop. Hence the use of truncated distribution is justified.
4. Conclusions
Urbanization, modernization, industrialization, and globalization have resulted in transformations in the structural and functional norms of family. These socio-demographic changes, sometimes force elderly adults to shift from their own place to some institutions/old age homes [14]. These emotional reasons and other factors make older adults increasingly vulnerable to mental health problems and their undesirable effects [15]. Cognitive decline is prevalent in older adults and it can be handled with psychosocial interventions and health education with a focus on social aspects. The psychosocial intervention viz. CBT is effective is concluded here with ZOTBD model for the elderly adults suffering from mild impairment of cognitive abilities. Our findings are consistent with Forsman, A. K., et al. (2011) study where they had used physical exercise, skill training, reminiscence, social activities, group support and multi-component interventions as intervention tool and concluded that psychosocial interventions had a positive effect on quality of life and positive mental health [16]. We also observed that the effect of work-shop reduces as time lap increases as it was observed by MMSE 3 scores which were taken after a gap of six months, once the intervention was discontinued. The scores were much less as compared to MMSE2 scores.This study provides a flexible and useful approach based on truncated distributions for estimating the benefit when all given information about the health status of an elderly adult is extracted from the data. The truncated distribution is generally preferred under this situation. The study indicates that the proposed model can contribute meaningfully in dealing with other health complications as well. This study also highlights the usage of simulation for model validation. However, our study population has been confined to a certain region and therefore may not be representative of the entire old age homes of the country.
References
| [1] | G. Montoya-Murillo, N. Ibarretxe-Bilbao, J. Peña and Ojeda N,” Effects of cognitive rehabilitation on cognition, apathy, quality of life, and subjective complaints in the elderly: a randomized controlled trial”, The American Journal of Geriatric Psychiatry, vol. 28, pp. 518-529, 2020. |
| [2] | F. J. Kaci and F. R.Scogin, “Training to Enhance Adult Memory (TEAM): an investigation of the effectiveness of a memory training program with older adults”, Aging & Mental Health, vol. 14(3), pp. 364-373, 2010. |
| [3] | D. E. Bloom and D. L. Luca, “The global demography of aging: facts, explanations, future. In Handbook of the economics of population aging” North-Holland, vol. 1, pp. 3-56, 2016. |
| [4] | C. P. Ferri, M. Prince, C. Brayne, H. Brodaty, L.Fratiglioni, M.Ganguli et al., “Global prevalence of dementia: a Delphi consensus study”, The Lancet, vol.366, pp. 2112-2117, 2005. |
| [5] | R. Desai, D. Abraham, D. G. Harshe, A.Ramakrishnan, R. Cholera and S. S. Kale, “ A study of depression, perceived loneliness, cognitive function and independence in daily activities in home and institution based older people: A cross sectional comparative study”, Journal of Geriatric Mental Health, vol. 3, pp. 140- 144, 2016. |
| [6] | A. K. Nagaraj, J. Mathew, R. B. Nanjegowda, S. M. Majgi and S. M.Purushothama, “Psychiatric morbidity among elderly people living in old age homes and in the community: A comparative study”, Online Journal of health and allied sciences, vol. 10, pp. 1-5. |
| [7] | C. R. Carrion, F. Folkvord, D. T. Anastasiadou and M. M. Aymerich, “Cognitive therapy for dementia patients: a systematic review”, Dementia and Geriatric Cognitive Disorders, vol. 46, pp. 1-26, 2018. |
| [8] | K. Jo, J. H. Jhoo, Y. J. Mun, Y. M. Kim, S. K. Kim, S. Kim, S. H. Lee andJ. W. Jang, “The effect of cognitive intervention on cognitive improvement in patients with dementia”, Dementia and neurocognitive disorders, vol. 17, pp. 23-31, 2018. |
| [9] | A. K. Dwivedi, S. N. Dwivedi, S.Deo, R. Shukla and E.Kopras, “Statistical models for predicting number of involved nodes in breast cancer patients”, Health, vol.2, pp. 641-651, 2018. |
| [10] | R. Shanker, F. Hagos, S. Sujatha and Y. Abrehe, “On zero-truncation of poisson and poisson-lindley distributions and their applications”, Biometrics & Biostatistics International Journal, vol. 2, pp. 1-4, 2015. |
| [11] | G. Grover, A. K. Gadpayle and A. Sabharwal, “Identifying patients with diabetic nephropathy based on serum creatinine under zero truncated model”, Electronic Journal of Applied Statistical Analysis, vol. 3, pp. 28-43, 2010. |
| [12] | P. T. Morris, R. I. White and J. M. Crowther, “Using simulation studies to evaluate statistical methods”, Tutorials in Biostatistics, pp. 1-33, 2017. |
| [13] | S. Menezes and T. M. Thomas, “Status of the Elderly and Emergence of Old Age Homes in India. International Journal of Social Sciences and Management”, vol.5, pp. 1-4, 2018. |
| [14] | R. Samuel, C. S. McLachlan, U. Mahadevan and V. Isaac, “Cognitive impairment and reduced quality of life among old-age groups in Southern Urban India: home-based community residents, free and paid old-age home residents”, QJM: An International Journal of Medicine, vol. 109, pp. 653-659, 2016. |
| [15] | S. C. Tiwari, N. M. Pandey and I.Singh, “Mental health problems among inhabitants of old age homes: A preliminary study”, Indian journal of psychiatry, vol.54, pp. 144-148, 2012. |
| [16] | A. K. Forsman, J.Nordmyr and K. Wahlbeck,” Psychosocial interventions for the promotion of mental health and the prevention of depression among older adults”, Health promotion international, vol. 26(suppl_1), pp. 85-107, 2011. |

 Abstract
 Reference
 Full-Text PDF
 Full-text HTML