-
Paper Information
- Paper Submission
-
Journal Information
- About This Journal
- Editorial Board
- Current Issue
- Archive
- Author Guidelines
- Contact Us
International Journal of Statistics and Applications
p-ISSN: 2168-5193 e-ISSN: 2168-5215
2020; 10(4): 77-84
doi:10.5923/j.statistics.20201004.01
Received: July 4, 2020; Accepted: August 5, 2020; Published: August 26, 2020

Modelling a Mixture of Diabetes Mellitus Herbal Treatment
 Abstract
 Reference
 Full-Text PDF
 Full-text HTML
Gladys Gakenia Njoroge
Department of Physical Sciences, Chuka University, Chuka, Kenya
Correspondence to: Gladys Gakenia Njoroge, Department of Physical Sciences, Chuka University, Chuka, Kenya.
| Email: |  |
Copyright © 2020 The Author(s). Published by Scientific & Academic Publishing.
This work is licensed under the Creative Commons Attribution International License (CC BY).
http://creativecommons.org/licenses/by/4.0/

Mixture designs are special cases of response surface designs with prediction and optimization as the main goals. When using a mixture of herbs, the most desirable interactions are those that can result in additional therapeutic benefits. The combined effect of the herbs can either be synergistic or antagonistic. In this study, a mixture experiment was set up involving three herbs: Cinnamomum verum, Azadirachta indica and Gymnema sylvestre that have been known to singly lower blood sugar level.The aim of the study was to obtain a prediction model for the change in blood sugar level resulting from given proportions of the three herbal components in the mixture. A simplex centroid design was employed in this experiment. The data obtained was divided into two sets: train data that took 75% and test data that formed the remaining 25% of the original data. The test data was used to fit a special cubic Scheffé model and the test data was used for testing the fitted model. R statistical software was used to analyse the data. The seven term special cubic model fitted the data fairly well but the tertiary blend was not statistically significant. The model was thus reduced to a six term model that was more suitable for prediction. The single herbs caused significant reduction in blood sugar level. However, the binary and tertiary blends had antagonistic activity. This study recommends that mixture experiments be used as a means to investigate reinforcement and counteraction effects among combined herbs.
Keywords: Mixture components, Herbal formula, Modelling, Diabetes mellitus
Cite this paper: Gladys Gakenia Njoroge, Modelling a Mixture of Diabetes Mellitus Herbal Treatment, International Journal of Statistics and Applications, Vol. 10 No. 4, 2020, pp. 77-84. doi: 10.5923/j.statistics.20201004.01.
Article Outline
1. Introduction
- Many product designs and industrial formulations involve mixtures. Mixture designs are special cases of response surface designs with prediction and optimization as the main goals. In mixture experiments, the measured response is assumed to depend only on the relative proportions of the ingredients or the components in the mixture and not on the amount of the mixture [1]. The mixture experiment has twofold purpose: to model the blending surface with some form of Mathematical equation and to find the “best mixture” using a well-defined response variable and an optimality criterion [2]. The unrestricted design region for mixture proportions is a simplex, a regularly sided figure of dimension
 with q vertices for q factors [2]. The simplex is a straight line when the factors are two; it is a triangle with three factors while with four factors it is a tetrahedron. The main considerations in relation to the exploration of a response surface over the simplex region include: choosing of a proper model to approximate the surface over the region of interest, the testing of the adequacy of the model in representing the response surface, developing a suitable design for collecting observations, fitting the model and testing the adequacy of fit [1]. Mixture models differ from the usual polynomials that are employed in response surface because the component proportions are constrained to sum up to one [1]. The constraint led to the Scheffé mixture models proposed in [3]. Scheffé mixture models were; the first-order, second-order, special cubic and the full cubic. In addition, [4] proposed the qth degree model. In literature, the Scheffé models are the most commonly used mixture models, by for example [1,2,5,6,7,8]. The reseachers [2,8] undertook a comparative study of the Scheffé linear model and what they referred to as slack-variable model. In another research, [9], a comparative study was undertaken of the Scheffé linear model, the Cox linear model and the component slope linear model. He concluded that the three models were mathematically equivalent and provided the same statistics for a given mixture experiment with the difference being in the interpretation of the coefficients.The term diabetes is derived from Latin and ancient Greek and literally means “a siphon” or “a passer through” [10]. This is based on the traditional belief that all the fluids consumed by those with the disease rapidly run through the body to be passed in urine thus causing polyuria [10]. The term mellitus comes from Latin meaning “honey-sweet” and it was added to diabetes since the urine of diabetic patients had a sweet taste [10]. Diabetes Mellitus (DM) is classified as a metabolism disorder and a chronic disease [11]. Diabetes mellitus (DM) is a multifaceted metabolic disorder of multidimensional aetiologies presenting in form of chronic hyperglycemia [12] This situation occurs when the body does not produce enough insulin, produces no insulin at all or has body cells that do not respond properly to the insulin the pancreas produces [13]. As a result, there is too much glucose build up in the blood and the excess glucose in the blood eventually passes out of the body in urine. This situation thus means that even though the blood has plenty of glucose in it, the body cells end up not getting it for their essential energy and growth requirements. For most patients with Diabetes Mellitus, several genetic and environmental factors contribute to the causation and progression of the disease and also its late complications [14]. According to [15,16,17] chronic hyperglycemia can lead to complications such as visual impairment, blindness, kidney disease, nerve damage, amputations, heart disease and stroke.Herbal extracts have been used for diabetes control for many centuries. WHO recognizes the increasingly important role that certain forms of herbal medicines play in healthcare and health sector globally [18]. Many traditional healers prefer using poly-herbal formulations than single herbs. They argue that life is chemically complex and so is the food consumed and as such, the medicines should also be chemically complex. In addition, they believe the different plants included in the herbal mixture may show evidence of synergistic activity [19]. When using combination therapy or herb-herb combinations, the most desirable interactions or expected outcomes are those that can result in additional therapeutic benefits [19]. The combined effect of the herbs can either be synergistic (positive, having an enhanced effect than that of the individual herbs) or antagonistic (negative, having a diminished effect than that of the individual herbs) [29].A number of experiments have been carried out in laboratories to test the potency of these remedies. [20] evaluated the effects of methanolic extracts of the bulbs of Garlic, Persian shallot and leaves of sage on the antioxidant enzymes in alloxan induced diabetic Wistar rats. The three extracts were tested separately and their activity compared with diabetic controlled rats. They used male rats weighing 200-250g. The herbs were extracted using 80% methanol. They concluded that the three extracts were beneficial in the control of diabetes by displaying noticeable antioxidant and hypolipidemic properties. [21] on the other hand, carried out an experiment to investigate the hepato-protective properties of combined extracts of Moringa oleifera and Vernoniaamygdalina in streptozotocin (STZ) induced diabetic Albino Wistar rats. Rats of both sexes weighing between 120 and 180g were used in the experiment. Equal portions of each extract were combined and used in one of the test groups. The herbs were extracted using 80% ethanol at room temperature. The combined extract significantly reversed diabetes in the rats by lowering the Blood Glucose Level (BGL) similarly to glibenclamide and insulin. They however did not check on the synergism of the two extracts nor compare the effect of the combined extract to the single extracts. Njoroge [22] carried out a screening experiment on a diabetes mellitus herbal formula composed of six herbs; Utica dioica, Moringa oleifera, Cinnamomum verum, Azadirachta indica, Momordica charantia and Gymnema sylvestre. They tested on the level of effect of each of the six herbal components in reducing the blood sugar level of alloxan induced diabetic albino wistar rats. The three most effective single herbs in their experiment were Cinnamomum verum, Azadirachta indica and Gymnema sylvestre. The six herb mixture had a lower effect on the blood sugar level than any of the single herbs. Risala et al. [23] evaluated the effect of a mixture of three medicinal plants on the level of blood glucose in normal and alloxan induced diabetic mice. They used thirty male mice which they randomly allocated to six test groups of five mice each. They concluded that the aqueous mixture used exhibited anti-diabetic as compared with each plant alone. Notably, majority of the experiments carried out on herbal extracts involve single herbs. Given that herbal mixtures are commonly used in practice, there is need to investigate the mixtures and compare their effectiveness to the single components as well as check on the synergism of the components in the mixtures. This study was designed to model the effect of a mixture of three herbal drug components namely: Cinnamomum verum, Azadirachta indica and Gymnema sylvestre on the level of blood glucose of alloxan induced albino wistar rats.
 2. Materials and Methods
- The experimental materials involved in this experiment were the Albino Wistar rats and three herbal components used as part of a drug formula for the control of the blood glucose levels of type 2 diabetic patients.
2.1. The Experimental Animals
- The experiment was carried out using Albino Wistar rats which were obtained from the Department of Zoological Sciences laboratory of Kenyatta University. These rats weighed between 100 and 140 gm and were 6-7 weeks old. Each group of rats used was composed of equal number of male and female rats. They were housed in a room with a 12 hour light and 12 hour dark cycle at 25 ± 3°C while being fed with standard rodent diet and water ad libitum.
2.1.1. Induction of Diabetes Mellitus
- Before the induction of diabetes, the rats were fasted for 16 hours. After the fasting process, the rats were given a single dose of intra-peritoneal injection of 150 mg/kg body weight composed of 5% alloxan monohydrate dissolved in freshly prepared citrate buffer (0.1 M, with a pH of 4.5). As per the recommendation by [24], three days after the dose was administered, the rats were tested for diabetes by the tail clip method.
2.1.2. BGL Testing
- To test the blood glucose level, a drop of blood was placed on a blood glucose test strip, GlucoPlusTM, after which the strip was inserted into a clinical GlucoPlusTM blood glucose meter. After 12 hours of fasting, a Fasting Plasma Glucose (FPG) test was carried out. FPG values ≥ 7.0 mmol/litre (126 mg/dl) was considered as provisional diagnosis of diabetes. To confirm diabetes, a 2-hour postload glucose ≥ 11.1 mmol/l (200 mg/dl) was used [25].
2.2. Dosage Calculation and Herbal Drug Preparation
- According to the clinical trial guidelines [26], the volume of the dosage is calculated while taking into consideration the weight of the animal, the dose rate and the concentration of the crude herbal drug. These were the guidelines followed in this experiment as represented in equation (1) below.
 | (1) |
 | (2) |
 | (3) |
 for rats was used as [26 and 28] recommended. The herbal drug treatment dosage rate that the groups of experimental rats received was obtained using the result in equation (2) and the formula in (3) as 411.11mg/kg. Equation (1) was employed to calculate the concentration of crude herbal drug to be used per preparation for the rats. The average rat weight was taken to be 120 gm.
  | (4) |
2.3. Design of the Experiment
- The experiment involved a mixture of three herbal drug components set up on a simplex centroid design. The herbal drug components were coded as: Cinnamomum verum coded as
 Azadirachta indica coded as
  and Gymnema sylvestre coded as
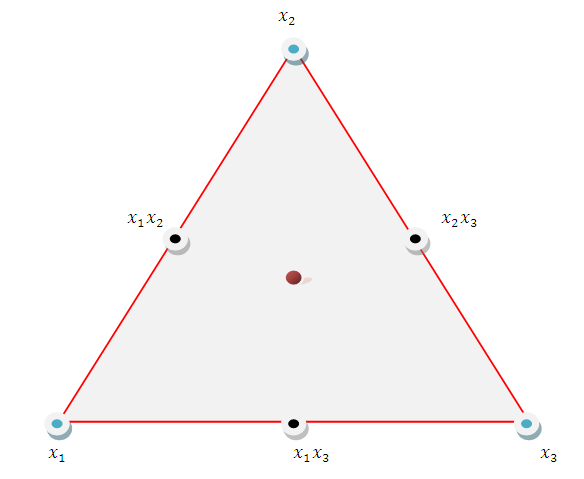 | Figure 2.1. A Simplex Centroid Design for the Three Herbal Drug Components |
2.4. Treatment Arrangement
- The three mixture components
 set up in a simplex centroid design had the following proportions;
 Table 2.1 below indicates the proportion of each mixture component at each of the seven design points.
|
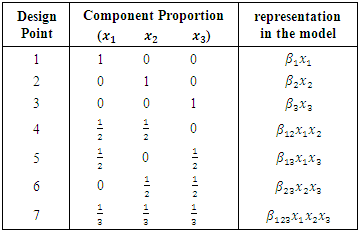
2.5. The Special Cubic Prediction Model
- The Scheffé special cubic mixture model was employed in this study and was fitted as below:
 Let
Let  be the estimates of the mixture model parameters
  and
and  Then the prediction model becomes of the form:
2.6. Procedure for the Experiment
- The albino wistar rats were first induced with diabetes as explained in section (2.1.1). After three days, the confirmatory test was undertaken following the steps described in Section (2.1.2). The rats were then fasted over night but allowed to take water ad libitum. The following morning, fasting plasma glucose for each test rat was taken and recorded. To calculate the volume of treatment to be administered on each of the test rat, the body weight of each rat was also taken. Glucose solution of 2 gm/kg body weight dissolved in 1.4 ml of water was then administered on each test rat orally through Gavages’ method. The purpose of the glucose solution was to raise the blood glucose level so that then the changes in the level of blood glucose could be monitored over time. Approximately 45 minutes after the glucose administration, a peak of the blood glucose level was observed. The blood glucose level for each test rat was taken at 45 minutes and recorded under t = 45. Treatment was then administered immediately as a solution orally through Gavages’ method to each test rat according to its weight. The next blood glucose level reading was taken at the 120th minute of oral glucose consumption and recorded as t = 120. The change in blood glucose level that occurred in the 1 hour and 15 minutes after the herbal drug treatment had been administered was the response measured.
2.7. Data Analysis
- The estimates of the model parameters were first calculated using R software and then the model was fitted to the data. To achieve this, the data obtained from the experiment was randomly partitioned into two portions; the train data and test data using R environment. The train data took 75% and the test data 25% of this data. The train data was used to obtain the special cubic prediction model while the test data was used to test for the fitness of this model to the experimental data. The level of confidence used was
 = 0.05. For a visual representation of the effect of the interactions among the mixture components, a contour plot was obtained.
2.8. Diagnostic Tests for the Fitted Model
- Upon analysing the data and fitting the model to the data, tests were carried out on the model to find out how well it fitted this data.
2.8.1. Test for the Significance of the Special Cubic Mixture Model
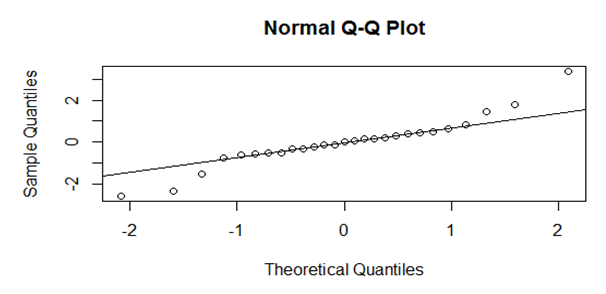
- The first test was on the assumption of normality of the error terms. This was calculated as the difference between the actual measurements and the predicted values by the model. The test involves graphing the normal Q-Q plot of the theoretical against sample quantiles. The normality assumption was satisfied if the Q-Q plot was approximately along a straight line.
2.8.2. Model Cross Validation
- To test how well the fitted model could predict responses, the test data was used. A scatter plot for the differences between the model predicted outputs and the observed responses (delta) was obtained. For a well fitted model, the delta values should be distributed uniformly around zero. Further, the plot should not have clear trend in the delta values.
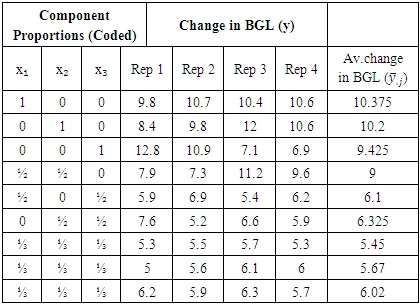
3. Results and Discussion
3.1. Results
- The results obtained from the experiment were as given in the table 3.1.
|
3.2. Analysis of the Data
- Using the train data, the results in table 3.2 were obtained.The residuals in table 3.2 are roughly balanced on either side of zero. The median residual value is also close to zero. Both the multiple R – squared value and the adjusted R – squared value are close to one. This R – squared value indicate that the model explain about 97% of the variation. These results reflect a relatively well fitting model.
|
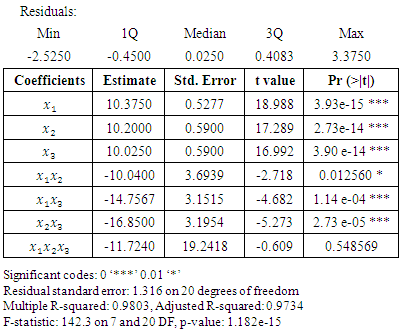
 = 0.05.The fitted special cubic mixture model from results in table 3.2 was:
3.3. Testing the Fitness of the Special Cubic Model to the Data
- After the special cubic model was fitted to the data, tests were carried out to test its fitness as follows.
3.3.1. Testing the Significance of the Special Cubic Mixture Model
 | Figure 3.1. Normal Q-Q Plot for the Residual Terms for the Special Cubic Model |
3.3.2. Cross Validation Using Test Data
- Using the test data, the fitted model was tested on its suitability to predict responses. A scatter plot for the differences between the model predicted outputs and the observed responses (delta), was as given in figure 3.2.
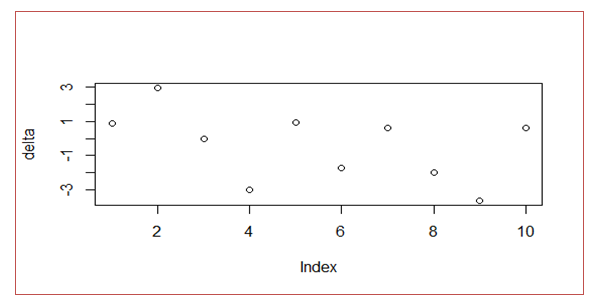 | Figure 3.2. Scatter Plot for Differences between Predicted Outputs and the Observed Responses |
3.3.3. Model Reduction
- From table 3.2, the tertiary blend was not statistically significant at 0.05 p-value. For the purpose of using the model for prediction, it was necessary to drop the tertiary blend. When the tertiary blend was dropped from the special cubic model, the results in table 3.3 were obtained.
|
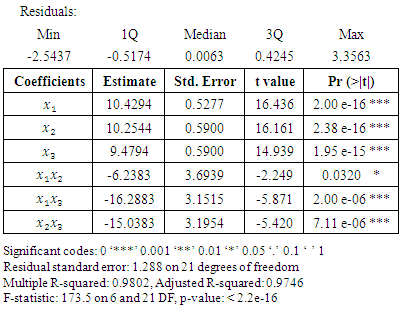
 = 0.05. The resulting reduced model has six terms. The adjusted R-squared value of the new six term model was higher than the special cubic model. This implies that dropping the tertiary blend improves the fit of the model. The six term model was as below.
3.4. Contour Plot for the Mixture Data
- Figure (3.3) below is a contour plot representing the effect of the interactions among the mixture components.Figure (3.3) indicates that change in blood glucose level increased with an increase in the proportion of cinnamon in the tertiary blend.
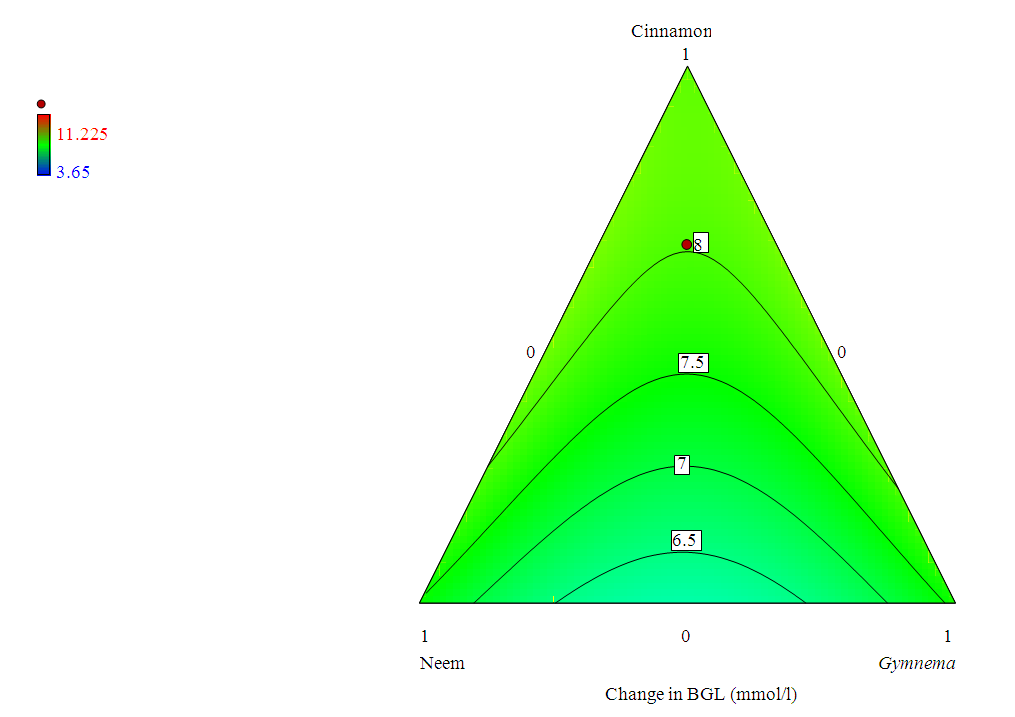 | Figure 3.3. Contour Plot Showing Change in BGL caused by the Mixture Blends |
4. Summary, Conclusions and Recommendations
4.1. Summary
- From table (3.2), cinnamon
 coursed the highest change in blood glucose level among the single components, followed by neem
  and then Gymnema
  A similar order was observed by [22]. All the interaction coefficients were negative showing antagonistic effect of the binary and tertiary interactions. Notably, the binary blend neem and Gymnema had quite a high antagonistic effect. The special cubic model fitted the data fairly well but the tertiary blend was not statistically significant at
  This made it necessary to reduce the special cubic model by removing the tertiary blend. All the remaining six terms in the reduced model were now statistically significant at
  The new six term model is more suitable for prediction. The random partitioning of the experimental results into train and test data helped to accomplish the fitting of the model to the data as well as the testing of the model’s fitness to the data. The contour plot in figure 3.3 demonstrates that, as the cinnamon proportion is increased in the mixture, the change in the blood glucose level increases. This may be as a result of cinnamon being extracted more under this condition than the other components. This is in addition to its higher effect on the blood glucose control, as observed in the results of table 3.2.
 4.2. Conclusions and Recommendations
- The single herbs and their binary mixtures had statistically significant effect on the change in blood sugar level. Antagonistic effect rather than synergistic effect resulted when the herbs were mixed together both as binary and tertiary blends. However, other beneficial herb-herb interactions exist besides the synergistic effect. These may include: potentiation (which refers to situations where one of the herbs serves as the principal herb and the other an auxiliary herb) and/or restraint and detoxification (where a herb helps to make the toxic effect of another combined with it more tolerable) as pointed out by [29]. These herb-herb benefits may need to be explored further. Besides, the appropriate extraction conditions may vary from herb to herb. There would be therefore the need to investigate the level of influence of the extraction conditions of the herbs on the change in blood sugar level. Mixture experiments can be used as means to investigate reinforcement and counteraction effects among combined herbs. The experimental data obtained can be randomly partitioned to serve both as train data to fit models as well as test data for the model fitness.
ACKNOWLEDGEMENTS
- I am greatly indebted to the department of Zoology of Kenyatta University for the technical and material support they offered to me. I also acknowledge the general support accorded me by the department of Physical Science Chuka University.