-
Paper Information
- Paper Submission
-
Journal Information
- About This Journal
- Editorial Board
- Current Issue
- Archive
- Author Guidelines
- Contact Us
International Journal of Statistics and Applications
p-ISSN: 2168-5193 e-ISSN: 2168-5215
2020; 10(3): 68-76
doi:10.5923/j.statistics.20201003.03

The Impact of Microfinance on Poverty Reduction at the Macro Level in Bangladesh Comparing with That of the Traditional Banking Sector
 Abstract
 Reference
 Full-Text PDF
 Full-text HTML
Anas Abu
Department of Economics, School of Oriental and African Studies, London, WC1H 0XG, United Kingdom
Correspondence to: Anas Abu , Department of Economics, School of Oriental and African Studies, London, WC1H 0XG, United Kingdom.
| Email: |  |
Copyright © 2020 The Author(s). Published by Scientific & Academic Publishing.
This work is licensed under the Creative Commons Attribution International License (CC BY).
http://creativecommons.org/licenses/by/4.0/

This paper conducts a comparative study between Microfinance Institutions (MFIs) and the wider banking sector in Bangladesh investigating their macroeconomic impact on poverty in the long run. Microfinance has received much international acclaim in recent decades, but it is debatable whether it has helped individuals break the poverty trap. Stiglitz’s theory on ‘Peer Monitoring and Credit Markets’ suggests the poor should have greater opportunities to escape poverty through loans with little/no collateral and low-interest rates. However, during the years 1983-2016, microfinance appears to have no significant impact on poverty in Bangladesh. First, a Three-Stage Least Squares Regression assesses the relationship between microfinance credit, banking credit, the poverty gap and GDP growth. Here, microfinance has a positive impact on GDP growth but no impact on poverty, possibly because of high-interest rates in practice or a saturated micro-business market. Conversely, the banking sector reduces poverty whilst not impacting economic growth suggesting the poor have been supported through other channels for financial development, including increased access to bank branches. A Vector Autoregression Granger-Causality test has been conducted to observe causality between the financial credit variables and the poverty gap. Results show the poverty gap Granger-causes both banking credit and microfinance credit, suggesting poverty leads individuals to take loans. But this is only expected for microfinance, not the wider banking sector, which raises concerns over whether MFIs are reaching the right individuals. Overall, this study questions the effectiveness of microfinance in reducing poverty, but it is important to acknowledge that this study has been limited by a lack of data from MFIs, and further research is needed with more data.
Keywords: Microfinance, Poverty, Growth, Banking
Cite this paper: Anas Abu , The Impact of Microfinance on Poverty Reduction at the Macro Level in Bangladesh Comparing with That of the Traditional Banking Sector, International Journal of Statistics and Applications, Vol. 10 No. 3, 2020, pp. 68-76. doi: 10.5923/j.statistics.20201003.03.
Article Outline
1. Introduction
- Microfinance has been a growing trend in the international community. Not only was 2005 named 'The International Year of Microfinance' by the United Nations Economic and Social Council but also the Nobel Peace Prize in 2006 was awarded to Dr. Muhammad Yunus and Grameen Bank for their pioneering work of setting up Grameen Bank, now one of the largest Microfinance Institutions in Bangladesh. The literature into how the financial sector affects poverty is extensive but despite Microfinance's growing prominence in recent years, the growth of the Microfinance sector is not singled out often in these studies. This is particularly important within developing countries who have relatively large agricultural sectors, as Microfinance Institutions (MFIs) use the community to get to poor individuals. MFIs are similar to Banks as they also loan using their deposits, but as MFIs are designed to serve the poor, their loans are often much smaller than most Banks' and often do not have any collateral attached. Thus, with differing clients and scale, they could have differing impacts on poverty alleviation (Donou-Adonsou & Sylwester, 2016 p82-83). MFIs usually go beyond just providing the poor with financial assistance, they also provide training related to daily life such as health, hygiene, disease prevention, environmental protection, child immunization, and basic entrepreneurial skills (Mahjabeen, 2007 p1083-1084).This paper observes whether there are differences between traditional banks and MFIs regarding how they impact poverty. The paper is structured as follows: section 2 gives an overview of the Microfinance Sector in Bangladesh; section 3 provides a look over the existing literature in the field; section 4 makes a theoretical comparison; section 5 outlines the empirical tools; section 6 outlines the results; section 7 provides in-depth discussion and section 8 offers a concluding discussion.
1.1. Microfinance in Bangladesh
- Bangladesh has the world’s largest microfinance market. Since the early days of Grameen Bank, a plethora of MFIs have set up including semi-formal financial institutions, government specialist organizations and formal financial institutions. According to CDF (2013), Bangladesh MFIs had around 32 million members by 2013 who had collected over $7.2 billion in disbursements annually, whilst having an outstanding balance of $4.5 billion, which is almost 3% of Bangladesh’s GDP. Bangladesh now has over 750 MFIs registered who collectively have over 17,000 branches. Microfinance’s influence in Bangladesh is growing. Not only does microfinance support the working capital needs of poor entrepreneurs, but it has also enabled greater productive employment. Thus, as the needs of microfinance products have increased, it has attracted greater appeal for policymakers to increase access to finance. Through its sheer scale, microfinance can no doubt be a success for simply giving more people access to finance (Khandker et al, 2016 p3).Despite Bangladesh having huge potential for growth, for different socio-economic reasons it is one of the poorest countries in the world. With much of the poverty burden falling on to the shoulders of women; poverty alleviation, rural regeneration, and female empowerment are amongst the country's top priorities (Ahmed, 2009 p999). The characteristics of microfinance go hand in hand with these priorities.
1.2. Literature Review
- To investigate the aggregate relationship between Microfinance development and poverty, it is useful to draw inspiration from the literature on the relationship between financial development and poverty. Most research in this field indicates a negative relationship between financial development and poverty (e.g. Dehejia and Gatti (2002), Clark et al (2006)). Indeed, the World Bank suggests increasing the poor's access to credit and insurance services has positive effects, such as improved productivity and greater potential for living a sustainable life (World Bank, 2001a p75). However, Greenwood and Jovanovic (1990) do not view financial development to be a pro-poor strategy as the large initial costs are too high for the poor to benefit from developments (Greenwood and Jovanovic, 1990, p1078-1079). This is according to theory, there is little empirical evidence supporting this. For example, Honohan (2004) highlights financial depth to have a negative relationship with headcount poverty, this is even when income inequality is considered (Honohan, 2004 p1). Many studies advocate an indirect relationship between financial development and poverty via economic growth. The theory has conflicting conclusions: some models suggest financial development improves growth and positively affects incomes of the poor. This is because financial imperfections such as information and transactions costs should fall, helping those who do not have collateral or credit histories. Whilst other theories imply financial development mainly helps the rich. It is argued the poor are more reliant on informal connections for capital such that any improvements to the formal finance sector only benefit the rich (Beck et al, 2007 p3). Furthermore, Jalilian and Kirkpatrick (2005) look at the process that links financial sector growth and poverty reduction. The results show that financial sector growth has an impact on poverty reduction through the growth enhancing effect. Financial development impacts income inequality, which has a knock-on effect towards reducing poverty. (Jalilian and Kirkpatrick, 2005 p.636). Beck finds a negative relationship between financial depth and changes in income inequality via enterprise rather than household credit. This suggests the pro-poor aspect of financial deepening can come through indirect effects (Beck, 2015 p. 37).Studies focusing on the aggregate impact of Microfinance development take a similar approach. For example, Donou-Adonsou and Sylwester (2015) observe the macroeconomic effects of Microfinance with a sample of 71 countries from the period 2002-201. Using the generalized methods of moments estimator, they find that Microfinance loan growth has a positive and significant effect on total factor productivity and economic growth. But the impact is only small so the development process will not be slow (Donou-Adonsou and Sylwester, 2015 p30). This paper and others look to fill a void in researching Microfinance at a macro level. Donou-Adonsou and Sylwester (2016) take this one step further by using the indirect approach to compare traditional banks with Microfinance Institutions to see the extent to which each type of financial development contributes to poverty reduction. They find that results suggest bank credit reduces poverty when poverty is measured by the headcount ratio and poverty gap. But there is nothing significant when using the squared poverty gap to measure poverty. (Donou-Adonsou and Sylwester, 2016 p82). This paper takes inspiration from Ahlin and Jiang (2008) who look into the potential long-run effects of micro-credit, i.e. the study looks into the long-run effects micro-credit has on development through using income per capita, poverty, and inequality as measures. They find microfinance can lessen or even remove the use of the least productive subsistence technology by removing the financial barriers to self-employment. However, microfinance can reduce the usage of the most entrepreneurial technology (Ahlin and Jiang, 2008 p1).This paper attempts to fill a gap by conducting a comparative study between MFIs and the broader financial sector in Bangladesh concerning their macroeconomic impact on poverty in the long run.
1.3. Stiglitz’s Theory on ‘Peer Monitoring and Credit Markets’
- Stiglitz theorises that the basic problem with conventional bank lending to the poor, is that banks do not trust individuals to take on a safe project with their loan. With riskier projects, the borrower is compensated with higher returns for the extra risk associated with risky projects. In contrast, the bank is not compensated in the same way and has less chance of being repaid. Therefore, at a given level of interest rate, the borrower will want to loan more than the bank is willing to provide to limit the bank’s risk (Stiglitz, 1990 p.358), giving poor people less of an opportunity to make an investment to get out of poverty.To avert this problem, Stiglitz calls for a neighbour to sign the loan agreement alongside the primary lender. The agreement should state the neighbor to pay compensation if the primary lender defaults, this is the system Microfinance is based upon. The neighbour has an incentive to monitor the primary borrower and ensure activities are not too risky. With the neighbour co-signing, the neighbor’s risk increases and the bank’s decreases, enabling the lender to provide a loan with a lower interest rate and higher funds that otherwise have been possible without the peer monitoring system (Stiglitz, 1990 p.360.According to the analysis above, there is a greater opportunity for a peer monitoring loan system to have a direct positive impact on poverty compared to the conventional banking sector. There is a greater chance for them to breach the poverty trap as they can acquire a larger loan for a safe project and earn a return.Coverage for banks across rural communities is difficult, hence adopting a system that encourages villagers to monitor each other circumvents those problems. Indeed, if done well the scheme can take advantage of the close-knit nature of rural communities in developing countries, removing much of the asymmetric information involved.Stiglitz though states that the impact of the co-signer is something beyond increasing the effective collateral on a loan. With the neighbour, the lender can reduce the interest rate charged for a given scale (Stiglitz, 1990 p362), giving the borrower confidence to spend more.There are some important limitations to this theory that need to be pointed out. Firstly, this theory doesn't cover all the differences between a banking sector loan and an MFI loan. Yes, the group lending process is a key differentiating factor, but other factors affect the level of poverty that have not been considered. For example, MFIs provide much smaller loans (i.e. microloans) and entrepreneurial training. Also, the target audiences of the two types of financial institutions vary. MFIs exist for individuals who cannot obtain a loan from a bank usually due to a lack of collateral, the banking sector often doesn't directly reach the poor. Therein lies another problem, the model does not consider the potential indirect effect the banking sector could have on the poor.Furthermore, there are both economic and social issues with the Peer Monitoring process. There are problems if the groups become too large, for example, the free-rider problem. Each member of the group may prefer someone else to monitor the borrowers in the group. It could be possible for someone to gain from group lending, but then not monitor anyone (Stiglitz, 1990 p363). Also, the group lending process could negatively impact social cohesion because it sets up a system that forces individuals to monitor each other, which may help individuals but may damage communities.
2. Main Body
2.1. Data
- The two key observations required were the growth of the Banking and Microfinance sector respectively. Some studies have chosen to use financial depth instead (for example, the number of branches) but poverty may not be affected by this because it is unable to demonstrate the quality and quantity of financial institutions (Honohan, 2004 p8). Hence, we use credit disbursement over time as an indicator, for the Banking sector, domestic credit as a percentage of GDP, whilst there were difficulties in attaining the respective data for the MFI. The only source with a sufficiently long period for Microcredit disbursements was attained from the Grameen Bank's annual reports. Their credit disbursement growth is used to represent Microcredit growth in Bangladesh (Mahjabeen (2008) also did this). The poverty measure in use is the Poverty Gap at $1.90 a day. The remaining variables were obtained from the World Bank's open-source data for the years 1983-2016. However, a further problem arose as the poverty measures were measured in intervals leaving missing data entries. To continue with this dataset, the poverty measures were linearly interpolated, filling in missing data points, see figure 1 below:
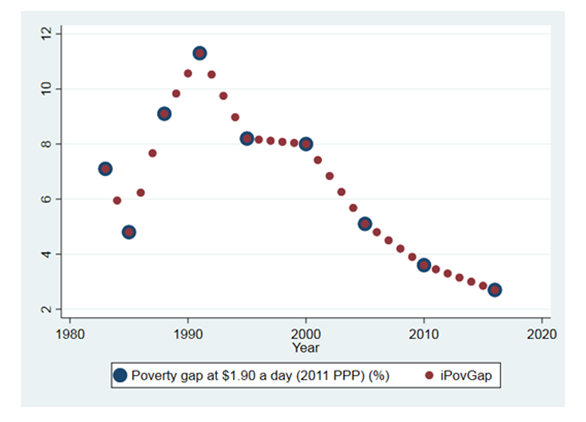 | Figure 1. Poverty Gap and Interpolated Poverty Gap (iPovGap) scatter plot |
2.2. Methodology
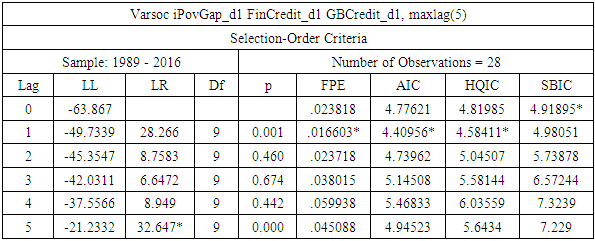
- Initially, an OLS regression will be run to look at the direct relationship between Microfinance and Poverty, and conventional Banking and Poverty. Alongside this, two other important tests will also be conducted. Firstly, the structural simultaneous Three-Stage Least Squares (3SLS) regression explore if there is an indirect relationship between the two financial credit variables and poverty via economic growth. Thus, we require two endogenous variables: GDP growth and the Poverty Gap. Structural equation models are flexible and allow us to observe many different aspects of our study (Nachtigall et al, 2003 p15). The 3SLS estimator is used as generally speaking, the estimates are more efficient compared to the primary alternative, the Two-Stage Least Squares estimator (2SLS). This is demonstrated by Mukherjee et al (1998), stating 3SLS is approximately 5% more efficient than 2SLS (Mukherjee et al, 1998 p450-457). Also, Greene argues 3SLS to be asymptotically more efficient than 2SLS (Green, 2012 p372).Secondly, a Grainger Causality Test will also be run to observe whether or not there is any causal relationship between Poverty Gap, Banking credit and Microfinance Credit. It is possible to label a time series variable 'causal' to a different time series variable if the first can predict the other using the first variable's information i.e. seeing if a time series can predict another. The causality amongst two variables has the potential to be unidirectional (one way), bidirectional (both ways) or independent of any Grainger-Causality (ElemUche O. et al, 2018 p120). The Grainger Causality Test is, of course, a test from a different strand of econometrics to the 3SLS estimator, Vector Autoregressive Models (VARs). This strand originated from growing skepticism of simultaneous equation models' ability to be accurate for larger and more frequented time series; their inability to take into account dynamic interactions was a problem with these simultaneous equations. Thus, in a landmark paper in macro econometrics, Sims (1980) suggested the use of VAR to cater to any dynamism within time series models (Mills and Patterson, 2007 p478). There are three steps required for the Grainger Causality Test: stationarity test, lag order selection and the Grainger-Causality Test itself. Each step will be demonstrated in the upcoming sections.
2.3. Three-Stage Least Squares Estimator Model
- The model is shown by the following two equations in a simultaneous equation system:
 | (1) |
 | (2) |
2.4. Grainger-Causality Test
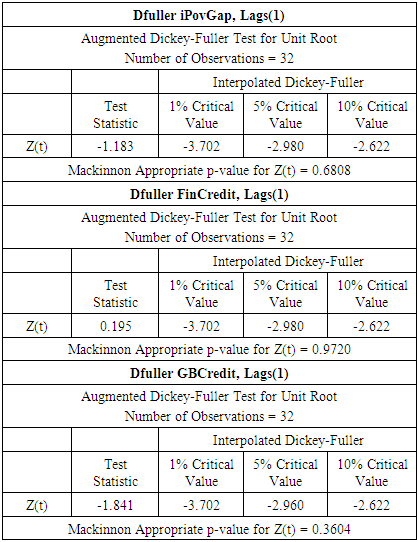
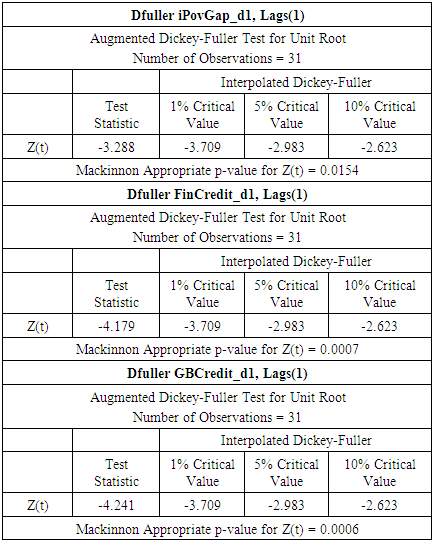
- The three variables of interest are iPovHead, FinCredit and GBCredit. A VAR model will be run on the three variables, in order to then conduct the Granger-Causality Test (ElemUche O. et al, 2018 p121). To run the model, each variable must be stationary. A time-series variable is stationary if its mean-variance is finite and independent of time, whilst also the auto-covariance must not grow over time. Another way of looking at it is that if the time series is non-stationary, the time series has a unit root. It is possible to do unit root tests to check stationarity in each time series variable using the Augmented Dickey-Fuller (ADF) test. This is an augmented version of the original Dickey-Fuller test to allow for serial correlation as well as more complicated time-series models (ElemUche O. et al, 2018 p121). We perform the ADF test to see if the series are stationary.
|
|
|
2.5. Limitations
- There are problems with this data and methodology which need to be acknowledged before we interpret the results. Firstly, using Grameen Bank as representative of the entire Microfinance market in Bangladesh is a large drawback for this study. The Bangladesh Microfinance sector is one of the largest in the world so simply just looking at one firm will not provide an accurate picture for the entire sector. Secondly, there are problems with using the Poverty Gap as a measurement for poverty. The poverty gap index does not consider the effect of inequality amongst the poor. It is largely held amongst scholars that Poverty Gap is only a slight improvement over the poverty headcount ratio (Foster, 1998 p355). Further, Sen suggests that it is better than simply counting the number of poor below a line, but it is still qualitatively limited. These qualitative factors include abilities, skills and other personal resources which affect poverty (Morrell, 2011). Finally, the linear interpolation used for the Poverty Gap measure is also a limitation. It is simply just not realistic to assume the values will always continue a linear path over time.There are also limitations to the models used in this study. It is important to avert any specification errors; the 3SLS estimator will spread them out. Further problems will occur as a result of limited information within the estimators (Greene, 2012 p373). There are also some limitations of the Granger-Causality test we must be aware of. Stokes and Purdon (2017) found that the estimates can be either highly biased or having a large variance, with both instances leading to spurious results. Also, if they have been estimated correctly, a Granger-Causality test is simply not enough on its own to understand a systematic model. This study has somewhat avoided this by conducting structural simultaneous equations alongside the Granger-Causality test. A final problem mentioned in the study is that the Grainger-Causality test does not consider key components of series dynamics. In this study, we have just looked at a VAR model with three variables of interest and this may mean we have not completely understood the dynamics involved (Stokes and Purdon, 2017 p1).
3. Results
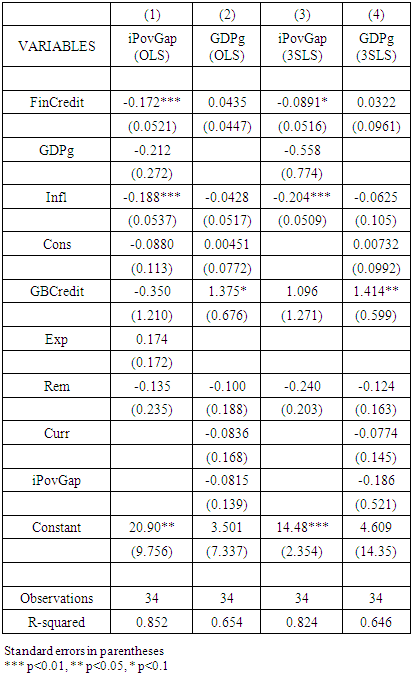
3.1. 3SLS
- Below are the results from the OLS and 3SLS regressions run on Stata.
|
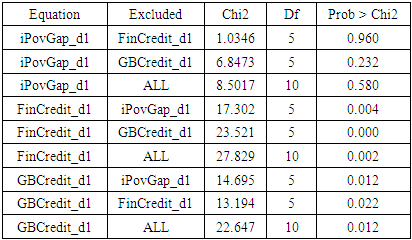
3.2. Granger-Causality Test
- The Granger-Causality Test is below:
|
4. Discussion
- Stiglitz's theory implied there to be greater opportunity for MFI loans based on a peer monitoring loan system to impact poverty levels compared to the traditional banking sector. However, the results from the empirical works in this paper do not support this notion. It seems to be the case that Microfinance institutions have no impact on poverty levels at the macro level over a long period. This could be due to MFIs not operating in the way Stiglitz theorized. Perhaps looking at the interest rates offered by Microfinance Institutions in practice can help explain why. Stiglitz argues that, as a result of the peer monitoring system, the neighbor has taken on an element of risk allowing the lender to reduce the interest rate charged (Stiglitz, 1990 p362). A study by Thanvi in West Bengal found that actually, MFIs charge interest rates at a level greater than their formal banking counterparts, some even charged a rate twice as high as the rate charged by banks (Donou-Adonsou, Sylwestre, 2016 p83). It is questionable how effective the MFIs are towards reducing poverty when interest rates are this high because it will not help the poor if they are forced into paying very high debts if unable to make enough money from the initial loan. Furthermore, there is a positive relationship between Microfinance credit and GDP growth as it could be the case that microloans are making more individuals economically active, thus raising GDP, but they are unable to break the poverty cycle due to barriers like high-interest rates. Another barrier could be the micro-entrepreneur industry becoming too competitive leading to market saturation. This is demonstrated by Yusupov (2012) who takes into account the competition aspect of microfinance using an occupational choice model. The probability of success for each micro-entrepreneur falls as another person takes a microloan (Yusupov, 2012 p820). Moreover, with high competition but little diversification in products, there could be harmful effects such as diseconomies of scale. In addition, microfinance growth can create micro debt dependencies; individuals can take loans from multiple sources and consequently become over-indebted or stuck in poverty. The domestic credit variable (FinCredit) did have a direct positive impact on poverty reduction whilst not having any impact on economic growth. This could be because those individuals who have been able to provide collateral for a loan have been able to use the loan to increase their income in the long run. A potential explanation is a rising number of bank branches increasing access to finance. This is supported by Rewilak (2017) who finds increased physical access to finance has positive effects on reducing poverty (Rewilak, 2017 p169). The absence of any potential indirect impact from the finance variables to poverty via economic growth is surprising. From this study we cannot state if there is any evidence of an indirect impact.The results of the Granger-Causality test were also surprising but leaves plenty of room for thought. Interestingly, the interpolated Poverty Gap time series variable explains both FinCredit and GBCredit. This suggests that it is people's financial position which causes them to take out a loan to perhaps try to increase income in the long run. The remarkable aspect is then that FinCredit has the same result as GBCredit; they are expected to have different users with the poorer individuals using microloans thus more likely to be influenced by poverty. This implies the users of both types of finance are perhaps not as different as initially thought, perhaps microfinance is not reaching the poorest of the poor. Indeed, according to Arp (2018) when MFIs are not managed well, it simply provides extra chances for individuals who are seen as a safe investment receive extra funds. Therefore, the poorest individuals sometimes do not even get the opportunity to break down the existing socio-economic hierarchies (Arp, 2018). It is also possible that the traditional banking sector has reached the poor to a greater level but out of the two conclusions this one is less likely as the financial market in Bangladesh is still thin (Mahjabeen. 2008 p1085).
5. Conclusions
- In conclusion, microfinance is unable to have any impact on poverty at the macro level during the years 1983-2016. According to Stiglitz's theory, it should have a positive impact on poverty reduction but empirically neither the structural simultaneous Three-Stage Least Squares nor the Vector Autoregression Granger-Causality test support the theoretical result. Microfinance does seem to have a positive impact on GDP growth but there is no evidence of an indirect impact on poverty. These empirical results could be due to Microfinance not working in practice as in theory (for example high-interest rates) or because of a saturated micro business market.The traditional banking sector has a positive impact on poverty reduction but not on economic growth. This suggests there could be other channels aside from economic growth that financial development uses to help the poor. Increased access to branches in Bangladesh over time may likely have contributed towards this result. The Granger-Causality test implied it was the poverty level which led to individuals acquiring more finance. With this being the case for all forms of finance, perhaps the microfinance sector in Bangladesh has not yet reached the poorest of the poor.These conclusions are made understanding the limitations of this study including missing data, interpolation, and methodological issues.