Jacob Oketch Okungu 1, George Otieno Orwa 2, Romanus Odhiambo Otieno 1
1Department of Mathematics, Meru University of Science and Technology, Meru, Kenya
2Department of Statistics and Actuarial Science, Jomo Kenyatta University of Agriculture and Technology, Nairobi, Kenya
Correspondence to: Jacob Oketch Okungu , Department of Mathematics, Meru University of Science and Technology, Meru, Kenya.
| Email: |  |
Copyright © 2020 The Author(s). Published by Scientific & Academic Publishing.
This work is licensed under the Creative Commons Attribution International License (CC BY).
http://creativecommons.org/licenses/by/4.0/

Abstract
The main objective in sample surveys is to make inference about the entire population parameters using the sample statistics. In this study, a nonparametric estimator of finite population total is proposed and the coverage probabilities using the Saddle point approximation explored. Three asymptotic properties; unbiasedness, efficiency and the confidence interval of the proposed estimator are studied. The study focusses more on length of confidence interval and coverage probabilities. The amount of bias and MSE are studied both analytically and empirically. Simulated data using three data variables; linear, quadratic and exponential are generated to study the asymptotic properties of the proposed estimator. Based on the empirical study with simulations in R, the proposed estimator resulted into a comparatively smaller amount of bias and MSE compared to the nonparametric Nadaraya – Watson (Dorfman’s) estimator, the design-based Horvitz-Thompson estimator and the model-based ratio estimator. Further, the proposed estimator is tighter compared to the other three considered in this study and has a higher converging coverage probability.
Keywords:
Asymptotic Normality, Nonparametric estimator, Auxiliary variables and Saddlepoint
Cite this paper: Jacob Oketch Okungu , George Otieno Orwa , Romanus Odhiambo Otieno , Non-Parametric Estimator for a Finite Population Total Based on Saddlepoint Approximation, International Journal of Statistics and Applications, Vol. 10 No. 3, 2020, pp. 60-67. doi: 10.5923/j.statistics.20201003.02.
1. Introduction
In estimating a population parameter such as a mean or a variance, a measure of precision of the estimate is quite paramount. The most commonly reported measure of precision is the function of the variance (or its square root; the standard error). The variance of the estimator is always estimated since the measure of precision of the estimator is the inverse of its variance [9]. In the estimation of the finite population total, misspecification of the model can lead to serious errors in an inference especially with regard to the non-sampled part of the population. In the recent past, efforts have been made to explore alternative ways to attenuate the errors. These include the use of nonparametric regression in evolving robust estimators in finite population sampling [5], [12].Nonparametric estimators have been found to be robust and more precise than their parametric counterparts. It is known, for instance, that a linear regression estimate will produce a large error for every sample size if the true underlying regression function is not linear and cannot be well approximated by linear functions [10]. The non-parametric regression estimator of a finite population total is a potent rival to familiar design-based estimators [7]. It has the quality of automaticity associated with design-based estimators, but can better reflect the actual structure of the data, yielding greater efficiency. It can be costly in computer power, and will probably not do as well as a parametric-model based estimator, when the modelling process is done carefully. Further research on how satisfactory the consequent confidence intervals of the estimator could be [5].
1.1. Statement of the Problem
As long as populations are large, detail is expensive [3]. In most studies the sample information is to estimate the population characteristics. The choosing of models could lead to misspecification especially with regard to using of the auxiliary information of the non-sampled part of the population. A finite population total estimator that gives shorter confidence interval and higher coverage probabilities with possibilities of errors’ correction due to skewness and kurtosis remains unexplored.
1.2. Objectives of the Study
1. To propose a nonparametric estimator for a finite population total based on Saddle point approximation.2. To study the asymptotic properties of the proposed finite population total estimator.3. To estimate the coverage probabilities for the proposed finite population total estimator.
2. Summary of Literature Review
2.1. Review of Nonparametric Estimation
Nonparametric regression has its origin in exploration of data. Let  be a data set, then a cloud of points is suggested. It may basically mean drawing a line in the
  plane through the cloud of points showing the essential characteristics of the nature of relationship between the variables Y and X. In sample surveys, there are four estimation approaches that can be used in statistical investigations; the design-based approach, model-based approach, model-assisted approach and randomization-assisted approach [3].The model-based approach has bridged the gap between finite population problems and the rest of statistics. Before the model-based approach, finite population sampling was an eccentric realm where many of the basic concepts and tools of statistics were curiously inapplicable. Statisticians skilled in designing experiments and in applying linear models to make inferences from experimental and observational data found that finite population problems were apparently beyond the scope of their techniques [6].Although there were some familiar-looking formulas, such as the linear regression estimator; these statistics lacked the familiar rationale and properties. Not only was the linear regression estimator biased and therefore certainly not a Best Linear Unbiased Estimator (BLUE), it was not even linear, because the random choice of observation points turned the denominator of the estimated slope into a random variable. In the model-based approach, the distribution is a structure that is defined by the population itself and is unknown but can be modelled. In this prediction approach, the expectations are over all possible realizations of a linear regression stochastic model linking a variable of interest Y with a set of auxiliary variables, X [1]. The values of the variable Y are believed to be random variables;
  generated by some model. The actual observations for the finite population
  are one realization of the random variables. The presence of the auxiliary information associates units in the sampled and the non-sampled.The information obtained from the sample is used to predict the information of the non-sampled observations. In this study, it is assumed that Y is function of X, hence a model of the form
  | (1) |
is used. It is further assumed that  are the error terms which are normally identically and independently distributed with
  and
and  An appropriate model-based estimator of the finite population total is of the form
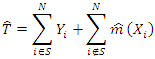 | (2) |
Where  [14].
[14].
2.2. Other Estimation Methods
A related nonparametric model-assisted regression estimator was considered by replacing local polynomial smoothing with penalized splines [2]. They extended the local polynomial nonparametric regression estimation to two-stage sampling. In their work, simulation results indicate that the nonparametric estimator dominates standard parametric estimators when the model regression function is incorrectly specified, while being nearly as efficient when the parametric specification is correct.In their work, they considered the application of nonparametric regression to the estimation of finite population error variance for a given sample drawn from the population [12]. The error variance obtained by [5] was a function of  that are unknown. By considering the squared residual
  and using some mild assumptions, the study showed
  implying that
  is an asymptotic unbiased estimator of
  . They obtained an improved estimator of
  by smoothing
  for
for  being sample points
  close to
  .Local polynomial regression was also used in the estimation of finite population totals. In this research, the equation
 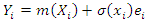 was considered and the technique of using a strip of data around the co-variate applied in order to fit a line through the set of data
  [13]. The estimator yielded better results in estimating the finite population total. Further, the estimator was found to be asymptotically unbiased, consistent and normally distributed when certain conditions were satisfied.
3. Methods
3.1. Review of Saddle Point Approximation
Saddle point approximation provides probability approximations whose accuracy is much greater than the current supporting theory would suggest. Saddle point methods are also useful in avoiding much of the simulation requisite when implementing another modern statistical tool, the bootstrap. The most fundamental Saddlepoint approximation was first introduced by Daniels and is essentially a formula for approximating a density mass function from its associated MGF or cgf [4]. Assume that the functions are as regular as needed. In other words, when a derivative or an integral is assumed to exist then, the saddle point approximation arises from a natural sequence of approximations that become progressively more local. Suppose a continuous random variable X has density  defined for all real values of X, then the MGF of density
  is defined as the expectation of
  that is,
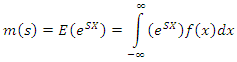 | (3) |
over the values of S for which the integral converges. With real values of S, the convergence is always assured at s = 0: In addition, it is presumed that the M(S) converges over an open neighborhood of S designated as say (a, b). Consequently, the CGF of the function is defined as | (4) |
For a continuous random variable X with CGF K and unknown density f, the saddle point density approximation to  is given as
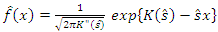 | (5) |
Where  is the saddle point equation and
  is the saddle point associated with the value x [11].To approximate the density of the total population total
  using saddle point approximation, consider finding the density of
  which are iid with CGF K. In this approximation, the Saddle point density is the leading term of the asymptotic expansion as
  of the function, f that is
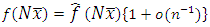 | (6) |
where  is the relative error of the asymptotic order indicated and (6) therefore reduces to
 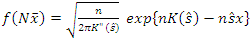 | (7) |
[8].
3.2. The Proposed Estimator
Let T be the population total, defined as the sum of the values of all the population measurements and let the random variable Y be the variable of interest and that X is an auxiliary variable associated with  assumed to be known for all the observable population units such that
  All the sampled units are observed and the task therefore is to estimate the non-sampled part of the population. The non-sampled part is estimated using the Saddle point approximation. Let S be the sample from the population of N units, then
 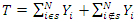 . For the sum
  , consider the model
 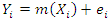 where m is an unknown smooth function that depends on the sampled data and is estimated by
  for the non-sampled data points.The nonparametric estimator of the finite population total is proposed,
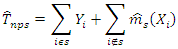 | (8) |
To obtain  and estimate of
  , let
, let 
 such that
  Therefore
  can be rewritten as,
 | (9) |
Such that embracing the estimates yield, | (10) |
4. Empirical Study
4.1. Simulation of Data
Population of size 1,500 was simulated from three data variables; linear, quadratic and exponential. The linear function was based on the linear model which has the relation | (11) |
The second study variable or mean function was obtained using the quadratic function which has the relation | (12) |
The third study variable was obtained from an exponential function which is given by | (13) |
The auxiliary variable  was assumed to be uniformly distributed and in the interval [0,1]. The error term
  is a standard normal variable defined as
  .A simple random sample of size 300 was selected randomly from the simulated population index-wise, and replicated 1500 times giving rise to 1500 simple random samples. The proposed estimator was therefore compared to the nonparametric regression estimator due to [5], the design-based Horvitz-Thompson estimator and the Ratio estimator using the amount of bias, MSE and the coverage probabilities.
4.2. Unconditional Properties
4.2.1. Relative Bias of the Estimator
The relative bias of the estimator was obtained using  where T is the actual population total and
  is the estimator of the population total from the
  sample, for
  .
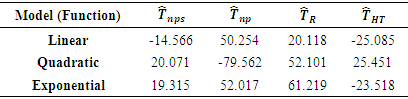
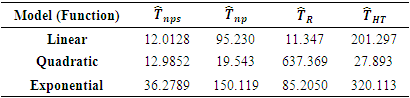
. Table 1. Relative Biases of the Estimators
 |
| |
|
From Table 1, some of the values of the average relative biases are either negative or positive which shows either underestimation or overestimation respectively. For the linear function, the ratio estimator has the lowest bias, followed by the proposed estimator showing that the model-based ratio estimator is the best. This is because the ratio estimator is the Best Linear Unbiased Estimator (BLUE). For the quadratic function, the proposed estimator outperforms all the other three estimators and the same applies to the exponential function. It is also observed from the simulated data particularly from quadratic and exponential functions, that most of the estimates obtained using the estimator due to [5] and those of the ratio estimator had slightly larger biases in most of the data models.
4.2.2. Mean Squared Error (MSE)
The measures for the MSEs were computed for the three data sets, 
 and then compared. The summary of the results are tabulated in Table 2.
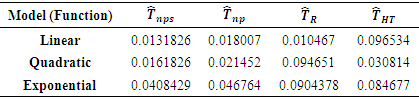
Table 2. Relative MSE of the Estimators
 |
| |
|
From Table 2, for the linear function, the ratio estimator performed the best followed by the proposed estimator. This is because the ratio estimator is the Best Linear Unbiased Estimator (BLUE). For the quadratic function, the proposed estimator performed the best with the ratio estimator having the largest value, attributable to the fact that the ratio estimator though BLUE is unstable for other distribution functions. For the exponential function, the designed-based Horvitz-Thompson estimator and the model-based ratio estimators have larger values showing that the proposed nonparametric regression estimator of the finite population total is the best of the four followed by the nonparametric regression estimator by [5].
4.2.3. The 95% Confidence Interval Length
The uncertainty in using point estimate is addressed by means of confidence intervals. Confidence intervals provide us with a range of values for the unknown population along with the precision of the method. The standard error necessitates the construction of the confidence interval. These give the probability to which the range of estimator covers the estimator of the parameter. A 95% confidence interval was therefore constructed such that 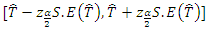 | (14) |
The empirical results were tabulated in Table 3.Table 3. 95% Confidence interval length of the estimators
 |
| |
|
From Table 3, for the linear function, the ratio estimator being BLUE has the shortest confidence interval followed by the proposed estimator. the proposed nonparametric regression estimator of the finite population total has the shortest confidence interval length for the quadratic and exponential functions, showing that the proposed estimator outperforms the design-based Horvitz-Thompson and the Dorfman’s nonparametric estimators.
4.2.4. Coverage Probabilities of the Estimator
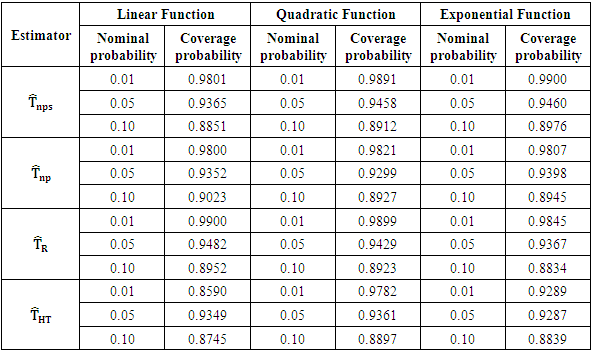
The coverage probabilities of the proposed estimator were computed using the nominal probabilities; 0.01, 0.05 and 0.10 for the 99%, 95% and 90% confidence levels respectively.From Table 4 attached as an appendix, apart from the linear function, the proposed estimator has the highest conditional coverage probabilities for all the functions used in the study. Table 4. Coverage Probabilities of the estimators
 |
| |
|
4.3. Conditional Properties
4.3.1. Conditional Biases
Since the estimation is model-based, the 1,500 simple random samples were grouped into groups of 50 so that there were 30 groups. For each group  was computed and
 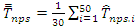 was also computed. The conditional bias for each group was computed as
  where
where  is the population mean for the survey measurements and
  is the sample mean for the auxiliary variables. The figures 1, 2 and 3 below illustrate the behavior of the conditional bias for each estimator when the three mean functions were used. The figure 1 shows the conditional bias when linear mean functions was used, figure 2 shows the conditional bias when a quadratic mean function was used and figure 3 shows the conditional bias when an exponential mean function was used.
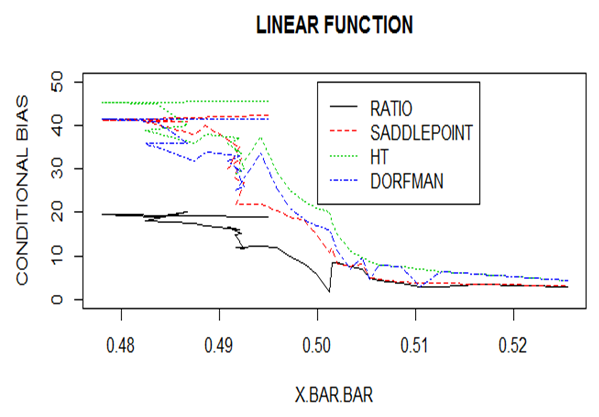 | Figure 1. Conditional biases for the Linear Function |
From figure 1, the ratio estimator performed well when a linear mean function was used. This is attributed to the fact that the ratio estimator is the Best Linear Unbiased Estimator (BLUE). It can be observed that the biases to the left of the population mean of the auxiliary variable are large but gradually reduce towards the right.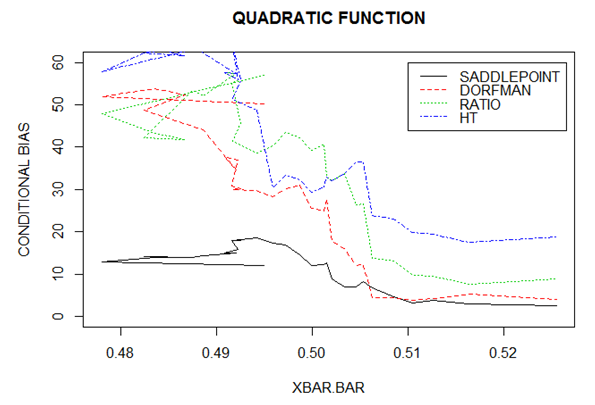 | Figure 2. Conditional biases for Quadratic Function |
From figure 2, the quadratic mean function was used, the proposed estimator gives better estimates of the population total compared to those realized using the estimator proposed by [5], the ratio estimator and the design-based Horvitz-Thompson estimator. It can be observed that biases to the left of the population mean of the auxiliary variable, are large but gradually reduce towards the right.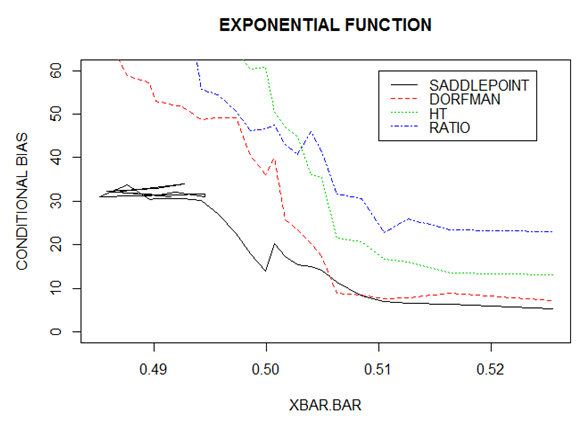 | Figure 3. Conditional Biases for Exponential Function |
From figure 3, the exponential mean function was used, the proposed estimator gives better estimates of the population total compared to those realized using the estimator proposed by [5], the ratio estimator and the design-based Horvitz-Thompson estimator. Just like in the functions in Figures 1 and 2, it can be observed that biases to the left of the population mean of the auxiliary variable, are large but reduce gradually almost symmetrically towards the right.
4.3.2. Conditional MSEs
Just like the biases, conditional MSEs were determined in order to establish the robustness of the proposed estimator compared to the designed based, the ratio and the non-parametric Nadaraya-Watson (Dorfman’s) estimators.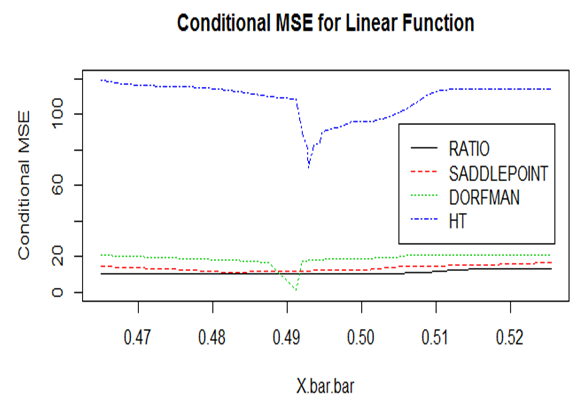 | Figure 4. Conditional MSEs for the Linear Function |
From Figure 4, the ratio estimator has the lowest MSE compared to all the other estimators, this is attributed to the fact that the ratio estimator is BLUE. Apart from the fact that, the non-parametric estimator proposed by [5] has a minimum MSE at around 0.49 mean of the means, the proposed estimator is the second-best estimator based on the MSE.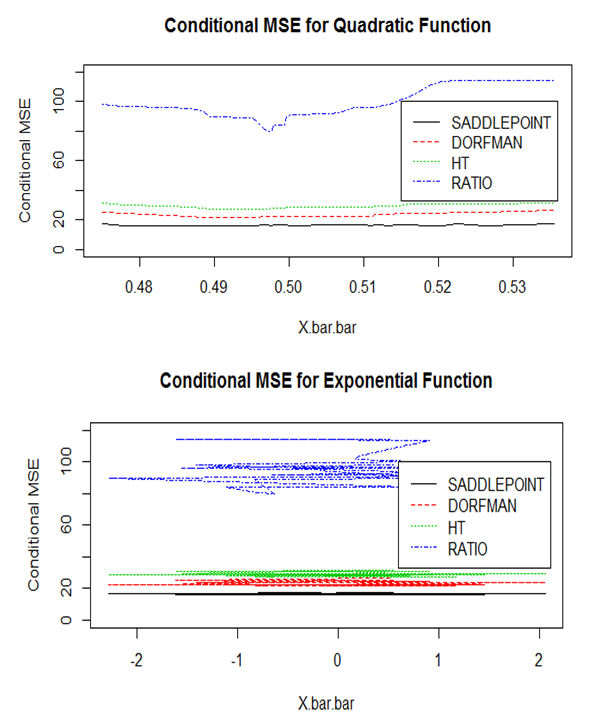 | Figure 5. Conditional MSE for Quadratic and Exponential Functions |
From Figure 5, the proposed estimator has outperformed the design-based Horvitz-Thompson, model-based ratio and the Dorman’s non-parametric Estimators for both functions; quadratic and exponential.
4.3.3. Conditional Confidence Interval Lengths
The confidence intervals and coverage probabilities were the main asymptotic properties of the proposed estimator. Given the proposed estimator is model-based, the conditional confidence interval lengths were also explored as in Figures 6 and 7.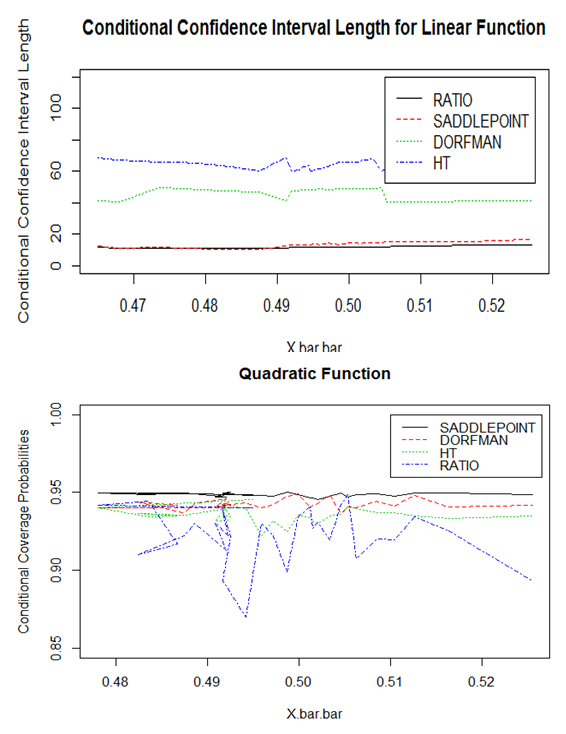 | Figure 6. Conditional Confidence Interval Lengths for Linear and Quadratic Functions |
From Figure 6, the proposed estimator has the shortest confidence interval length except in the linear function where the ratio estimator has the shortest confidence interval length. Averagely therefore, the proposed estimator has the shortest confidence interval length.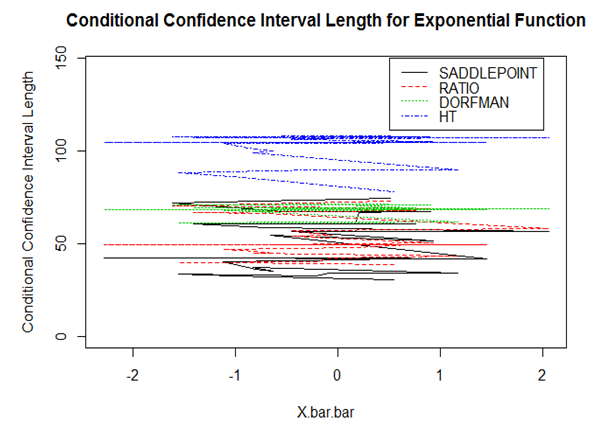 | Figure 7. Confidence Interval Length for the Exponential Function |
From Figure 7, the proposed estimator using Saddlepoint approximation has the shortest confidence interval length, followed by the ratio estimator with the design-based Horvitz Thompson parametric estimator having the longest confidence interval Length. From both the unconditional and conditional confidence interval lengths, the proposed estimator is robust.
4.3.4. Conditional Coverage Properties
Based on the conditional confidence intervals, the coverage probabilities were computed for the 30 samples. The coverage probability was based on the number of observations falling within the confidence interval compared to the total number of observations. The coverage properties of the estimators are captured in Figures 8 – 10.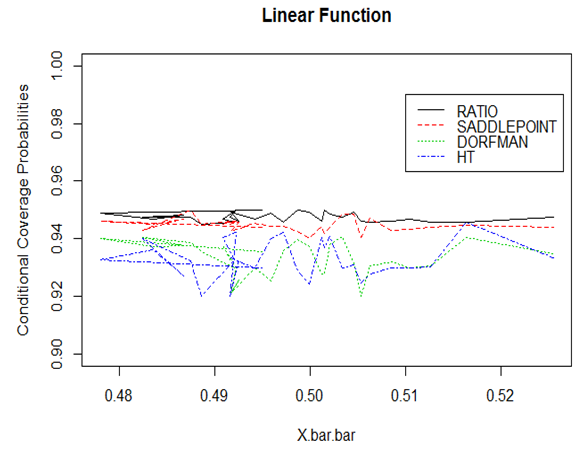 | Figure 8. Conditional coverage probabilities for the Linear function |
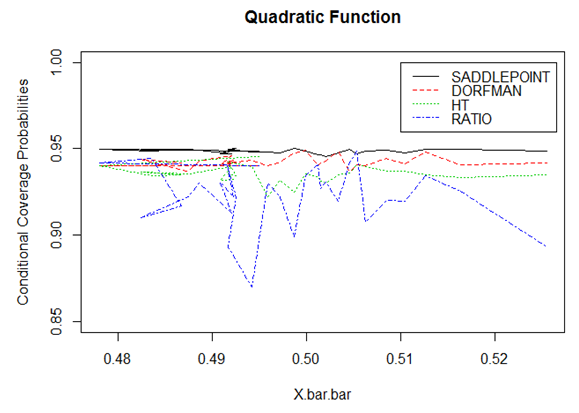 | Figure 9. Conditional coverage probabilities for the Quadratic function |
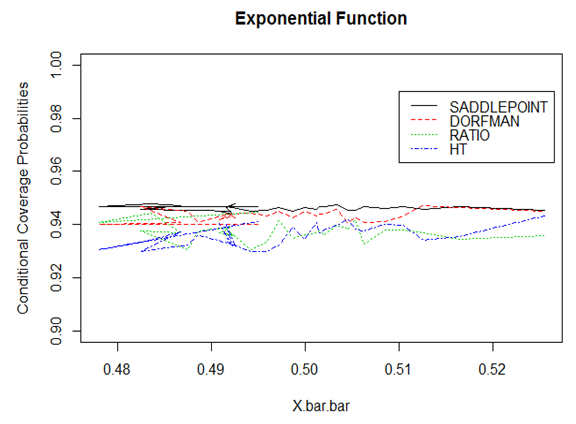 | Figure 10. Conditional coverage probabilities for the Exponential function |
From Figures, 8, 9 and 10, the estimator based on Saddle point approximation outperformed all the other estimators except in the linear function. The ratio estimator which is quite unstable for the quadratic function performed better than all the other estimators in the linear function which is attributed to the fact that it is BLUE.
5. Conclusions
The proposed an estimator gave a smaller bias and MSE and a confidence interval that was shorter and tighter compared to the other estimators (the design-based Horvitz-Thompson, model-based ratio and the nonparametric regression estimator due to Dorfman [5] considered in the study.The application of Saddlepoint approximation in computing coverage probabilities performed better than the traditional way of using the central limit theorem and is therefore be recommended for error correction as a result of skewness and kurtosis.
ACKNOWLEDGEMENTS
We are greatly indebted to the staff of the department of statistics and actuarial science of the Jomo Kenyatta University of Agriculture and Technology.
References
| [1] | Bardoff, O. and Cox, D. R. (1979). Edgeworth and saddle point approximations withstatistical applications. JROST, 41: 279–312. |
| [2] | Breidt, F. and Opsomer, P. (2005). Model-Assisted estimator for Complex Surveys using Penalized Splines. Bimetrica, volume 92, Issue 4. |
| [3] | Chambers, J. M. (1967). On Methods of Asymptotic Approximation for Multivariate Distributions. Biometrica, UK. |
| [4] | Daniels, H. E. (1987). Saddlepoint approximations. Annals of Mathematical Statistics, 25: 631–650. |
| [5] | Dorfman, A. H. (1992). Nonparametric regression for estimating totals in finite population. Journal of the American Statistical Association, 4: 622–625. |
| [6] | Dorfman, A. H. (1993). A comparison of design based and model-based estimators of the finite population distribution. 35: 29–41. |
| [7] | Dorfman, A. H. and Hall, P. (1992). Estimators of the finite population distribution function using nonparametric regression. 21: 1452–1475. |
| [8] | Easton, G. S. (2008). General saddlepoint approximation with applications to L statistics. Journal of the American Statistical Association, 81: 420–430. |
| [9] | Hirsen, E. B. (2009). Non Parametrics. Winconsin, New York. |
| [10] | Laszlo, G. A., K. M. and Walk, H. (2002). A Distribution Free-Theory of Nonparametric Regression. Springer-Verlag, New York. |
| [11] | Lugannani, R. and Rice, S. (1980). Saddle point approximation for the distribution of the sum of independent random variables. Advances in Applied Probability, 12: 475–490. |
| [12] | Odhiambo, R. and Mwalili, S. (2000). Nonparametric regression for finite population estimation. East African Journal of Statistics, II (Part 2): 107–118. |
| [13] | Ombui, T. (2008). Robust Estimation of Finite Population Total Using Local PolynomialRegression. Thesis, Jomo Kenyatta University of Agriculture and Technology. |
| [14] | Valliant, R., Dorfman, A. and Royall (2000). Finite Population Sampling and Inference. A prediction Approach. Willey and Sons, New York. |

 Abstract
 Reference
 Full-Text PDF
 Full-text HTML