-
Paper Information
- Previous Paper
- Paper Submission
-
Journal Information
- About This Journal
- Editorial Board
- Current Issue
- Archive
- Author Guidelines
- Contact Us
International Journal of Statistics and Applications
p-ISSN: 2168-5193 e-ISSN: 2168-5215
2020; 10(1): 17-23
doi:10.5923/j.statistics.20201001.03

Automation of Balanced Nested Design; NeDPy
 Abstract
 Reference
 Full-Text PDF
 Full-text HTML
Marcel Tochukwu Obinna, Uchenna Petronilla Ogoke, Ethelbert Chinaka Nduka
Department of Mathematics and Statistics, University of Port Harcourt, Port Harcourt, Nigeria
Correspondence to: Marcel Tochukwu Obinna, Department of Mathematics and Statistics, University of Port Harcourt, Port Harcourt, Nigeria.
| Email: |  |
Copyright © 2020 The Author(s). Published by Scientific & Academic Publishing.
This work is licensed under the Creative Commons Attribution International License (CC BY).
http://creativecommons.org/licenses/by/4.0/

This work was done considering the principle of automating nested designs. It was aimed at developing a user friendly statistical package (NeDPy) that can be used to analyse experiment that has nested factor(s). NeDPy was coined from “NESTED DESIGN PYTHON” and was developed using python programming language. Python modules like NumPy, Scipy, Matplotlib, Tkinter etc. was used to develop a user-friendly app with GUI (graphical user interface) that can analyse a two-stage and three-stage nested design to produce all relevant information. These include, indicating significant factor(s), creating ANOVA table, giving estimate for model and variance component, descriptive analysis, generating the residuals of the data set, drawing diagnostic plots like normal probability plot, box plot etc. NeDPy was used to solve problems from some cited sources where the problem has been solved both manually and using some trusted software. Some important results were compared and found to be identical. This validates NeDPy and makes it a recommendable statistical package for analysing nested design.
Keywords: NEDPY, Program for nested design, Two & three stage nested design
Cite this paper: Marcel Tochukwu Obinna, Uchenna Petronilla Ogoke, Ethelbert Chinaka Nduka, Automation of Balanced Nested Design; NeDPy, International Journal of Statistics and Applications, Vol. 10 No. 1, 2020, pp. 17-23. doi: 10.5923/j.statistics.20201001.03.
Article Outline
1. Introduction
- Experimental design is the branch of statistics that deals with the design and analysis of experiment. It involves the laying out of a detailed experimental plan for efficient analysis of an experiment. It is used in experiment to; Determine the effect of the levels of the control variables. Determine which control variable has significant influence on the response variable.Determine the settings of the influential variables so as to obtain an optimal values of the response variable [1]. Experimental design is used in many areas such as agriculture, ecology, medicine, and industrial experimental processes. Nested design is a type of experimental design used to analyse data set with nested factor(s). An experiment is said to have a nested factor if the levels of one factor (nested factor) occurs uniquely with only one level of the other factor. In modern science, nested designs have numerous real life applications. For example, consider a genetics experiment with females nested in males. We need to be able to identify the father of the offspring, so we can only breed each female to one male at a time. However, if females of the species under study only live through one breeding, we must have different females for every male. In this case female is nested under male. We do not simply choose to use a nested model for an experiment. We use a nested model because the treatment structure of the experiment are nested, and we must build our models to match our treatment structure. The design and execution of such experiments is often done during every day work without support from a statistical expert thus it is important to have a software available that can be easily used by non-experts. At the same time, statisticians are often involved in the more important industrial experiments, and there are many facets to construction of such experiments for which a statistician very much appreciates support from a statistical software [2]. The aim of this work is to develop a user friendly statistical package NeDPy that can be used to analyse experiment with nested factor(s). This aim is broken down into achievable objectives namely; Develop a user friendly interface using the G.U.I (graphical user interface) package Tkinter so the app can easily interact with the user. Build in functionality that can provide relevant analysis such as ANOVA table, descriptive analysis, estimate the model parameters and variance component, perform diagnostics check using plots etc. Use NeDPy to analyse data from solved examples. Compare results from NeDPy and results from solved examples to validate NeDPy.
1.1. Statement of Problem
- Although many data in real life situation in areas such as agriculture, medicine, etc. have data structure that conforms with the nested structure, there are no many software packages available to readily analyse these data set. Most available software packages (e.g. R, SAS, Stata) for analysing data set with nested structure still lacks a graphic user interface that makes them unwieldy to use by individuals with no prior knowledge in coding and statistics.
1.2. Scope of the Research
- The software developed is limited to the case of a two and three stage balanced nested design. This implies that the study studies experiment with two or three factors say A, B and C; it is limited to the case where all the data at all levels are available i.e. there are no missing data in the experiment.
1.3. Literature Review
- Interest in statistical computing began not with the invention of the personal computer in the 1980s or even with the rise of the large mainframe computer during the 1960s. Statistical computing became a popular field for study during the 1920s and 1930s, as universities and research labs began to acquire the early IBM mechanical punched card tabulators. They used these machines not only for tabulating and computing summary statistics but also for fitting more complicated statistical models such as analyses of variance and linear regressions [3]. Since then several field in statistics make use of computers to solve statistical problems. Experimental design is not left out as several statistical packages have been built to analyse a wide range of experimental designs. Nested design have received a relatively poor attention from programmers. Some popular and readily available statistical software such as Design Expert, SPSS, NCSS, Excel, JMP etc. has no in-built functionality for the direct computation of nested design. R has an inbuilt function for nested design, the lme function in nlme can be used to analyse nested design, [4]. This method might not be easy to use for non-statisticians and non-programmers since it involves writing code. The Stata statistical package can also be used for nested design but also involves code writing [5]. SAS statistical package must be commended for the wide range of analysis it performs on nested data but its complex nature in both using and interpreting the solutions still poses a problem to the general and easy use of SAS. Matlab, a programming language that has generally gained the acceptance of statisticians as a tool for data analysis in recent times also does not have any functionality for nested design. Minitab has functionality for nested design and a friendly interface [6] but licensing and buying the package still makes it inconvenient and unhandy to use .In python the DOE module addresses a wide range of experimental design, they include factorial, 2-level fractional factorial, Plackett-Burman, Sukharev grid, Box-Behnken, Box-Wilson (Central-composite) with centre-faced option, Latin hypercube (simple), Latin hypercube (space-filling), Random k-means cluster, Maximin reconstruction, Halton sequence based, Uniform random matrix. There are no inbuilt function in the python pyDOE module that address nested design [7,8]. However the Spm1d module after modifications can be used to address nested design [9].
2. Method
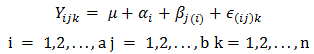
- NeDPy (the statistical package) was developed using python. Python is a programming language that is simple in syntax and most widely used for data analysis, exploratory computing and data visualization. Pythons improved library support (primarily pandas) has made it a strong alternative for data manipulation tasks. Combined with Pythons strength in general purpose programming, it is an excellent choice as a single language for building data-centric applications [10]. Python has so many inbuilt module and Libraries that makes it convenient and competent for data analysis. Most of the important Python Libraries used for data analysis were used to develop this app. Some of the very important ones are: Scipy NumPyPandas Matplotlib Seaborn Tkinter, Python’s standard GUI (Graphical User Interface) package was used for the development of NeDPys Interface. Tkinter is used to make NeDPy an easy to use software with a very friendly interface with no complexities in handling. Therefore no prior knowledge of coding or any tutorials on how to use the app is needed to get started with it.The two-stage nested effects model is:
|
 The model for a three- stage nested design is;
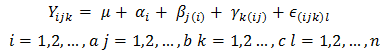
|
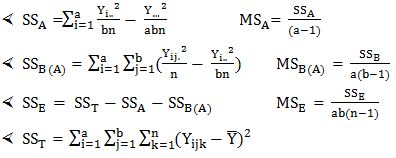
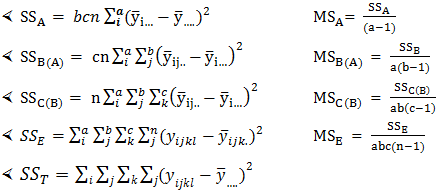 Variance Component: To estimate variance components, using the ANOVA method yields the following equation for the two-stage
 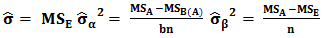 And the following for three-stage;
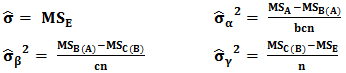 Diagnostic Checking: The major tool used in diagnostic checking is the residual analysis. For the two stage nested design, The fitted value are given by;
 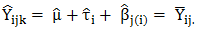 Thus, the residuals are
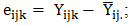 Where
Where  are the mean values of each level of Factor B (within A).For the three stage nested designThe fitted value are given by;
 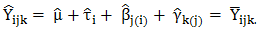 Thus, the residuals are
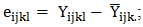 Where
Where  are the mean values of each level of Factor C (within each B within each A).The usual diagnostic checks which are normal probability plots, checking for outliers, and plotting the residuals versus fitted values are all performed to check for abnormalities. Presence of outliers in the plot indicates the presence of abnormalities [6].
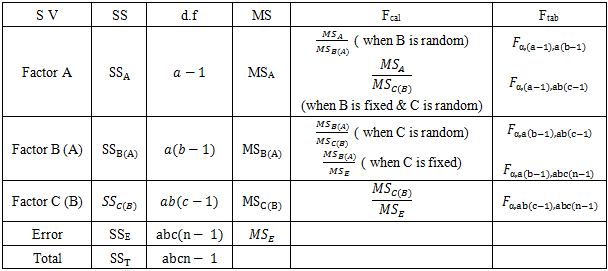
3. Computation and Result
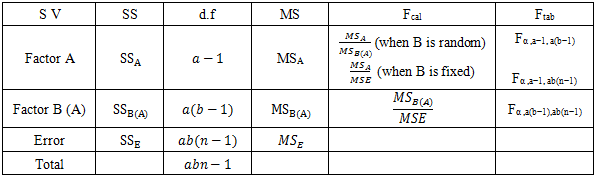
- Computations done by NeDPy There are several computations done by NeDPy they include;• Clearly indicating the significant factor(s) in an experiment.• Production of an ANOVA table• Descriptive analysis of data• Estimation of variance component• Estimation of model parameters• Computation of Residuals• Use of graphs for diagnostic check etc.Summary of NeDPy instruction manual: NeDPy is an easy to use statistical package. After Installing NeDPy to your PC, click on the NeDPy icon this will open the NeDPy introductory interface, click on the Get Started button to open the interface where you select the stage of nested design you are using. When the interface for that stage is launched, go to the combo box and select the level of each of the factors as well as its no of replications, select the type of factors for each of the factor (random or fixed) and state the level of significance for the test. Note that although by default =0.05 you can indicate any level of significance. All these features were built to make it flexible for balanced nested design of any kind with two or three factor(s). Go to display on your menu bar and click on entry space, input in the required data in the space that appears on the screen according to specification (see figure 1 & 2 below). Perform any analysis of your choice. Save or Print your result. NeDPy saves text document to notepad with the extension *txt. and graphs to jpg by default. To exit click on Exit on your Menu Bar.
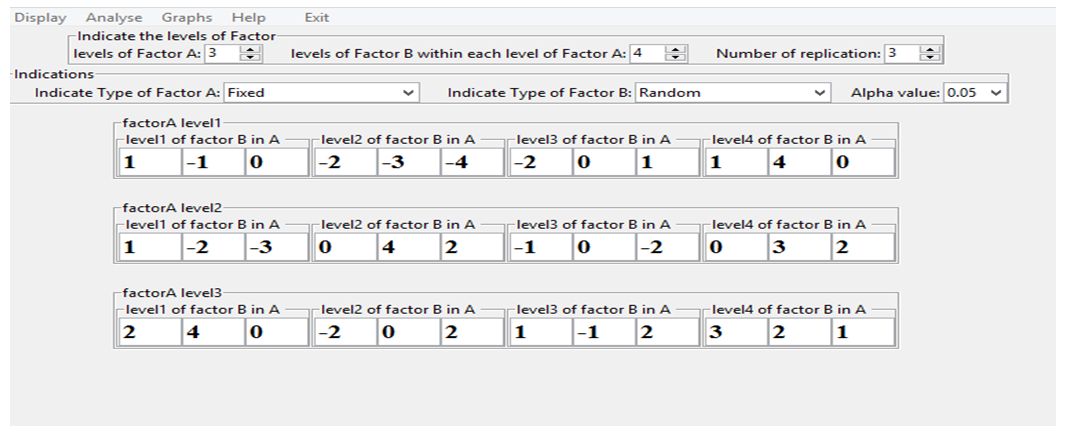 | Figure 1. Entry view (two-stage) |
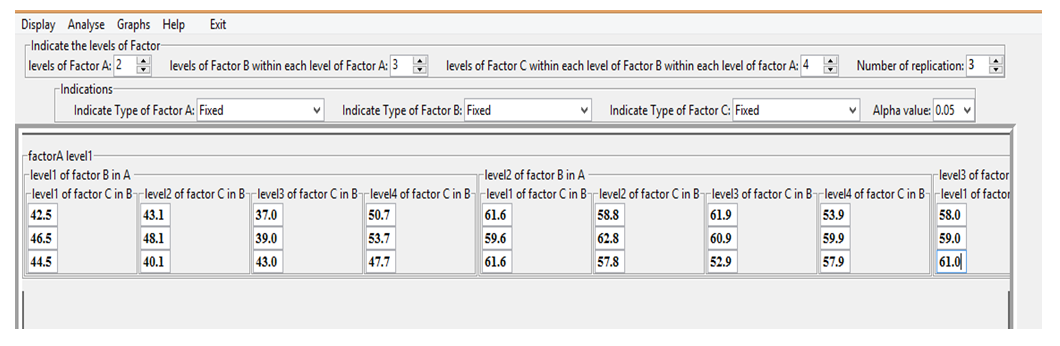 | Figure 2. Entry view (three-stage)PRACTICAL EXAMPLES |
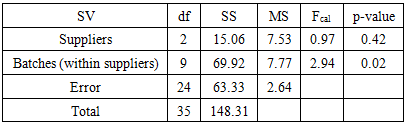 Remark: At 5% level of significanceFactor A is not significantFactor B is SignificantANOVA result from NeDPy
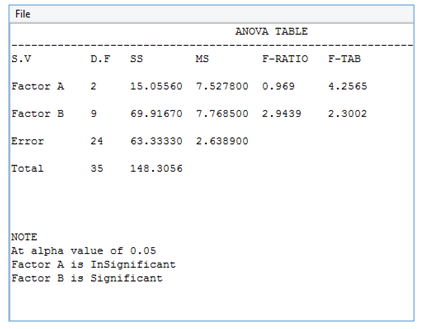 Variance Component from solved example:This result is extracted from appendix III
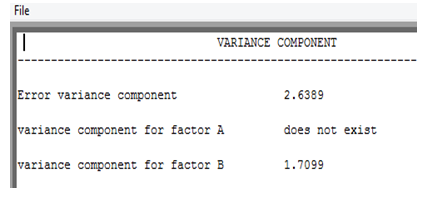 Example 2: This example was adapted from http://www.math.montana.edu/jobo /st541/sec5b.pdf [11]. In this example two cases of three stage nested design is seen. Case 1 with factor A & B fixed and C random and Case 2 with A fixed and B & C Random. The both case made use with the same data set.ANOVA result from solved example Case 1 ResultThis table is extracted from appendix IV
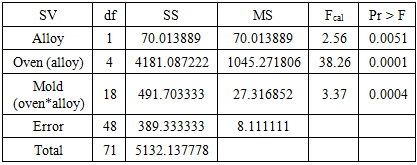 Remark:• The tests for oven(alloy) and mold(oven*alloy) are significant with p-values of < .0001 and .0004, respectively.Therefore Factor B and Factor C are significant. ANOVA result from NeDPy Case 1 Result
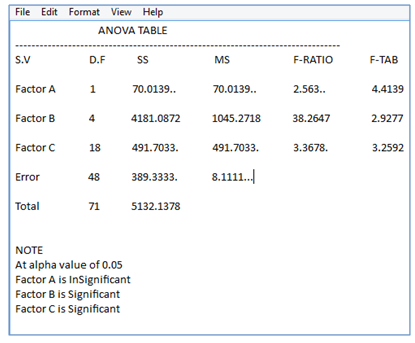 Variance Component from solved example Case 1 Result
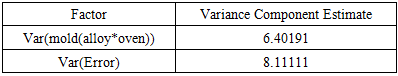 Variance Component from NeDPy Case 1 Result
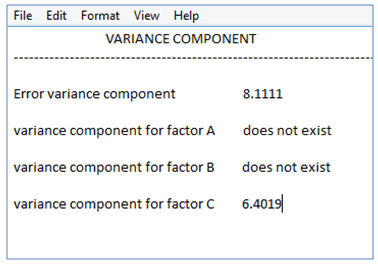 ANOVA result from solved example Case 2 ResultThis table is extracted from appendix V & VI
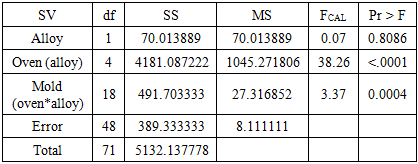 Remark:• The tests for variance components for oven(alloy) and mold(oven*alloy) are significant with p-values of < .0001 and .0004, respectively.Therefore Factor B and Factor C are significant.ANOVA result from NeDPy Case2 Result
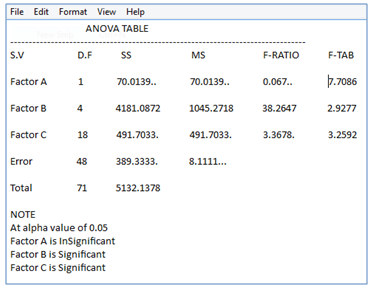 Variance Component from solved example Case 2 ResultThis table is extracted from appendix X
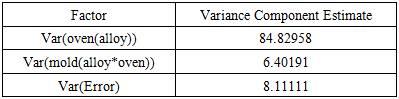 Variance Component from NeDPy Case 2 Result
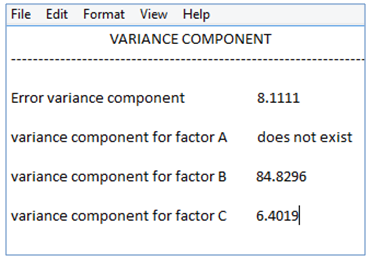
4. Discussion of Result
- The results of the solved examples were compared with the result produced by NeDPy, and it was found to be identical in every way, having similar values up to 4d.p. The output from example 1 was solved manually and analysed using Minitab software while the two cases from example 2 were solved using SAS programming language. The above stated softwares and sources are reliable, hence this validates NeDPy.
4.1. Recommendation for Further Study
- More complex forms of Nested Design are gaining more industrial application such as unbalanced nested design, nested block designs [12],. Split factorial [13], assembled design, (a special case of nested design) [14] etc. All these forms do not have direct computation from software’s. Further studies should find ways for direct computations of these forms of nested design.
4.2. Conclusions
- NeDPy is an example of a statistical package with a friendly GUI. It has proven to be a reliable package that can be used to analyse data set with nested factor(s). It obviously provides all the relevant information a researcher needs from a data set involving 1 or 2 nested factor(s).To get this program contact the author at (marceltobinna@gmail.com).
ACKNOWLEDGEMENTS
- I want to give special thanks to Boma Gorge for his technical assistance in the production of NeDPy and also to Raphael Binite for his assistance in development of the graphics designs used to make this work a reality.