Chiwa Musa Dalah1, V. V. Singh2, Ibrahim Abdullahi2, A. A. Suleiman3
1Department of Mathematics and Statistics, Yobe State University, Damaturu, Nigeria
2Department of Mathematics, Yusuf Maitama Sule University, Kano, Nigeria
3Department of Statistics, Kano University of Science and Technology, Wudil, Nigeria
Correspondence to: V. V. Singh, Department of Mathematics, Yusuf Maitama Sule University, Kano, Nigeria.
| Email: |  |
Copyright © 2020 The Author(s). Published by Scientific & Academic Publishing.
This work is licensed under the Creative Commons Attribution International License (CC BY).
http://creativecommons.org/licenses/by/4.0/

Abstract
The effect of the Human Immunodeficiency Virus/Acquired Immune deficiency syndrome (HIV/AIDS) global epidemic continue to emerge decades after the first wave of infection. Since the start of the epidemic, many measures have been taken by the government and non-governmental organizations to control the outbreak. In Yobe State, the programs implemented include enlightenment, HIV/AIDS testing, and counseling, free drugs, and therapy. The State is mainly an agricultural state created out of the old Borno State on 27 August 1991. With an estimated population of about 2.5 Million, Yobe state covers a total of 54, 428sq km land area, the state borders the Nigerian states of Bauchi, Borno, Gombe, and Jigawa. It borders the Diffa Region and Zinder Region to the north in the Republic of Niger. Because the state lies mainly in the dry savanna belt, the State is dry and hot for most of the year except in the southern part of the state, which has a milder climate. This study has looked at the trend of the epidemic in the state. Statistical time series trends were used in analyzing the data. Three methods of fitting trend of a time series data namely, linear trend, quadratic trend and exponential trend were employed to fit the data of HIV patients on ART. The linear trend model has MAPE, MAD and MSD values of 24.8, 147.5 and 31767.8 respectively. The quadratic model provides respective accuracy measures as MAPE=21.6, MAD=138.8 and MSD=26780.5. An exponential model gives MAPE=22.4, MAD=144.7 and MSD=29265.7. The result indicated that the quadratic model with the smallest accuracy measures have been the best and most suitable mathematical model to fit the dataset.
Keywords:
HIV/AIDS, ART, Counseling, Testing, Epidemic
Cite this paper: Chiwa Musa Dalah, V. V. Singh, Ibrahim Abdullahi, A. A. Suleiman, The Study of HIV/AIDS Trend in Yobe State for the Prescribed Period (1999 – 2019), International Journal of Statistics and Applications, Vol. 10 No. 1, 2020, pp. 10-16. doi: 10.5923/j.statistics.20201001.02.
1. Introduction
HIV/AIDS (Human Immunodeficiency Virus/Acquired Immune Deficiency Syndrome) has affected many people in the world, leading to their death since the early 1980s. The numbers of people affected by the virus continue to rise, and many attempts have been made to produce drugs/vaccine to control the virus, but up to now, a concrete solution has not been found.Nigeria has passed through several phases in her response to the AIDS epidemic. The stages included an initial period of denial, a large health sector response, and now a multi-sectoral response that focuses on prevention, treatment, and mitigation of impact interventions and divorces coordination and implementation as distinct response components. A central body is dedicated to leading and coordinating the response, while the various sectors, including Civil Society Organizations (CSO), faith-based organizations, and networks of people living with HIV and AIDS support groups, focus on packaging and implementing interventions based on a national action plan.The health response commenced with the setting up of an ad hoc National Expert Advisory Committee on AIDS (NEACA) in 1987. By 1988, the National AIDS and STDs Control Programme (NASCP) was formally established, with state counterparts set up thereafter to organize as well as to coordinate all HIV and AIDS activities at national and state levels. Federal Ministry of Health's HIV & AIDS division and High risk groups including brothel-based sex workers, non-brothel based sex workers, men having sex with men, injecting drug users, uniformed servicemen (Armed forces and Police) and transport workers, (Formerly known as NASCP) played a key role in developing guidelines on critical interventions and monitoring of the epidemic. In 1997, the National Council on Health formally endorsed the multi-sectoral approach, and in 2000 the Federal Government of Nigeria commenced the implementation of this approach with the establishment of a Presidential Council on AIDS (PCA) and National Action Committee on AIDS (NACA). NACA has been transformed from a committee to an agency and now called National Agency for the Control of AIDS (NACA) for effective coordination of the national multi-sectoral response to HIV & AIDS. An HIV & AIDS Emergency Action Plan (HEAP) initiated in 2001, which ran through 2004. The partners involved in implementing the plan included governmental institutions, non-governmental organizations, community-based organizations, faith-based organizations, and persons living with or affected by HIV and AIDS. As part of renewed efforts, Nigeria launched a revised HIV and AIDS policy and a five year (2004-2008) National HIV and AIDS Behavior change communication strategy in 2003 and 2004, respectively. The country also launched the Nigeria National Response Information Management System (NNRIMS) for HIV and AIDS (NACA, 2004). The NNRIMS has been reviewed, and an operational plan (2007 – 2010) has been developed. Failure of access to HIV & AIDS treatment and services by the people needing them has prompted a rapid scale-up of the national response and made it appropriate to align the NNRIMS framework with issues articulated in the National Strategic Framework (NSF) as well as in the Nigeria road map moving towards Universal Access (UA) for prevention, treatment and support. This is done in collaboration with donors and partners. The Federal Ministry of Health has recently undertaken an intensive review of the health sector HIV and AIDS response and developed the Health Sector Strategic Plan. The HIV and AIDS National Strategic Framework for Action (2005-2009) were developed under the leadership of NACA to replace HEAP with the intention of significantly scaling up the antiretroviral treatment program. The country also completed a policy document titled "Plan to scale-up antiretroviral treatment for HIV and AIDS in Nigeria 2005-2009" with the overarching goal of improving the survival, quality of life, and productivity of people living with HIV and AIDS (PLWHAs).The HIV and AIDS response in Nigeria subscribes to the principle of “Three Ones”: × One agreed on AIDS Action Framework that provides the basis for coordinating the work of partners;× One national AIDS Coordinating Authority, with a broad-based multisectoral mandate;× One agreed on the country level Monitoring and Evaluating system (FMOH 2005a, FMOH & WHO 2005).The Nigerian government has also continued to be pro-active in its efforts to confront the HIV scourge with its overarching strategy elaborated in the bottom-up, poly-stakeholder, and multi-sectoral National Strategic Plan (NSP). The NSP is derived from the architecture of the National Strategic Framework 2010-15 (NSF II) and has targets to halt and begin to reverse the spread of HIV infection, as well as mitigate the impact of HIV & AIDS by 2015. With the condition that where appropriate, the targets of the NSP should be population-based, the Federal Government of Nigeria implicitly recognizes HIV care and treatment as national public health good.HIV prevalence in Nigeria is high, considering the vast population (about 180 million), and the rate is higher than that of sub - Saharan African estimate of 3.4% (PRB, 2012). About 3.5 million people in Nigeria are estimated to be living with HIV/AIDS, and the estimated number of new infections and HIV/AIDS-related deaths was 390,000 and 217,000 respectively, in 2013 (General Population Survey, 2013). In Northeastern Nigeria where Yobe state is located, most of the people live in rural areas; the spread of HIV/AIDS causes include sexual activities of adolescents and young adults (standing and kisekka, 1989, Renne, 1993, kinsman et al. 2000) polygamy and multiple sexual partners, illiteracy, ignorance, and poverty (Nnko et al., 2007, Abdoolkarem et al., 1992). According to Baker et al. (2010), many research finding has shown that higher education level is associated with a lower level of risk of being infected with HIV/AIDS. The investigator’s Musa Chiwa Dalah & V. V. Singh (2017) have presented a Survey and Assessment Report of HIV/AIDS Awareness in North-Eastern Nigeria. Chiwa Musa Dalah, V. V. Singh, (2018) has suggested the corrective Measures for controlling of HIV/AIDS in North-Western Part of Nigeria through statistical assessment. Chiwa, Musa Dalah et al. (2019) have presented a statistical survey report on awareness and knowledge of sexually transmitted infections [STIS] in the North-Eastern part of Nigeria through the collected data from hospitals from Yobe state.This study has found out the trend of HIV/AIDS in Yobe State using secondary data from Yobe state ministry of health via Yobe state agency for the control of aids (YOSACA) for the period 1999 – 2019. The aims of this study are to analyze the data on the prevalence rate of HIV/AIDS and those on antiretroviral therapy in Yobe state for the stated period to see whether it is increasing or decreasing and to find out the possible reasons for the changes.
1.1. Brief Review of Geographical Aspect of Yobe State
Yobe State is a mainly agricultural state created out of the old Borno State on 27 August 1991, by the military government of General Ibrahim Babangida. With an estimated population of about 2.5 Million, Yobe State's ethnic composition has a rich and diverse historical and cultural heritage. There are five major ethnic groups in the state, which include the Kanuri, Fulani, Karekare, Bade, and Hausa.Yobe state covers a total of 54, 428sq km land area, the state borders the Nigerian states of Bauchi, Borno, Gombe, and Jigawa. It borders the Diffa Region and Zinder Region to the north in the Republic of Niger. Because the state lies mainly in the dry savanna belt, the State is dry and hot for most of the year except in the southern part of the state, which has a milder climate. 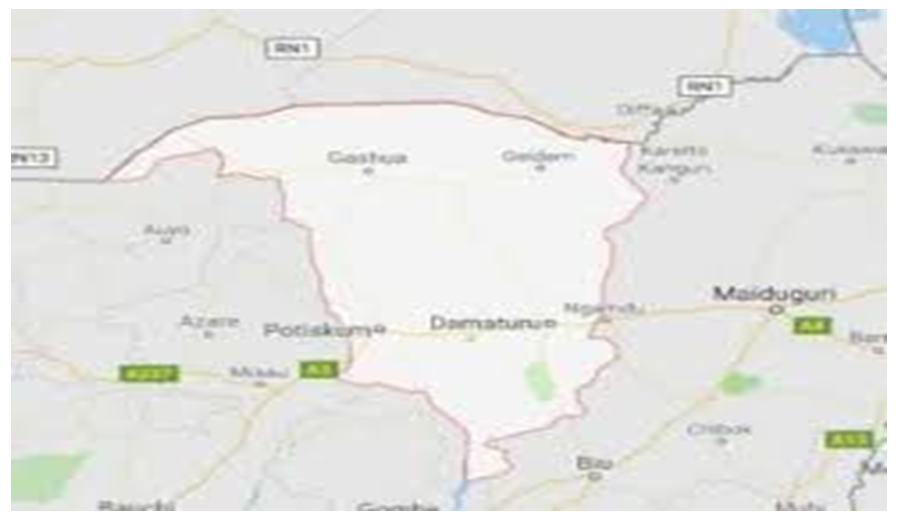 | A GEOGRAPHICAL MAP OF YOBE STATE, NIGERIA |
The study was divided into the following sections. Section 1 of this study is an introduction that involves the literature review, and related studies are explained together with brief information about the Geographic and physical structure of Yobe State, which have considered for focus. Section 2 is the methodology adopted for analysis. Section 3 presents the main results of the HIV prevalence rate in the state from the data collected from (YOSACA) during 1999- 2019. The results have been represented by graphs and charts. Section 4 is the conclusion part in which the authors have claimed that the trend of HIV/AIDS is the declining trend in the present time.
2. Methodology
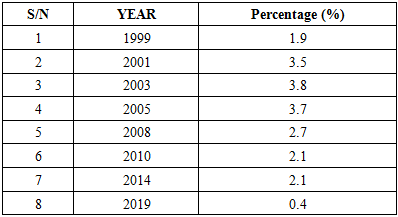
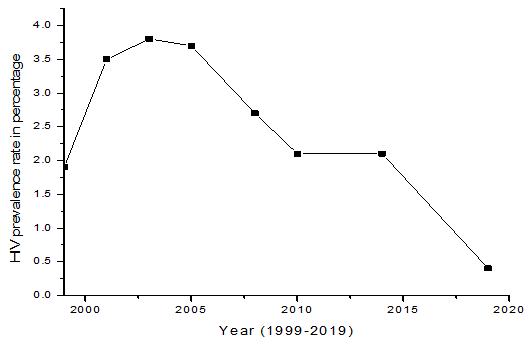
In this study, secondary data from Yobe state ministry of health via Yobe state agency for the control of AIDS (YOSACA) for the period 1999 – 2019 wasanalyzed, and yearly percentage of variation have computed. The regular data was not available; therefore, the percent variation was computed, which has presented in Table 1. The data wasanalyzed using statistical methods and techniques to determine the trend of the epidemic in the state for the stated period. The yearly percent variations have plotted in the graph presented in figure 1 with the declining trend of HIV prevalence rate.
2.1. Time Series
Time series is a bivariate data involving time. It is a set of quantitative observations collected over period of time. The period of time could be daily, monthly, quarterly, yearly and so on. In graphical display of data on time series, the time is plotted on the horizontal axis and the dependent variable on vertical axis.A time series can be expressed in mathematical functions given by  , where
  is the time and
  is the variable of interest which presents the future trend of dependent variable with variation of time t. The trend of data can variation can be study by various methods some of them are highlighted as:i. Linear Trend EquationThe linear trend model is:
 | (1) |
where  is the constant term,
  is the average change from one period to the next,
  is the value of the time unit and
  is the error term.ii. Quadratic Trend EquationThe quadratic trend model, which can account for simple curvature in the data, is:
 | (2) |
where the terms are as defined above.iii. Exponential Growth Trend EquationThe exponential growth trend model accounts for exponential growth or decay. The model is: | (3) |
where the terms are as defined above.The Minitab statistical software was used to determine the trend equation in this work.
2.2. MAPE
Mean absolute percentage error (MAPE) measures the accuracy of fitted time series values. It is used compare the fits of different time series models. Smaller values indicate a better fit. MAPE expresses accuracy as a percentage. It is given as | (4) |
Where  is the actual value at time
  is the fitted value and
  is the number of observations.
2.3. MAD
Mean absolute deviation (MAD) measures the accuracy of fitted time series values. It is used compare the fits of different time series models. Smaller values indicate a better fit. MAD expresses accuracy in the same units as the data, which helps conceptualize the amount of error. It is given by | (5) |
where the terms are as defined above.
2.4. MSD
Means squared deviation (MSD) is always computed using the same denominator,  regardless of the model. It is used compare the fits of different time series models. Smaller values indicate a better fit. MSD is a more sensitive measure of an unusually large forecast error than MAD. It is computed as
  | (6) |
where all the variable are as defined above.
4. Results
The data in Table 1 and the graph in figure 1 have shown that the prevalence rate of HIV is declining in the state. From 1999 it continues to rise, but from 2005 it starts to decline up to date, and it is expected to continue declining in the next coming years. All these may be due to the high awareness and knowledge of HIV/AIDS among the people of the state. Most people are aware of how HIV/AIDS can be contracted, controlled, and how it can avoided. The federal government through the national agency for the control of AIDS (NACA) and the state government through Yobe state agency for the control of AIDS (YOSACA), implementation partners on areas of HIV/AIDS services (IP) are implementing various programs on awareness creation, HIV testing services (HTS), prevention, treatment care, and support services to control the epidemic.Table 1. HIV PREVALENCE RATE
 |
| |
|
 | Figure 1. HIV prevalence rate in percentages |
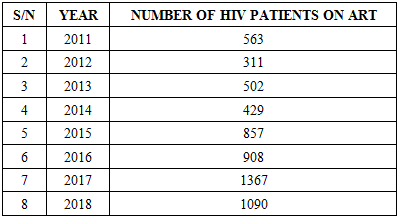
The data in table 2 and the graph in figure 2 and 3, have shown that the number of the patient on Antiretroviral therapy (ART) has fluctuated from 2011 to 2014. While the graph shows a steady increase from 2014 to 2017, this is due to the increase in the number of ART sites from 4 to 6 in 2014 in the state and the global test and treatment policy that was adopted by Nigerian governments.Table 2. Number of HIV patient on ART
 |
| |
|
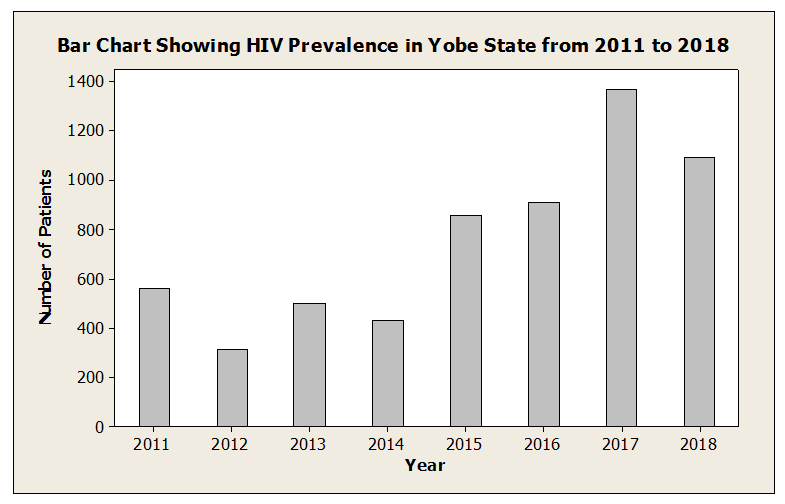 | Figure 2. Bar Chart for HIV prevalence |
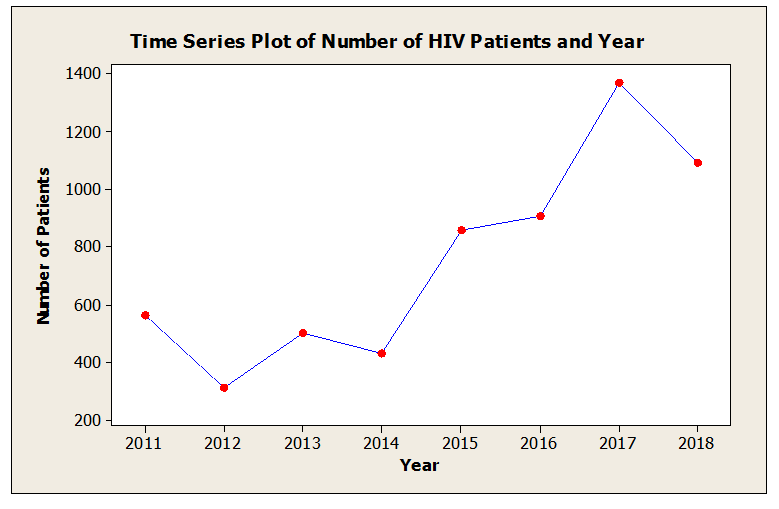 | Figure 3. Trend of year v/s Number of HIV Patients on ART |
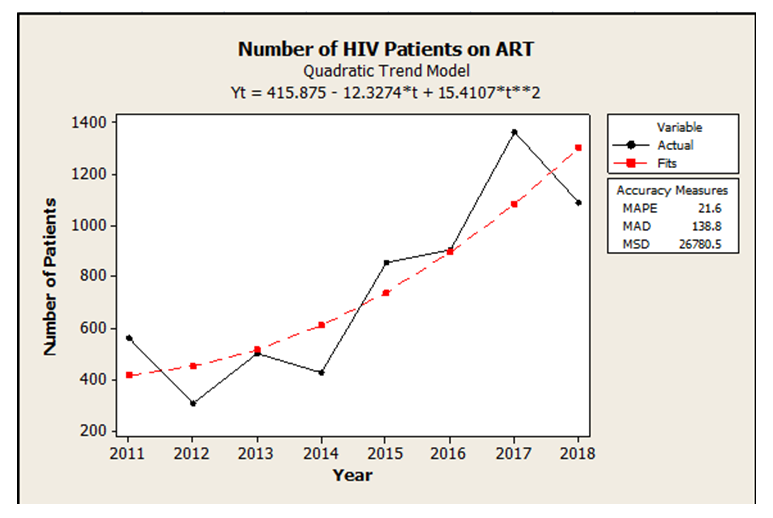
However, three methods of fitting trend of a time series data namely, linear trend, quadratic trend and exponential trend were employed to fit the data of HIV patients on ART. Figure 4 is a graph of linear trend model with MAPE, MAD and MSD values of 24.8, 147.5 and 31767.8 respectively. Figure 5 shown a quadratic model with respective accuracy measures as MAPE=21.6, MAD=138.8 and MSD=26780.5. Figure 6 displayed an exponential model with MAPE=22.4, MAD=144.7 and MSD=29265.7. The result indicated that the quadratic model which has the smallest accuracy measures have been the best and most suitable mathematical model to fit the dataset.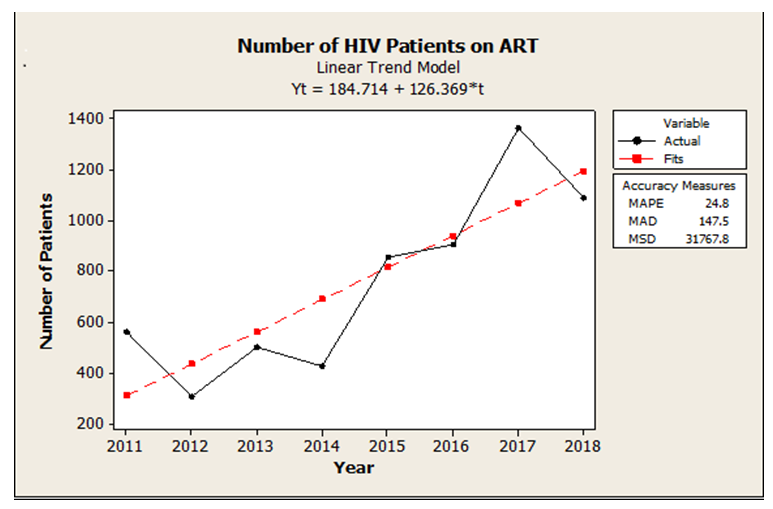 | Figure 4. Linear Trend Model of HIV Patient on ART |
 | Figure 5. Quadratic Trend Model of HIV Patient on ART |
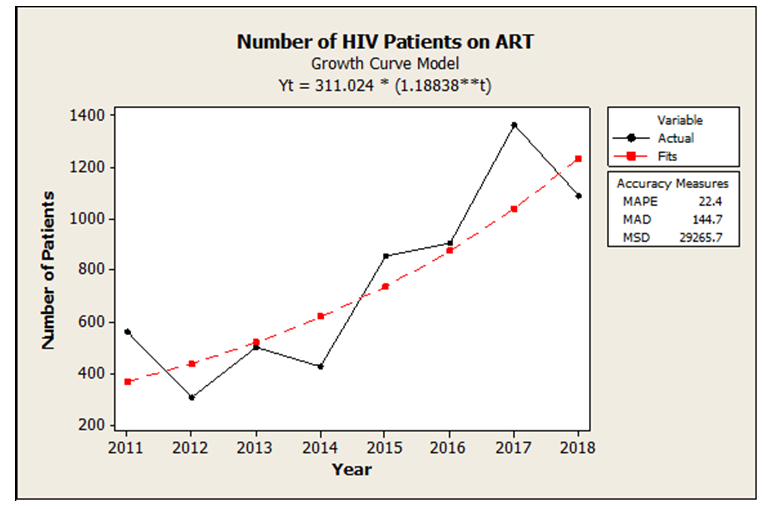 | Figure 6. Exponential Growth Trend Model of HIV Patient on ART |
5. Conclusions
From graphical presentations of percent rate of HIV in Table 1 and the corresponding graph, figure 1, it is seen that the trend is declining. This may be due to the high awareness and knowledge of HIV/AIDS among the people of the state. Most of the people are aware of how HIV/AIDS can be contracted, controlled and how it can be avoided and efforts of the federal government through the national agency for the control of AIDS (NACA) and the state government through Yobe state agency for the control of AIDS (YOSACA), implementation partners on areas of HIV/AIDS services (IP) by implementing various programmes on awareness creation, HIV testing services (HTS), prevention, treatment care and support services to control the epidemic.Mathematical trend models have been applied and the most suitable model have been selected that can be applied to any other location.
References
| [1] | Nigeria Aids indicator and impact survey bulletin 2018. |
| [2] | Nigeria (2015). Stepping up HIV/AIDS Awareness in Nigeria, Daily Independent (Lagos). |
| [3] | National HIV & AIDS and Reproductive Health Survey (NARHS Plus II, 2012) Federal Ministry of Health. Abuja, Nigeria. |
| [4] | World Health Organization, Joint United Nations Programme on HIV/AIDS & UNICEF. (2011). Global HIV/AIDS response epidemic update and health sector progress towards Universal Access progress report. Geneva, Switzerland. |
| [5] | Garbati N, Musa A, Abba N, Abdullah A (2011). HIV/AIDS in Northern Nigeria. pp. 176-182. |
| [6] | Baker DP, Leon J. Collins JA (2010). Facts, attitudes, and health reasoning about HIV and AIDS: explaining the education effect on condom use among adults in Sub-Saharan Africa. AIDS Behavior Vol. 15, pp. 1319-1327. |
| [7] | Sa’ad S. M. (2008). The social sciences, the development program (LDP) of the United Nations Development Programme (UNDP), Social Sciences, and the Complex Problems of Nigeria: Combating HIV and AIDS in Nigeria. Paper presented at the National Conference on Social Science and the challenges of the millennium Development Goals (MDGS) in Africa, organized by the Faculty of Social Sciences, University of Maiduguri, Nigeria, 26th – 30th October 2008. |
| [8] | Bankole O.M and Mabekoje O.O. (2008). Awareness and Opinions about HIV/AIDS among secondary school teachers in Ogun State, Nigeria. Scientific Research and Essay Vol.3 (6), pp.245-253. |
| [9] | Bukar A, Olusoji o, Adeleke OA, Danfillo IS, Taiwo OO, Jallo PH (2006). Knowledge and perception on HIV/AIDS among the Kanuri and Shuwa people of Northern Nigeria in relation to their traditional practice. Nig. J. Clin. Biomed. Res... Vol. 36(1), pp. 36 - 43. |
| [10] | Sa’ad, A.M. and Bello, H. (2006). “The Meaning and Origin of HIV/AIDS, Its Seriousness, Its Drivers and Prevention ’’. Paper presented at A Three- Day Workshop on HIV/AIDS for Primary School Head Teachers in Borno State, Nigeria. |
| [11] | Petersen, P.E. (2006) Policy for prevention of oral manifestations in HIV/AIDS: the approach of the WHO Global Oral Health Program. Advances in Dental Research, Vol. 19, pp. 17-20. |
| [12] | Harry T, Mohammed I. (1992). Prevalence of HIV-infection among pregnant women attending ante-natal clinic in Maiduguri, North-Eastern Nigeria. |
| [13] | Chiwa Musa Dalah, V.V. Singh (2017). Survey and Assessment Report of HIV/AIDS Awareness of in North-Eastern Nigeria. International Journals of Advanced Research in Computer Science and Software Engineering, ISSN: 2277-128X, Vol.7 (11), pp.105-112. |
| [14] | Chiwa Musa Dalah, V, V, Singh (2018). A Study towards awareness and corrective measures of HIV/AIDS in north-western part of Nigeria through statistical assessment. Global journal of reproductive medicine, Vol. 5 Issue 3 pp 1- 8. |
| [15] | Chiwa, Musa Dalah, V. V. Singh, M. I. Abubakar, Abdalla E. A. Mohammad (2019). A statistical survey on awareness and knowledge of sexually transmitted infections [STIS] in north-eastern Nigeria. Journal of statistical and Econometric methods. Vol. 8(2), pp. 27-36. |


 , where
  is the time and
  is the variable of interest which presents the future trend of dependent variable with variation of time t. The trend of data can variation can be study by various methods some of them are highlighted as:i. Linear Trend EquationThe linear trend model is:
 is the constant term,
  is the average change from one period to the next,
  is the value of the time unit and
  is the error term.ii. Quadratic Trend EquationThe quadratic trend model, which can account for simple curvature in the data, is:


 is the actual value at time
  is the fitted value and
  is the number of observations.
 regardless of the model. It is used compare the fits of different time series models. Smaller values indicate a better fit. MSD is a more sensitive measure of an unusually large forecast error than MAD. It is computed as


 Abstract
 Reference
 Full-Text PDF
 Full-text HTML
