Asogwa O. C. 1, Eze N. M. 2, Eze C. M. 2, Okonkwo C. I. 1, Ojide K. C. 1
1Department of Maths/Comp. Sc/Stats/Infor, AE Federal University Ndufu Alike Ikwo, Ebonyi State
2Department of Statistics, University of Nigeria, Nsukka
Correspondence to: Asogwa O. C. , Department of Maths/Comp. Sc/Stats/Infor, AE Federal University Ndufu Alike Ikwo, Ebonyi State.
| Email: |  |
Copyright © 2020 The Author(s). Published by Scientific & Academic Publishing.
This work is licensed under the Creative Commons Attribution International License (CC BY).
http://creativecommons.org/licenses/by/4.0/

Abstract
There has been a considerable and continuous interest to develop models for rapid and accurate modeling of students’ academic performances. In this study, an Artificial Neural Network model (ANNm) and a Multiple Linear Regression model (MLRm) were used to model the academic performance of university students. The accuracy of the models was judged by model evaluation criteria like  and
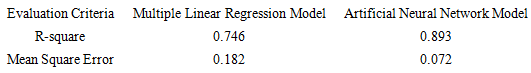
and  The modeling ability of the developed ANN model architecture was compared with a MLR model using the same training data sets. The squared regression coefficients of prediction for MLR and ANN models were 0.746 and 0.893, respectively. The results revealed that ANN model proved more accurate in modeling the data set, as compared with MLR model. This was because ANN model had its
  as against the traditional model which it’s
  was 0.182. Based on the results of this study, ANN model could be used as a promising approach for rapid modeling and prediction in the academic fields.
Keywords:
Academics, Accuracy, Artificial neural network, Modeling and performances
Cite this paper: Asogwa O. C. , Eze N. M. , Eze C. M. , Okonkwo C. I. , Ojide K. C. , On the Efficiency of Multiple Linear Regression over Artificial Neural Network Models, International Journal of Statistics and Applications, Vol. 10 No. 1, 2020, pp. 1-9. doi: 10.5923/j.statistics.20201001.01.
1. Introduction
Predicting students’ academic performances is very vital in educational institutions, especially when admission officers review applications, accurate predictions help them to distinguish between suitable and unsuitable candidates for an academic program and identify candidates who would likely perform well. However, the failure to adhere to strict measures during admission exercises may result in an unsuitable and unsound students being admitted to university or institution. The quality of an educational institution or university is mainly reflected in its research and training. Therefore, the qualities of admitted students affect the quality level of an institution, [1].Moreover, the results obtained from the prediction of academic performances may be also used for classifying students, which enables academic planner to offer them additional support such as customized assistance and tutoring resources. This can also be used by lecturers to specify the most suitable teaching actions for each group of students and provide them with further assistance tailored to their needs. Accurate prediction of student achievement is one way to enhance the quality level and provide better educational services. The quality of candidates admitted into any higher institution affects the level of research and training within the institution, and by extension, has an overall effect on the development of the country itself, as these candidates eventually become key players in the affairs of the country in all sectors of the economy. However, in this research, an Artificial Neural Network model (ANN) that can accurately model academic performances of students in university/institution, based on their pre-admission variables and some other considered socio-economic variables was developed alongside Multiple Linear Regression model (MLR). The study evaluated the performance of the developed models using Network Information Criteria (NIC), Adjusted Network Information Criteria (ANIC), R – Square (R2) and Mean Square Error (MSE).According to [1], an Artificial Neural Network Model was developed to predict the academic performances of students in the Nigeria tertiary institution and the model was able to make about 97% accurate prediction. In addition, [2] worked on the academic performances of Students of Veterinary Medicine, University of Ibadan, Oyo State. The result indicated that the developed model (70 - 80 - 1) was able to accurately model the academic performances of the student at 1000 epoch and 80 neurons. A comparison of artificial neural network model and multinomial logistic regression model was made by [3] and the result agreed that artificial neural network model outperformed multinomial logistic regression model in predicting students’ academic performances. [4] sought to find out a correlation between students’ matriculation exam (UME) scores and their academic performances in Nigerian Universities, using the Faculty of Technology, University of Ibadan, Nigeria as a test case. He investigated the relationship between students’ UME scores, first, second, and final year grade points (GP) with the use of a simple Correlation and Regression Analysis. The conclusion of the research was that there existed a positive relationship between student’s admission scores and their undergraduate performance. [5] summarized the factors and variables affecting students’ performance into the intellective and non-intellective factors, emphasizing that the intellectual abilities were the best measure. Causes of poor academic performance was categorized into four major classes: Causes resident in society, causes resident in school, causes resident in the family and causes resident in the student.The history of Neural Networks begins with the earliest model of the biological neuron given by [6]. This model describes a neuron as a linear threshold computing unit with multiple inputs and a single output of either 0, if the nerve cell remains inactive or 1, if the cell fires [7]. Artificial Neural Networks which sometimes called Neural Networks are information processing systems that are a rough approximation and simplified simulation of the biological neuron network system. The first practical application of Artificial Neural Networks came in the late 1950s when Frank Rosenblatt and his colleagues demonstrated their ability to perform pattern recognition [8]. However, interest in Neural Networks dwindled due to its limitations as well as the lack of new ideas and powerful computers [8]. The two primary elements make up Neural Networks: processing elements, which process information, and interconnections or links between the processing elements. The structure of the Neural Network is defined by the interconnection architecture between the processing elements. Information processing within an Artificial Neural Network occurs in the processing elements that are called neurons which are grouped into layers. Signals are passed between neurons over the connecting links as shown in Figure 1. 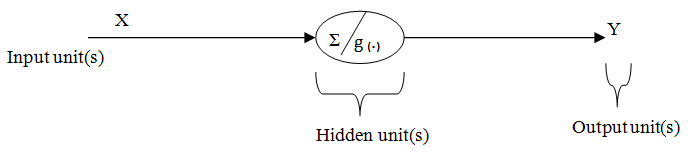 | Figure 1. Diagrammatic representation of the network model design |
In figure 1, there are n - inputs into the network, therefore, there are n- input neurons in the first layer; there is only one output from the network, consequently, there will be one output neuron in the output layer. The optimum number of middle layers and the number of neurons in these layers are determined by trial and error. However in the training / learning process, Multi-Layer Networks (MLP) is generally, more powerful than single-layer networks [8]. Each connecting link has an associated weight, which, in a typical Neural Network, multiplies the signal being transmitted. Each neuron applies an activation function, g (.), (usually non-linear) to its net input to determine its output signal [9]. The middle layers in the network are used to develop an internal representation of the relationship between the variables and are chosen to satisfy a specific problem that the neurons are attempting to solve. Through this process, which is known as training, the output neurons are taught to give the correct answer depending on the stimulus presented to the input neurons.
2. Materials and Methods
A secondary data that was collected from the student’s files of the faculty of veterinary medicine, University of Ibadan from 2014- 2018 were used in this research work. Only files with complete records were compiled and used. A total number of 420 files were collected and used. In this work, Through extensive insight on literatures, we were able to identify and harmonized some of the socio-economic, biological, environmental, academic, and other related factors like pre-admission information that have significant influences on the academic performance and promotion rates of university students. These factors identified were gender, parents’ marital status, parents’ educational status, parents occupation, O’level result, age at entry, time delay before admission, type of secondary school attended, location of secondary school attended, post UMTE, physically impaired and performance outcome of the students. This information which were collected from the students’ records were carefully studied and harmonized into a manageable number suitable for computer coding with the context of the Artificial Neural Network and Multiple linear regression modeling. These influencing factors were categorized as input variables (units) while the output variables, which represent the student’s performance outcomes, assessed by GPA. MatLab R2009a was used as a statistical tool for the analysis. A Multi-Layer Artificial Neural Network (ANN) model with a linear link function, trained with back- propagation algorithm was developed. The developed model architecture Artificial Neural Network (ANN) model proposed by [10] was used in this research work. The model is given below with consideration of linear transfer function (this calculates the nets of the neurons). | (1) |
This implies that  | (2) |
and considering 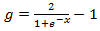 The model is then given by
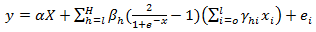 | (3) |
Where  is the linear transfer function. This function
  calculates the nets of the neurons.

 is the output variable,
 is the input variables
 is the weight of the input unit(s),
  is the weight of the hidden unit(s),
  is the weight if the output unit(s),
  is the stochastic error.Network architecture and design Multilayer Perceptions (MLPs) are layered feed forward networks typically trained with static back propagation. These networks have found their way into countless applications requiring static pattern classification. Therefore, given the computational capabilities of a multilayer perception as a linear mapping, a three-layered feed forward neural network was programmed in this research work. The first layer (input level) comprised of 17 neurons (processing elements) - one for each profile parameter (input). The third layer (output level) comprised of 1 neuron – which is the student’s performances evaluated by their GPA. However, based upon recommendations from [11] and [6] that one hidden-layer network is sufficient to model any complex system, the designed network model will have only one hidden layer. In this work, we decided to have a varying numbers of neurons in the hidden layer so as to allow the network identify the outperformed model architecture. The back-propagation learning algorithm was used for training the network. The linear activation function (which compute the output of the neuron) was used at the hidden layer, which can be seen inside the shape in the hidden layer together with the symbol of the summing unit and the identity activation function was used at the output layer.Multiple linear regression To compare the effectiveness of the Artificial Neural Network Architecture for the prediction of academic performance of students, the Multiple Linear Regression model was developed using the student’s profile data as the input variables to predict the students’ performances. However, the multiple linear regression model maps a group of predictor variables
  (student’s profile data) to a response variable
  (students’ performances- GPA) [13,14]. The modified equation of the mapping is in the form:
 | (4) |
This weight matrix is optimal when the sum of squares error  is minimal. The weight can be then evaluated from the least squares estimator by:
 | (5) |
Where  is the estimator for weights of the regression equation Moreover, the global statistical significance of the mapping between the response variable
  with the independent variables
  is analyzed by means of an analysis of variance to ensure the validity of the developed model. In this research, the same training data set was used to develop the regression equations, and the effectiveness of prediction from the Multi Linear Regression model was tested using test data set. The Neural Network Toolbox of MATLAB 8.3 was employed to construct ANN models. For comparison, MLR models were generated using the training and test dataset by MATLAB 8.3 Statistics Toolbox.Model performance criteriaIn real world applications, models usually have some measure of performance. However, there can be many performance measures for model predictors; the standard statistical performance evaluation criteria were used to control the accuracy of the prediction capacity of the models developed in this study. Those criteria were the Mean Squared Error (MSE), Network Information Criterion (NIC), Adjusted Network Information Criterion (ANIC) and the
  adjusted. Mean square error
  The most significant criterion for comparing the predictive abilities of the different statistical Models technique is the mean square error, denoted by
  . The
. The  of the predictions is the mean of the squares of the difference between the observed values of the dependent variables and the values of the dependent variables that would be predicted by the model. It is the mean of the squared difference between the observed and the predicted values or the mean square of the residuals. MSE can reveal how good the model is in terms of its ability to predict when new sets of data are given. A high value of MSE is an indication of a bad fit. A low value is always desirable. Outliers can make this quantity larger than it actually is. MSE has an advantage over some process capability indexes because it directly reflects variation and deviation from the target, [15].Network information criteria (NIC)Network Information Criteria [9] is a version of Akaike Information Criteria (AIC) that can be applied to model selection in Artificial Neural Network (ANN). It also minimizes the Network error. The smaller the value of the Network Information Criteria (NIC), the better the model selected. Network Information Criteria is a generalized form of Akaike Information Criteria (AIC) which is evaluated as the ratio of the Akaike Information Criteria (AIC) to the number of the training set denoted by t.Adjusted network information criterion (ANIC)Adjusted Network Information Criteria (ANIC) is defined as the correction for the biased Network Information Criteria (NIC). It is observed that the higher the values of Adjusted Network Information Criteria, (ANIC) the better the selected model. It is derived from the Network Information Criteria (NIC). Recall, that the according to [10], if the network map the true function F exactly, then the asymptotic relationships exists, thus approximating NIC to AIC as proposed by [9]. Note also that
  where k is the number of parameters and n is the total number of observation. The details of the proof can be seen in the appendix. R-square criterionR-square measures the percentage variability in the given data matrix accounted for by the built model (values from 0 to 1). It is denoted by
  It is different in measures to R-square Adjusted. R-square Adjusted, symbolized as
  gives a better estimate of the
  because it is not particularly affected by outliers. While
  increases when an input variable is added,
  only increases if the added feature has additional information added to the model. A high value of
  is an indication of a good model fit and a low value is always undesirable, [16].
3. Results
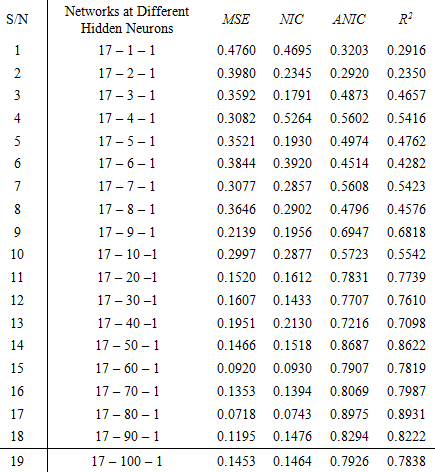
Table of results (ANN model)In order to predict academic performance of students under the context of Artificial Neural Network (ANN), a multilayer perceptron algorithm was developed. The perceptron consisted of three layers, which were input layer, the hidden layer and the output layer. The table of the developed ANN model result is depicted below in table 1.Table 1. Table of Model Architecture with model evaluation criteria
 |
| |
|
Model Summary for Multiple Linear RegressionTable 2. Table of summary result for MLR
 |
| |
|
ANOVA Table for Multiple Linear Regression ModelTable 3. ANOVA table for MLR
 |
| |
|
The fitted model 
Table 4. Table of comparison between ANN and MLR
 |
| |
|
4. Discussion
Table 1 displayed the evaluated results of the developed algorithm in Artificial Neural Network model with the context of students’ academic performance as a modelled data. The table depicted the results of Mean Square Error (MSE), Network Information Criteria (NIC), Adjusted Network Information Criteria (ANIC), and R – Square  at different numbers of hidden neurons. However, in table 2, the summary result of Multiple Linear Regression model was presented. The results indicated the vales of
  etc. Besides, Analysis of Variance table of the developed Multiple Linear Regression model was presented in table 3. The results observed essentially the F-ratio, sig value, etc. Model fit presented the fitted model of the developed Multiple Linear Regression. The values of the coefficients ranged from negative to positive. In addition, graphs 1 – 4 presented different graphs of the considered model evaluation criteria against the numbers of hidden neurons and table 4 presented the comparison of the common model evaluation criteria of the two considered models.
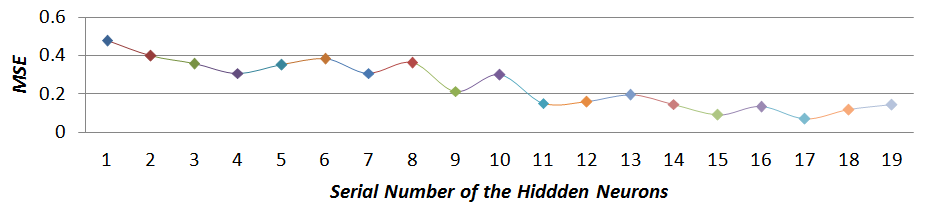 | Graph 1. Graph of mean square error plotted against the number of hidden neurons |
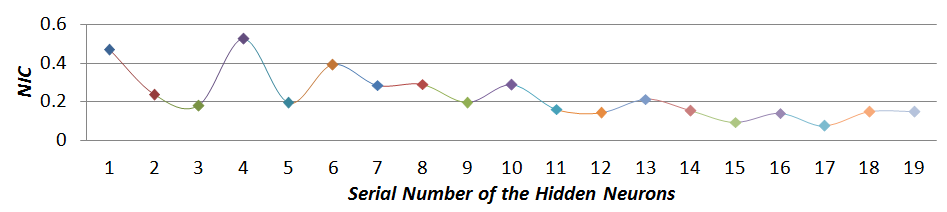 | Graph 2. Graph of Network Information Criteria plotted against the number of hidden neurons |
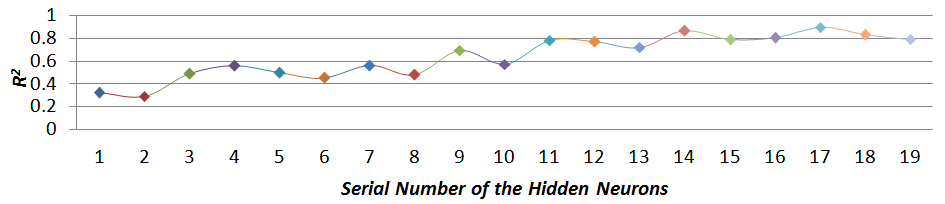 | Graph 3. Graph of R-squared plotted against the number of hidden neurons |
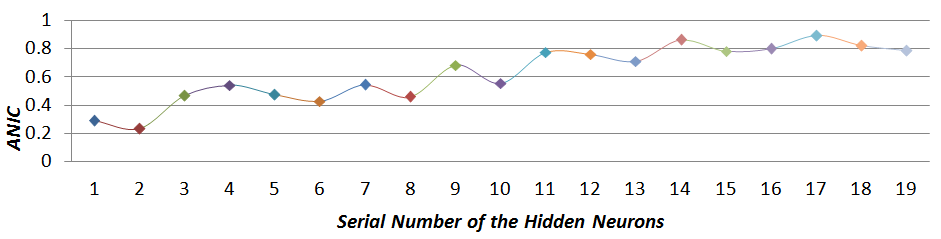 | Graph 4. Graph of ANIC plotted against the number of hidden neurons |
5. Conclusions
From the results in table 1 above, the numbers of the hidden neurons increase down the column and its corresponding values of the model evaluation criteria were generated in their respective columns. The values of Mean Square Error  and Network Information Criteria
  were not steady but decreases down the column, while that of R-square
  and Adjusted Network Information Criteria
  fluctuates and increases down the column. However,
  best modelled the academic performance of students. It contained 80 numbers of hidden neurons and was highlighted in red in the table1. Model
  gave the values of
  and
and  as 0.0718, 0.0743, 0.8975, and 0.8931, respectively and this made the model best among the rest in handing students’ academic performance. The
  and sig - value from the multiple linear regression model summary which were 0.182, 0.746 and 0.000 respectively justified half percentage of the model developed. Some of the coefficient of the explanatory variables like
  were positive, while the rest were negative. The graphs of the different model evaluation criteria plotted against the numbers of the hidden neurons were in the same judgment with table 1. The graph of
  and
and  against the numbers of hidden neurons fluctuates but decreases down the lane, while that of
  and
and  , increases as the numbers of the hidden neurons increases. In addition the result in table 4 which presented the results of comparisons between the two considered models, created an edge for
  model over its traditional model counterpart,
  This was as a result of its
  (0.8975) and
  (0.0718) which were higher and lower as compared to
  (0.746) and
  (0.182).
ACKNOWLEDGEMENTS
I wish to thank faculty of veterinary medicine, University of Ibadan, Oyo State for allowing me make use of the students’ records which formed the data set for this study.
Appendixes 1
The Coefficient of determination,  of the network model
 is calculated by the following alternative formula is
 Where
Where 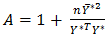 Therefore;
 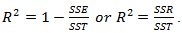 Alternatively,
 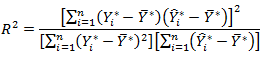 The network information criteriaThe network information criteria is given as
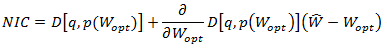
 As long as the parameter
  minimizes the discrepancy function
  the second term
 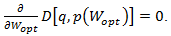 By further simplification, this implies that
  see [17] for details.The mean square errorMSE of the predictor is
 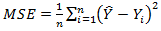 this is a known, computed quantity given a particular sample (and hence is sample-dependent). The MSE of an estimator
  with respect to the unknown parameter
  is defined as
 This definition depends on the unknown parameter, and the MSE in this sense is a property of an estimator (of a method of obtaining an estimate). The MSE is equal to the sum of the variance and the squared bias of the estimator or of the predictions. In the case of the MSE of an estimator [18].
 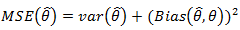 The adjusted network information criterion Note also that
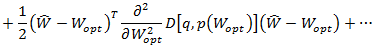
  ; where k is the number of parameters and n is the total number of observation. Therefore, in deriving an alternative or adjusted NIC, we assume that the estimated network model includes the true network model, and the approach shall use the corrected AIC based on Kullbacks’s systematic divergence as used by [19], hence we have to also recollect that
  Therefore, given that the estimated models include the true model, we can define the improved or adjusted NIC as;
 Which is asymptotically an unbiased estimator of,
  where T is some value that improves the NIC, d is the dimension of
  and is given as
  .
.
Appendixes 2
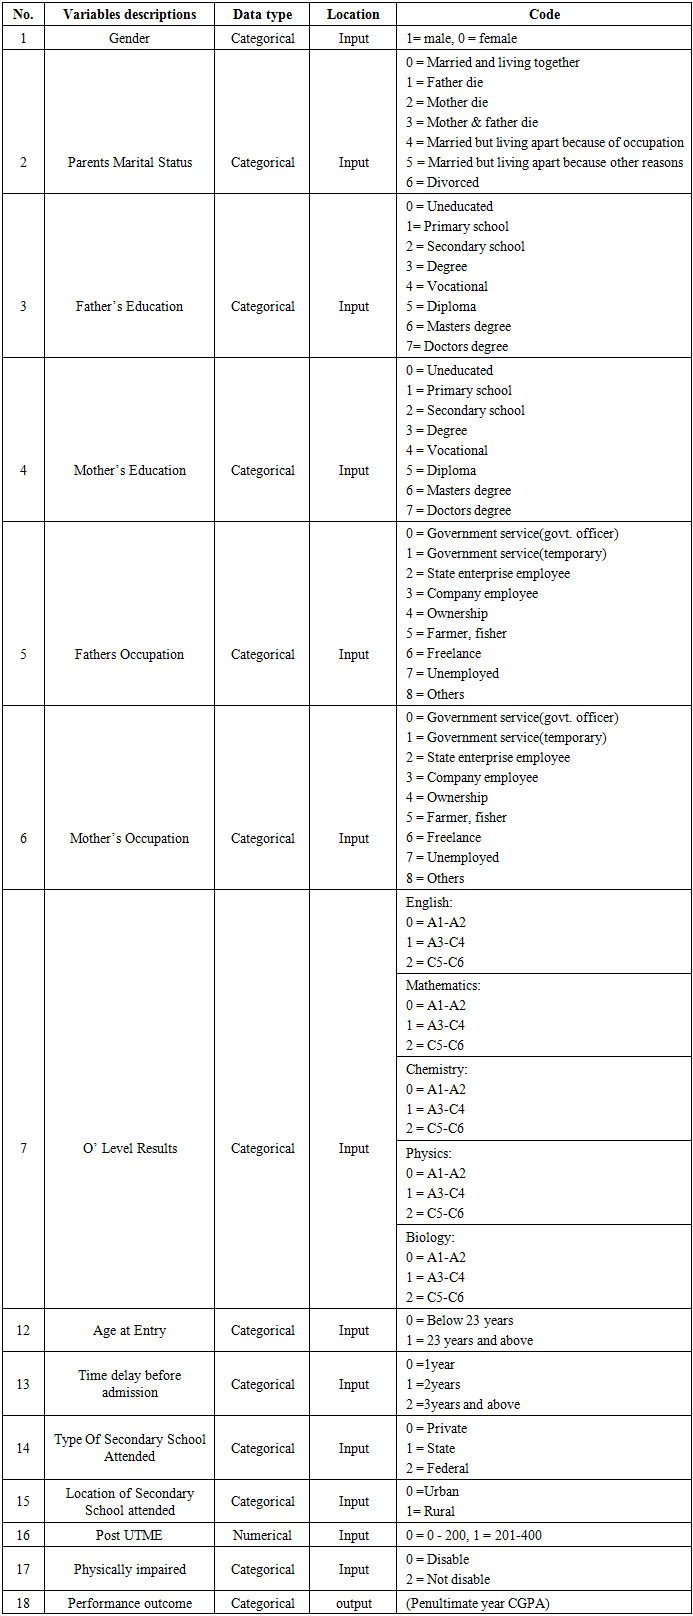
Table 5. Table containing both response and predictor variables considered in this work and the appropriate code
 |
| |
|
References
| [1] | ASOGWA, O.C. & OLADUGBA, A.V. (2015). Of Students Academic Performance Rates Using Artificial Neural Networks (ANNs). American Journal of Applied Mathematics and Statistics. 3(4), 151-155. |
| [2] | ASOGWA, O.C. & UDOMBOSO, C.G. (2016). Modeling Students’ Academic Performance Using Artificial Neural Network. FUNAI journal of Science and Technology. 2(1), 104-114. |
| [3] | ASOGWA, O.C. & OLADUGBA, A.V. (2015). On the Comparison of Artificial Neural Network (ANN) and Multinomial Logistic Regression (MLR). West African Journal of Industrial and Academic Research. 13(1), 3-9. |
| [4] | ADEDEJI, O.B. (2001). A Study of the Relationship between Students UME Results and their Undergraduate Performance”. Unpublished Bsc project, University of Ibadan. |
| [5] | BAKARE, C.G. (1975) Some Psychological Correlates of Academic Success and Failure, African Journal of Educational Research. 2(1), 11-22. |
| [6] | HORNIK, K., STINEHCOMBE, M & WHITE, H. (1989). Multilayer Feed Forward Networks are Universal Approximations. Neural Networks. 2(5), 359-366. |
| [7] | HAGAN, M.T., DEMUTH, H.B., & BEALE, M.H. (1996). Neural Network Design. Boston, PWS Publishing. |
| [8] | MOHAGHEGH, S., REEVES, S., & HILL, D. (2000). Development of an Intelligent Systems Approach for Restimulation candidate selection. Proceedings of SPE/ CERI Gas Technology Symposium, Calgary. 3(5), 1-11. |
| [9] | ANDERS, U. (1996) Model Selection in Neural Networks, ZEW Discussion Papers 96-21. Retrieved from http://hdl.handle.net/10419/29449. |
| [10] | CYBENKO, G. (1989). Approximation by superposition of a sigmoidal function. Journal of Mathematics Control, Signals and System. 2(4), 303-314. |
| [11] | HINES, J. W. (2005). Advanced Monitoring and Diagnostic Techniques, NE 579. |
| [12] | MCCULLOCH, W.S. & PITTS, W.H. (1943). A logical Calculus of the Ideas Immanent in Nervous Activity. Bulletin of mathematical Biophysics, 5(4), 115-133. |
| [13] | BATTAGLIA, G.J., & JAMES, M.M. (1996). "Mean Square Error: A Useful Tool for Statistical Process Management," AMP Journal of Technology 2, 47-55. |
| [14] | JACOB, C., PATRICIA, C., STEPHEN, G.W. & LEONA, S.A. (2003). Applied Multiple Regression/Correlation Analysis for the Behavioral Sciences. Mahwah, New Jersey: Lawrence Earlbaum Associates. |
| [15] | GODSWILL C.N. (2006). A Comparative Analysis of Predictive Data-Mining Techniques. Unpublished M.Sc. thesis, University of Tennessee, Knoxville. |
| [16] | UDOMBOSO, C. G. (2014). On the level of Precision of an Alternative Heterogeneous Model of the Statistical Neural Network. Unpublished Ph.D. Thesis, University of Ibadan. 67 pp. |
| [17] | WACKERLY, D.D., MENDENHALL, III.W. & SCHEAFFER, R.L. (2008). Mathematical Statistics with Applications, seventh (Ed). Brooks/Cole Cengage Learning, Belmont, Cal. |
| [18] | HAFIDI, B. & MKHADRI, A. (2007). An Akaike criterion based on Kullback Symmetric divergence in the presence of incomplete data. Afr. Stat. 2(1), 1 - 21. |
| [19] | Stern, H. (2000). Neural Networks in Applied Statistics (with discussion). Technometrics, 38(3), 205-21. |

 Abstract
 Reference
 Full-Text PDF
 Full-text HTML