-
Paper Information
- Paper Submission
-
Journal Information
- About This Journal
- Editorial Board
- Current Issue
- Archive
- Author Guidelines
- Contact Us
International Journal of Statistics and Applications
p-ISSN: 2168-5193 e-ISSN: 2168-5215
2019; 9(6): 201-207
doi:10.5923/j.statistics.20190906.05

Forecasting Inflation Rates Using Artificial Neural Networks
 Abstract
 Reference
 Full-Text PDF
 Full-text HTML
Akintunde Mutairu Oyewale 1, Agunloye Oluokun Kasali 2, Kgosi Phazamile M. 3, Michael Vincent Abiodun 4, Eriobu Nkiru Obioma 5, Abdulazeez Ismail Adeyinka 1
1Department of Statistics, Federal Polytechnic, Ede, Osun State Nigeria
2Department of Statistics, University of Botswana, Gaborone, Botswana
3Department of Mathematics, Obafemi Awolowo University, Ile-Ife, Osun State, Nigeria
4Department of Statistics, Federal Polytechnic, Bida, Niger State, Nigeria
5Department of Statistics, Faculty of Physical Science, Nnamdi Azikiwe University, Awka, Anambra State
Correspondence to: Akintunde Mutairu Oyewale , Department of Statistics, Federal Polytechnic, Ede, Osun State Nigeria.
| Email: |  |
Copyright © 2019 The Author(s). Published by Scientific & Academic Publishing.
This work is licensed under the Creative Commons Attribution International License (CC BY).
http://creativecommons.org/licenses/by/4.0/

Accuracy and reliability in forecasting the inflation rates or predicting it trend correctly is very importance for would be investors, academia, and policy makers. The use of intelligence based model have been found to be invaluable for forecasting financial and economic series like inflation rates exchange rates and stock bond so to mention the few. Researchers have used several parametric models in forecasting exchange rates and other financial and economics data. This paper therefore employs the use of non-parametric approach (artificial neural networks) in forecasting inflation rates. It is an indubitable fact that Artificial Neural networks (ANNs), emulates the information processing capabilities of neurons of the human brain. It uses a distributed representation of the information stored in the networks, and thus resulting in robustness against damage and corresponding fault tolerance. A major advantage of neural networks is their ability to provide flexible mapping between inputs and outputs. The arrangement of the simple units into a multi-layer frame works produces a map between inputs and outputs that is consistent with any underlying functional relationship irrespective of the true functional form. This paper therefore, used three artificial neural networks (Standard Backpropagation (SBP), Scaled Conjugate Gradient (SCG) and Backpropagation based forecasting model for Nigerian and American inflation rates. These models were evaluated using five performance series and a comparison was made with traditional ARIMA models. Inflation rates data of United States of America and Federal Republic of Nigeria were used for empirical illustration. The data were analyzed using both statistical programme for social science (SPSS) and Econometrics view (E-view). The results obtained show that all the ANN models outperformed ARIMA models. The implication of this is that ANN based model can be used to forecast the inflation rates market structure.
Keywords: Artificial neural networks, ARIMA models, Economic and financial data, Backpropagation, Developed and developing economy
Cite this paper: Akintunde Mutairu Oyewale , Agunloye Oluokun Kasali , Kgosi Phazamile M. , Michael Vincent Abiodun , Eriobu Nkiru Obioma , Abdulazeez Ismail Adeyinka , Forecasting Inflation Rates Using Artificial Neural Networks, International Journal of Statistics and Applications, Vol. 9 No. 6, 2019, pp. 201-207. doi: 10.5923/j.statistics.20190906.05.
Article Outline
1. Introduction
- An artificial neural network is an information processing device that is inspired by the way biological nervous systems, such as the brain, process information. The human brain learns by experience: It receives information and recognizes the pattern; the brain then generalizes and is able to predict based on the information received. It is this way of information processing by the brain that the ANN model tends to mimic. Although ANN models are too far from the way the human brain performs, by mimicking the basic features of the biological neural networks, they have succeeded in doing certain jobs very well [12], [5] and [11]. There have been dramatic improvements in forecasting the economic and financial time series data using non-parametric approach. These breakthroughs were largely fuelled by recent advances in neural network models, usually with multiple hidden layers, known as deep architectures [19], [20]; [16]; [10]; [13] this is made possible by the availability of large datasets [32] and very cheap computing power for model training. Exciting novel applications, such as conversational agents [30]; [25], have also emerged, as well as game-playing agents with human level performance [24]; [22].In more than three decades of existence, ANN applications in economics and finance; for such tasks as pattern reorganization, recognition and time series forecasting, have dramatically increased. Many central banks use forecasting models based on ANN methodology for predicting various macroeconomic indicators, like inflation, gross domestic products Growth and currency in circulation and so on and so forth. In this paper, we have attempted to forecast monthly inflation rates of Nigeria and United States of America using ANN.Modern day forecasting, has placed a lot of interest in studying the artificial neural network (ANN) forecasting in economics, financial, business and engineering applications including GDP growth, stock returns, currency in circulation, electricity demand, construction demand and exchange rates [14], [26]. Many central banks, for example: CZECH National Bank, [21], Bank of Canada, [28], are currently using their forecasting models based on ANN methodology for predicting various macroeconomic indicators. Using forecasts based on this methodology one may make correct classification and decisions such as stock selection, bond rating, credit assignment, property evaluation, and many others [12], [15] and [27]. Several studies have shown that artificial neural networks perform better than traditional ARIMA model among them are, [29], [17], [31], and many other researchers. For more irregular series and for multiple-period-ahead forecasting. [18] provided a general introduction of how a neural network model should be developed to model financial and economic time series. Many useful, practical considerations were presented in their article. [33] analysed backpropagation neural networks' ability to forecast an exchange rate. Inflation forecast is used as guide in the formulation of the monetary policy by the monetary authorities in the world. Monetary policy decisions are based on inflation forecast extracted from the information from different models and other information suggested by relevant economic indicators of the economy. The central idea in this paper is to forecast monthly inflation rates of Nigeria and United States of America. We also compared the forecast performance of the ANN model with that of univariate AR(1) and ARIMA based models. It is observed that forecasts based on ANN are more precise than then those based upon AR(1) and ARIMA models.
2. Methodology
2.1. The Human Neuron
- The human brain or the central nervous system is made up of interconnected units called neurons. This system or group of interconnected neurons working together to perform the functions of the brain (i.e., learning) is the neural network. By definition, “Neurons are basic signaling units of the nervous system of a living being in which each neuron is a discrete cell whose several processes are from its cell body.” Figure 1 shows the biological structure of the human neuron.
 | Figure 1. Biological model of human neureon’s (Source: Hadrat, et.al Int. Journal of Economics & Management Sciences (2015)) |
2.2. The Artificial Neuron
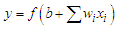
- The artificial neuron is a mimic of the natural human neuron. The human brain, for example, contains approximately ten billion (1010) neurons, each connected on average to ten thousand (104) other neurons, making a total of (1015) synaptic connections [1], [23] and [4]. A mimic of the way biological networks perform may appear more than complex. Artificial neural networks represent an attempt at a very basic level to imitate the type of nonlinear learning that occurs in the networks of neurons found in nature. As shown in Figure 2, a natural neuron uses the synapses located on the dendrite to gather inputs (signals) from other neurons and combines the input information, generate a nonlinear response (“firing”) when some threshold is reached, which it sends to other neurons using the axon. Similarly, the artificial neuron collects inputs (xi) from input neurons, attaches weights and combines them through a combination function such as summation
 It is then activated by a function (usually nonlinear) to produce an output response (y), which is again sent to other neurons [2], Allen P.G., and [10], [7], [8], [6] and [9].
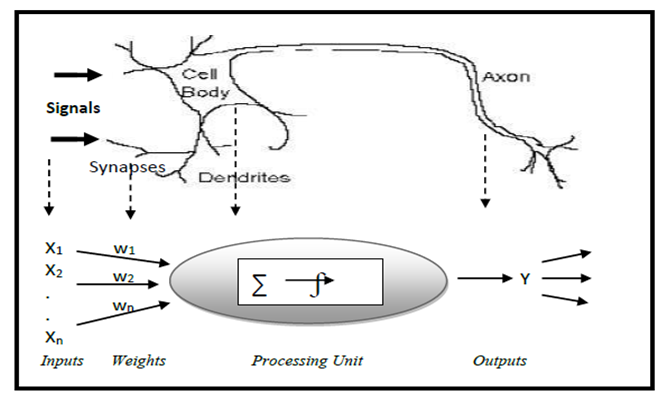 | Figure 2. Natural and artificial neureon’s (Source: Hadrat, et.al Int. Journal of Economics & Management Sciences (2015)) |
3. Mathematical Specification
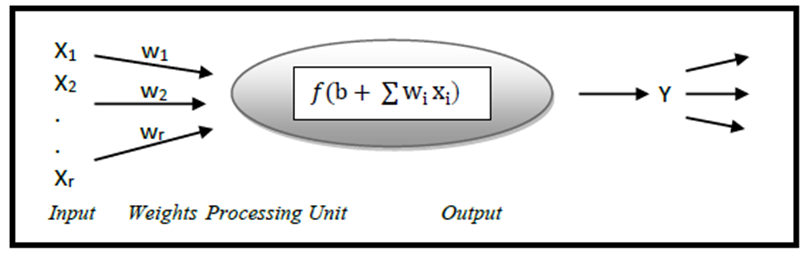
- There are three distinct functional operations that take place in a neuron. These are: the weight function, the net input function and the transfer function as shown in Figure 3.
 | Figure 3. Basic structure of artificial neural networks (Source: Hadrat, et.al Int. Journal of Economics & Management Sciences (2015)) |
3.1. The Weight Function
- The inputs,
 are fed into the neuron. Each input is multiplied by a random weight
  to form the product and summed
  . The inputs and weights are the same as the variables and parameters, respectively, in linear regression models. For many types of neural networks, the weight function is a product of a weight times the input, but other weight functions (e.g., the distance between the weight and the input,
  are sometimes used.
3.2. The Net Input Function
- Next, the weighted input
 is added to a bias
  to form the net input
  . That is, the net input becomes:
  . The bias is similar to the constant in linear models. Themost common net input function is the summation of the weightedinputs with the bias, but other operations, such as multiplication, can be used.
3.3. The Transfer or Activation Function
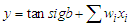
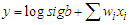
- Then, the net input is passedthrough the transfer function
 , (Figure 4) which produces the output
  .
.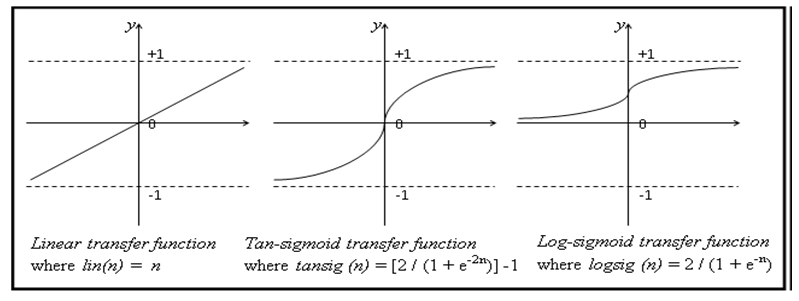 | Figure 4. Three commonly used artificial neural networks (Source: Hadrat, et.al Int. Journal of Economics & Management Sciences (2015)) |
 | (1) |
 value to the output unit that is,
  This is similar to the linear regression model in econometrics:
 | (2) |
 | (3) |
 | (4) |
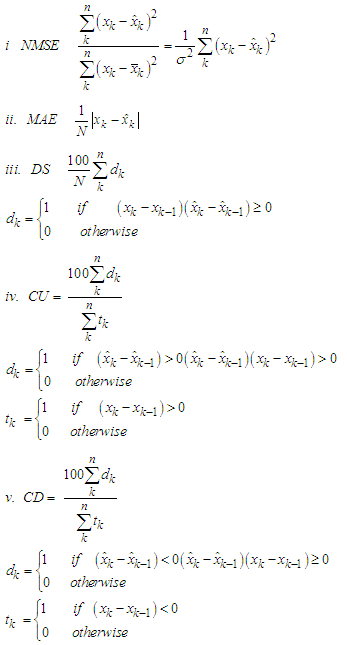
3.4. Performance Measure Indices
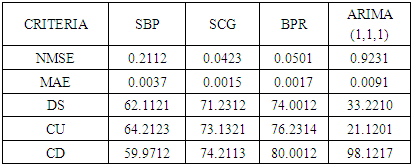
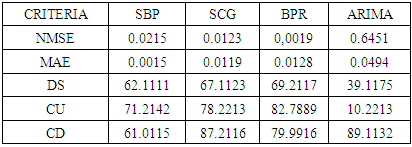
- The following forecast performances were used to analyze the forecast efficacy of artificial neural network (ANN). The indices used are Normalized Mean Square Error (NMSE), Mean Absolute Error (MAE), Directional Symmetry (DS), Correct Up trend (CU) and Correct Down trend (CD).
4. Data and Model Specifications
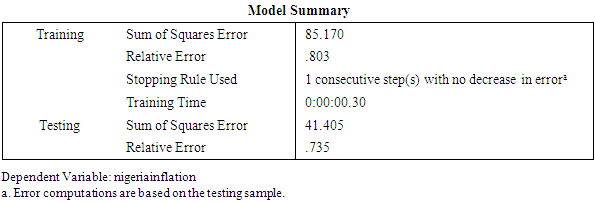
- The main objective of this study is to forecast monthly inflation rates data of United States of America and Federal Republic of Nigeria using the three ANN earlier mentioned (using Standard Backpropagation (SBP), Scaled Conjugate Gradient (SCG) and Backpropagation with ARIMA model as a model for comparison. We used data on monthly basis since from January 1991 to December 2016, representing 300 months for the two countries. The data was analyzed using both SPSS and E-view. From the analysis the following information were extracted.
4.1. Data Analysis
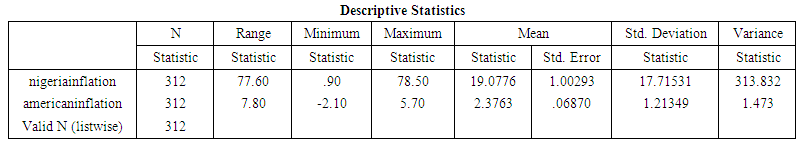 | Table 1. Descriptive statistics of the series used for the study |
|
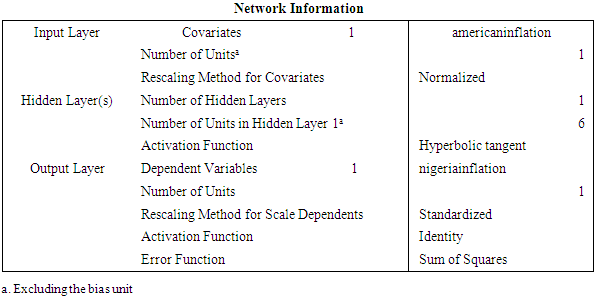
4.2. Network Information
4.3. Network Architecture for the Data Used
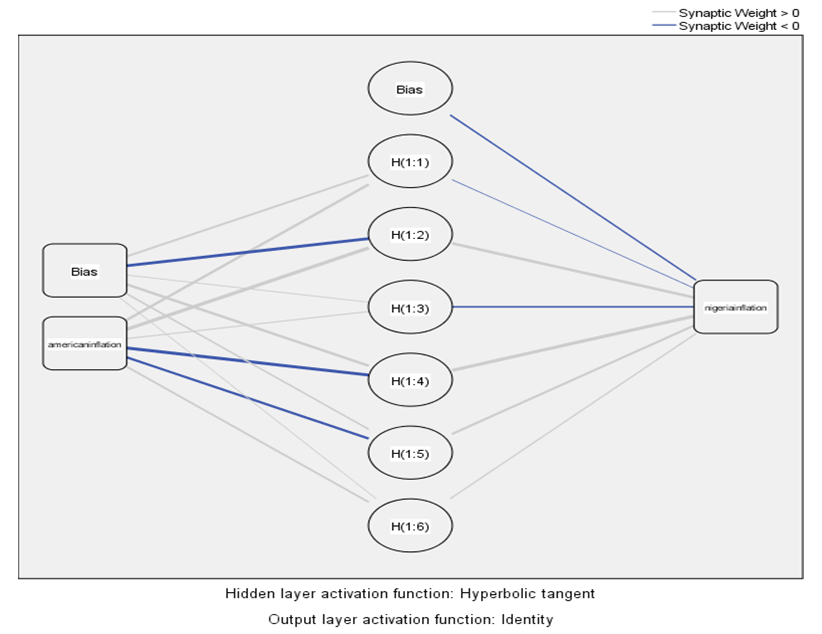 | Figure 5. Architecture of the data |
4.4. Forecast Results for United States of America Inflation Rates Based on Neural Networks and Arima Models
|
4.5. Forecast Results for Nigerian Naira Based on Neural Networks and Arima Models
|
5. Conclusions
- The study, examined three ANN based forecasting models and a comparison was made using ARIMA model. From the table above as obtained from the analysis, all ANN models better than performed ARIMA model as measured on five performance indices. Results show that ANN based model can forecast inflation rates of the two countries effectively. In the committee of the ANN, BPR produced the best result.