-
Paper Information
- Next Paper
- Paper Submission
-
Journal Information
- About This Journal
- Editorial Board
- Current Issue
- Archive
- Author Guidelines
- Contact Us
International Journal of Statistics and Applications
p-ISSN: 2168-5193 e-ISSN: 2168-5215
2019; 9(6): 180-185
doi:10.5923/j.statistics.20190906.02

Divergence and Similarity of the Binary Logistic Regression and Linear Discriminant Analysis Models in Evaluating Factors Associated with Bluetongue Virus in Cattle
 Abstract
 Reference
 Full-Text PDF
 Full-text HTML
Azza B. Musa1, Amal Alsir Alkhidir Abedalraheem2, Mohamed T. Ibrahim2, H. Hamad3, Siddik Mohamed Ahmed Shaheen4
1Central Laboratory, Department of Statistics, Ministry of Higher Education and Scientific Research, Khartoum, Sudan
2Sudan University of Science and Technology, Khartoum, Sudan
3Central Veterinary Research Laboratory, Khartoum, Sudan
4University of Khartoum, College of Economics and Social Studies, Khartoum, Sudan
Correspondence to: Azza B. Musa, Central Laboratory, Department of Statistics, Ministry of Higher Education and Scientific Research, Khartoum, Sudan.
| Email: |  |
Copyright © 2019 The Author(s). Published by Scientific & Academic Publishing.
This work is licensed under the Creative Commons Attribution International License (CC BY).
http://creativecommons.org/licenses/by/4.0/

Binary logistic regression (BLR) and linear discriminant analysis (LDA) are often used to classify populations or groups using a set of predictor variables. The aim of this study is to evaluate the convergence of these two methods when they are applied in non normally distributed epidemiological data. The main criteria used for comparing BLR and LDA were the coefficients of each model, the sample size impact to percentage to correct classification, sensitivity, specificity and accuracy of the models, and the area under the ROC curve (AUC) using ROC curve analysis. Individually, ROC analysis was carried out using the predicted probabilities saved from the two statistical methods. In conclusion, BLR and LDA showed similar results, even with violation of normality assumption.
Keywords: Binary Logistic Regression, BTV, Linear Discriminant Analysis, ROC Curve
Cite this paper: Azza B. Musa, Amal Alsir Alkhidir Abedalraheem, Mohamed T. Ibrahim, H. Hamad, Siddik Mohamed Ahmed Shaheen, Divergence and Similarity of the Binary Logistic Regression and Linear Discriminant Analysis Models in Evaluating Factors Associated with Bluetongue Virus in Cattle, International Journal of Statistics and Applications, Vol. 9 No. 6, 2019, pp. 180-185. doi: 10.5923/j.statistics.20190906.02.
Article Outline
1. Introduction
- Logistic regression and linear discriminant analysis are multivariate statistical methods which can be used for the evaluation of the associations between various covariates and a categorical outcome. Both methodologies have been extensively applied in research, especially in medical and sociological sciences. Logistic regression is a form of regression which used when the dependent variable is dichotomous, discrete, or categorical, and the explanatory variables are of any kind. In medical sciences, the outcome is usually the presence or absence of a stated situation or a disease [1]. Choosing the exact statistical method for data fitting is a frequent question for researchers. Among the most paramount criteria for the differentiation between statistical methods are, the type of response variable as well as the purpose of the research design. If we have a categorical and dichotomous dependent variable, both binary logistic regression (BLR) and linear discriminant analysis (LDA) was suggested as the two multivariate models that have been used for classification of cases into their original groups. This multivariate technique can be used to find out which explanatory variable best discriminate between two or more groups along with the classification of cases into their proper group [2,3]. The number of canonical discriminant functions is mainly determined by the number of categories minus one, or the number of discriminators variables, which is smaller. If we have only two groups or categories, then discriminant function will be derived giving the simplest form of LDA. To date, there has been an increasing interest in choosing between BLR and LDA for analysis of biological data. Although the theory behind each method has been extensively published, the comparison between the two approaches still represents a problem for researchers who aimed to distinguish between two or more categorical outcomes in practice [4]. Thus, it can be proposed that both discriminant analysis and logistic regression can be used to predict the probability of a specified outcome using all or a subset of available variables. This study aims to evaluate the convergence and choosing between two methods when they are applied in epidemiological data and set some guidelines for proper choice; this is the problem that motivated this research. The comparison between the methods is based on several measures of predictive accuracy using blue tongue virus data.Bluetongue virus (BTV) is an infectious disease transmitted by Culicoides biting midges, affecting mainly domestic and wild ruminants, one of the 22 species or serogroups in the genus Orbivirus in the Reoviridae family. BTV causes severe morbidity and mortality in sheep, while the infection is subclinical in some domestic and wild ruminants [5]. BTV is an arbovirus, and until recently, its transmission was thought to be only mediated in cattle and ruminant through the bite of infected midges. This sole transmission route has been challenged recently with the emergence of reports of direct contact transmission with some serotypes and vertical transmission from mother to fetus [6].In this study, linear discriminant analysis and binary logistic regression methods are compared using the Blue tongue virus (BTV) data set as a cross sectional study. These data were collected by veterinarian researcher in 2015, from Gedarif state- eastern Sudan, to study the prevalence of virus and risk factors associated with disease in cattle, there are 4 catecorigal predictor variables (Breed, Sex, Locality, Climate), and Age was quantitative variable.
2. Material and Methods
- Logistic regression is a form of regression which is used when we want to predict probabilities of the presence or absence of a particular disease, characteristic, or an outcome in general based on a set of independent of explanatory variables of any kind (continuous, discrete, or categorical). Since the predicted probability must lie between 0 and 1, simple linear regression techniques are insufficient to achieve that, because they allow the dependent variable to pass these limits and to produce inconsistent results [7].
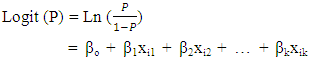 | (1) |
 | (2) |
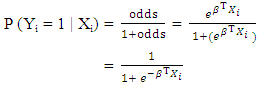
 is the odds ratio for the independent variable Xi. Theoretically, BLR is more flexible regarding the assumptions, particularly those of independent variables. However, both methods require some assumptions in common [7] such as independency of observations, absence of multicollinearity between predictors, and lack of outliers in datasets.Linear discriminant analysis (LDA) was used to examine the association between a categorical outcome and multiple independent variables in the form of discriminant function. The linear discriminant equation (LDE) given as follows:
 | (3) |
3. Results
- The first set of analysis in this study was carried out to examine the assumptions required by linear discriminant analysis. Box's M statistic which has been used to test the homogeneity of covariance matrices revealed the violation of that assumption (Box's M = 33.082, F = 2.066, and sig = 0.009) in all analyses. The dataset denoted non-normal distribution for all variables. The results obtained from the preliminary analysis showed no signs of collinearity between the explanatory variables. The highest correlation (0.401) observed between age and sex.
|
|
|
|
|
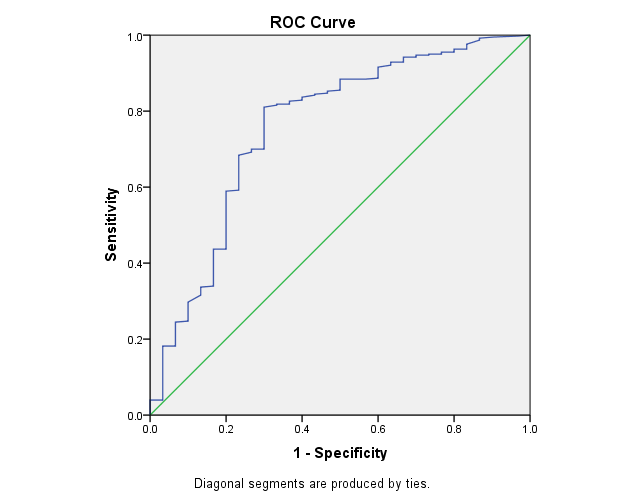 | Figure 1. ROC curve for binary logistic regression model |
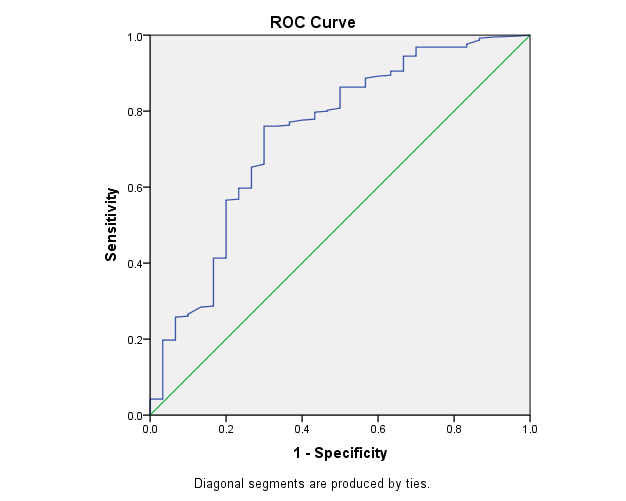 | Figure 2. ROC curve for linear discriminant model |
4. Discussion
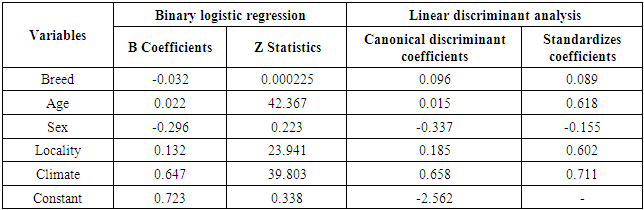
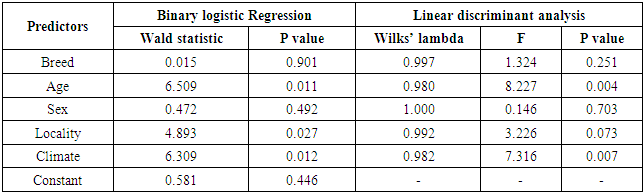
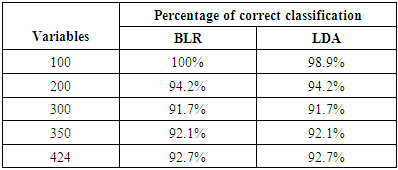
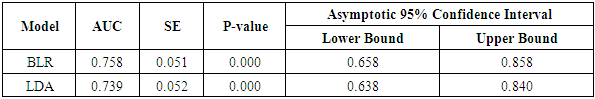
- The present study was designed to evaluate the robustness of linear discriminant analysis and binary logistic regression when categorical data, with special consideration for the outcomes. A real veterinary dataset have been used to compare between the two statistical models. In general, both logistic regression and discriminant analyses converged in similar results. Both methods estimated the same statistical significant coefficients, with similar effect size and direction, Moreover, the results of Wilks' lambda and wald statistics for testing the overall performance of LDA and BLR respectively, confirm the conclusion that both methods are robust when using non-normal data.Classification of animals having BTV or not was carried out on different sample sizes, results revealed that same percent of correct classification over all sample size, except smallest sample size (100). The results of ROC curve and the area under the curve (AUC) can also be considered as another evidence for evaluating the performance and quality of the LDA and BLR. The findings of ROC curves of this study revealed small difference of AUC between LDA and BLR (decimals).In term of using real non-normal datasets, there is a similarity between the finding in this study and those described in the literature, Tabachnick B.G. and Fidell L.S & Sueyoshi T. and Hwang [11,12] found that LDA and BLR performed equally in determining the practical differences between groups.Inconsistent findings have been published about the performance of BLR and LDA with regard to sample size. For example, the study of Wilson and Hargrave reported that LDA was better than BLR when analyzing small size datasets [13]. Moreover, George Antonogeorgos, Demosthenes B. panagiotakos, Kostas N. Priftis and Anastasia Tzonou [1] concluded that the differences between BLR and LDA may be neglected if we have large sample sizes. They expected that small samples may lead to unstable and invalid estimates. The present findings are in accordance with the results of El-habil A. and El-Jazzar M.A. [14] who reported that the percent of correct classification was higher in LR than did LDA. They also, indicated that the variation in sample size has the same effect on the two analytical models. The present results seem to be consistent with other research findings. For example, a study was carried out by Zandkarimi E., Safavi, A.A., Rezaei M. and Rajabi G. [15] for differentiation of normal and diabetic patients using both BLR and LDA. They demonstrated that the classification power was higher for BLR than LDA. Also, Liong and Foo used real datasets to compare BLR and LDA on the basis of normality assumption [16], number of predictors, and sample size. They mentioned that in general, BLR denoted better results regardless the distribution of explanatory variables. However, they showed that the two methods perform equally with larger samples. On the other hand George Antonogeorgos, Demosthenes B. panagiotakos, Kostas N. Priftis and Anastasia Tzonou [17,1] concluded that both LDA and BLR denoted the same predictive and classification model in the studies that have been conducted on outcomes from health problems. Dealing with veterinary data, one earlier study was performed by Montgomery M.E., White M.E. and Martin S.W. [18] to evaluate the two methods. The interesting finding of their study was the preference of BLR than LDA especially when the normality assumption and homogeneity of covariance matrices were not verified. The results of ROC curve and the area under the curve (AUC) can also be considered as another evidence for evaluating the performance and quality of the BLR and LDA. Taking sample size into account, it has been recommended that the clinical conclusions from ROC curves can be regarded if the sample size was 100 and more [19]. The findings of ROC curves of this study, AUC revealed that BLR is slightly higher than LDA. Although, the AUC was something larger for BLR than LDA, the significant statistics for testing the AUC for both methods indicate that all AUC were significantly different from half. Therefore, it can be concluded that both LDA and BLR were strongly able to differentiate between cattle infected or not, with regard to the non-normal explanatory variables. A recent study has been conducted by Ahmadi M.A. and Bahrampour [20] for examining the differences between LDA and BLR in predicting diabetes using real datasets. Their results showed that AUC for LDA and BLR were similar (0.801 and 0.803, for LDA and BLR, respectively). Similarly, George et al. reported AUC as 0.744 and 0.746, for LDA and BLR, respectively [1]. In general, this study showed that changing the sample sizes lead to nearly similar results, for both LDA and BLR.
5. Conclusions
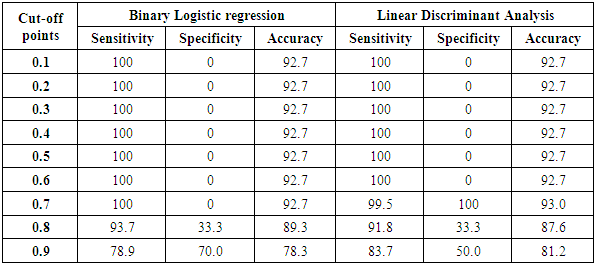
- In summary, the first finding that can be drawn from this study was that both methods have selected the same predictors for significant differentiation, using non-normally distributed data. The second major outcome was that the sample size has the same impact on LDA and BLR, regarding the percentages of animals being correctly classified, Although, the area under the roc curve (AUC) showed BLR slight superiority than LDA, and classification accuracy of higher cutoff points also showed small difference between two models.In conclusion, logistic regression and discriminant analyses were similar in the model analysis. In order to decide which method should be used, we must consider the assumptions for the application of each one.
ACKNOWLDGEMENTS
- I would like to express our gratitude to Central laboratory- Ministry of higher education and scientific research- Khartoum – Sudan for the financial support.