-
Paper Information
- Next Paper
- Paper Submission
-
Journal Information
- About This Journal
- Editorial Board
- Current Issue
- Archive
- Author Guidelines
- Contact Us
International Journal of Statistics and Applications
p-ISSN: 2168-5193 e-ISSN: 2168-5215
2019; 9(5): 134-142
doi:10.5923/j.statistics.20190905.02

A Combined Estimation Method to Estimate the Parameters of the Zero-One Inflated Negative Binomial Distributions
 Abstract
 Reference
 Full-Text PDF
 Full-text HTML
Rafid S. A. Alshkaki
Department of General Requirement, Ahmed Bin Mohammed Military College, Doha, Qatar
Correspondence to: Rafid S. A. Alshkaki, Department of General Requirement, Ahmed Bin Mohammed Military College, Doha, Qatar.
| Email: |  |
Copyright © 2019 The Author(s). Published by Scientific & Academic Publishing.
This work is licensed under the Creative Commons Attribution International License (CC BY).
http://creativecommons.org/licenses/by/4.0/

In this paper, the zero and one inflated negative binomial distributions is considered. A combined method of relative frequencies and maximum likelihood estimators was introduced to estimate the parameters of the zero and one inflated negative binomial distribution. A simulation study was conducted to check the performance of this estimation method using the mean squares error of each of the parameter estimates for six simulated different zero and one inflated negative binomial distributions models. The proposed estimation procedures was used to estimate the parameters of six real life data sets models and it gave good results.
Keywords: Zero One Inflated Negative Binomial Distribution, Maximum likelihood Estimation, Relative Frequency, Non Negative Integer Sampling
Cite this paper: Rafid S. A. Alshkaki, A Combined Estimation Method to Estimate the Parameters of the Zero-One Inflated Negative Binomial Distributions, International Journal of Statistics and Applications, Vol. 9 No. 5, 2019, pp. 134-142. doi: 10.5923/j.statistics.20190905.02.
Article Outline
1. Introduction
- In recent researcher’s literature statistical modelling work, frequencies of zeros may be significantly higher than the predicated frequency by the standard statistical models. This might be lead to wrong conclusions about the actual statistical model. Such models are called zero inflated models. Furthermore, frequencies of zeros and ones may be also jointly significantly higher than the predicated frequency by the standard statistical models also, leading to zeros and ones inflated models. Hence the problem of estimating the model’s parameters may be need further work more than the classical statistical methods. Gan (2000) studied the properties of the maximum likelihood estimates (MLE) of zero inflated model parameters, including their existence, uniqueness, strong consistency and asymptotic normality under regularity conditions. Preisser et al. (2012) considered reviews of the zero inflated Poisson and the zero inflated negative binomial (ZINB) regression models applied to dental caries, with emphasis on the description of the models and the interpretation of fitted model results given the study goals. Staub and Winkelmann (2012) noted that zero-inflated Poisson and the ZINB maximum likelihood estimators are not robust to misspecification, and proposed Poisson quasi-likelihood estimators, as an alternative, as consistent estimators in the presence of excess zeros without having to specify the full distribution. Phang et al. (2013) reviewed some literature on the zero inflated models and provide a variety of examples from different disciplines in the applications of zero inflated models, as well as, discussed different model selection methods used in model comparison. Astuti and Mulyanto (2016) used the MLE method to estimate the parameter on ZINB regression model through maximizing the likelihood function using expectation maximization algorithm. Lukusa et al. (2017) considered the zero-inflated models as the most appropriate approach for dealing properly with this issue of excess zeros, reviewed studies the missing data problem and the zero-inflated feature in modeling zero-inflated data, and discussed their methodologies and results and some potential directions of the future research. Yang et al. (2017) evaluated the performance of several models under different conditions of zero -inflation and dispersion, and used results from simulated and real data and showed, when data have excessive zeros and over-dispersion, that the zero-altered or ZINB model were preferred over others, such as, ordinary least-squares regression with log-transformed outcome, and Poisson model. Yusuf et al. (2017) used the values of Vuong z-statistic, -2logLL, AIC and BIC selection criteria to select the best fitted zero inflated Poisson and ZINB regression models, and suggested that the ZINB regression as the best model for predicting number of falls in the presence of excess zeros and over-dispersion. Zamri and Zamzuri (2017) reviewed the zero inflated models literature, provided a recent development and summary on models for count data with extra zeros, and they found in the literature that the most popular zero inflated models used are zero inflated Poisson and ZINB.The zeros and ones inflated models are not given such attention in the literature as the zero inflated models. In particular, Alshkaki (2017) gave an exact form of the ME of the parameters zero-one inflated negative binomial distribution (ZOINBD), and found numerically that this method is generally not an accurate method to estimate the parameters of the ZOINB models and may lead to misleading predication. In this paper, the definition of the ZOINBD was introduced in Section 2, followed in Section 3 by introduced a combined method of relative frequencies and MLE. In Section 4, we conducted a simulation study to check the performance of the proposed estimation procedure using the mean squires error computed from different sample sizes for the estimated parameters on six simulated different ZOINBD models. Finally, in Section 5, we used the proposed estimation procedure to estimate the parameters and the frequencies of six different real life data sets.
2. The Negative Binomial Distributions and Its Zero-One Inflated Form
- Let
 , then the discrete random variable (rv) Y having a probability mass function (PMF) given by;
 | (1) |
 . We will denote that by writing
  See Johnson et al. (2005), for other forms and parameterizations of the NBD.Let
  be a proportion of zero added to the rv Y, and let
  be an extra proportion added to the proportion of ones of the rv Y, such that
  then, the rv X defined by, Alshkaki (2017);
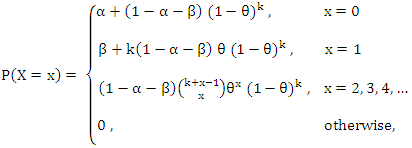 | (2) |
 and we will denote that by writing
 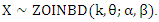 Alshkaki (2017) noted that, if
  then (2) reduces to the form of the ZINBD. Similarly, the case with
  and
and  reduces to the standard case of the NBD.Although, it does not fit the nature of the supposed model, Alshkaki (2017) noted that, the inflation parameters
  and
and  may also take negative values providing that
 and
and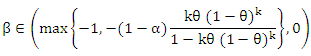 without violating that (2) is a PMF. This situation represents the excluding proportion of zero’s and one’s, respectively, from the standard model given by (1).
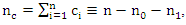
3. Maximum Likelihood and Relative Frequencies Estimators
- Let
 be a random sample from
  as given by (2), and let for i=1, 2, … n,
 and
and then, for i=1, 2, … , n, (2) can be written, for
 in the following form;
 Hence, the likelihood function
  can be written as;
 where
where  and
and  Note that
  and
and  represent, respectively, the number of zeros and the number of ones in the sample. Therefore,
 It follows that,
 | (3) |
 and hence,
  therefore,
  which indicates that L has a local maximum at
  Similarly,
  and hence,
  therefore,
  which indicates that L has a local maximum at
  Next,
Next, 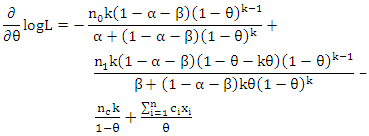 | (4) |
 can be shown to be not in a simple form, therefore a local maximum of L at
  has to be explicitly examined. Finally,
 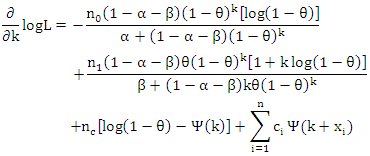 where
where  is the digamma function. Since
  can be shown to be not in a simple form, therefore, a local maximum of L at k has to be explicitly examined. Hence,
  can be obtained by solving;
 using any numerical procedure, say, Newton Rapson method, with initial, as given by Alshkaki (2017), where;
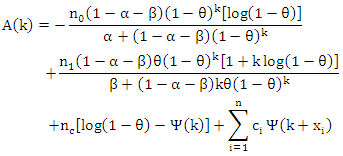 Now, letting
  we have from (3) that;
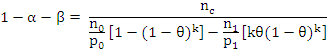 where,
 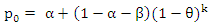 | (5) |
 | (6) |
 then (4) reduces to;
 | (7) |
 and
and  by their sample relative frequencies, i.e. by their sample estimates, the proportion of zeros and the proportion of ones in the sample, that is;
  and
and  respectively, then (7) reduce to;
 | (8) |
 | (9) |
 | (10) |
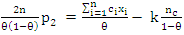
 hence, from (10) we have that;
 or equivalently, in the form after multiply both sides by
 from which we have that;
 Thus, the estimates of
  using the sample relative frequencies estimates, are given by solving (5) and (6) to be;
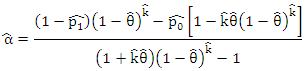 and
and
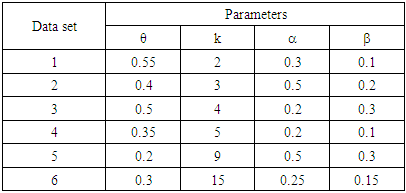
4. A Simulation Study
- In order to check the accuracy of the proposed combined estimation method, we simulated data from different ZOINBD models data sets, then the performance of the estimators are computed through their mean squares errors (MSE) using different sample sizes.We have used Absoft Pro Fortran compiler for computing, Mathematica and STATISTICA for the needed graphics and other statistical computing. The procedure steps are given below;(1) Six different ZOINBD models are considered.(2) Five sample sizes; 15, 30, 50, 100, and 300 are used.(3) For each sample size, 5,000 random variates were generate from each of the given ZOINBD model. (4) For each sample size and for each ZOINBD model, the parameters were estimated using the proposed combined estimation method.(5) The means, standard deviation (SD), bias, and MSE for each of the parameters were computed for each random sample for each sample size of the given ZOINBD models.Table 1 presents the 6 different simulated ZOINBD Data Sets that were considered, and Tables 2, 3 and 4, represent the findings of the computations.
|
 | Table 2. Computation Results of Data Sets 1 and 2 |
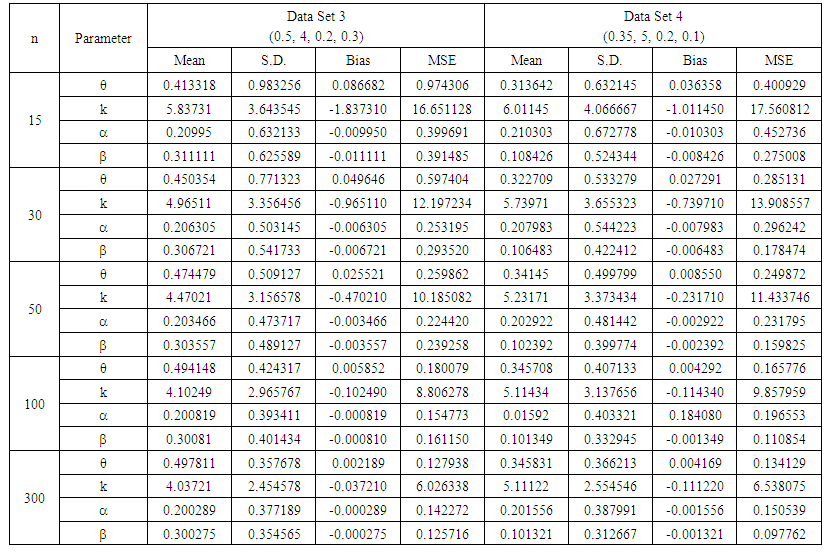 | Table 3. Computation Results of Data Sets 3 and 4 |
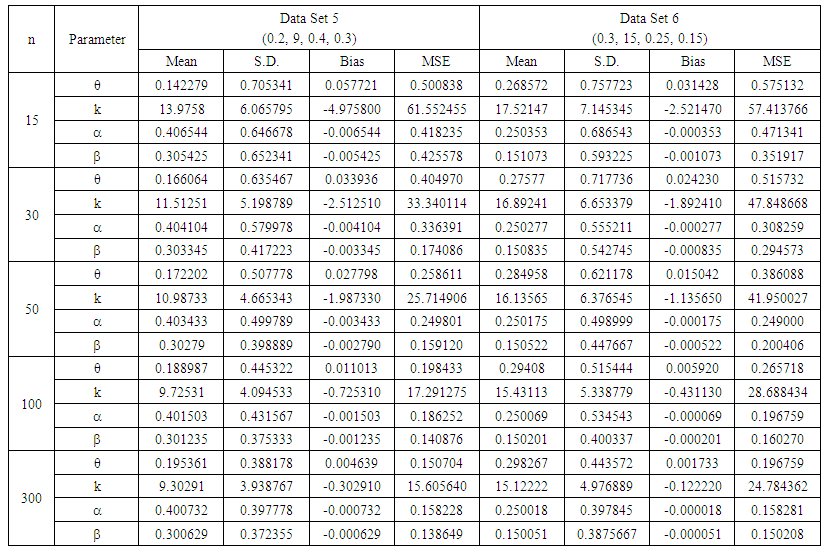 | Table 4. Computation Results of Data Sets 5 and 6 |
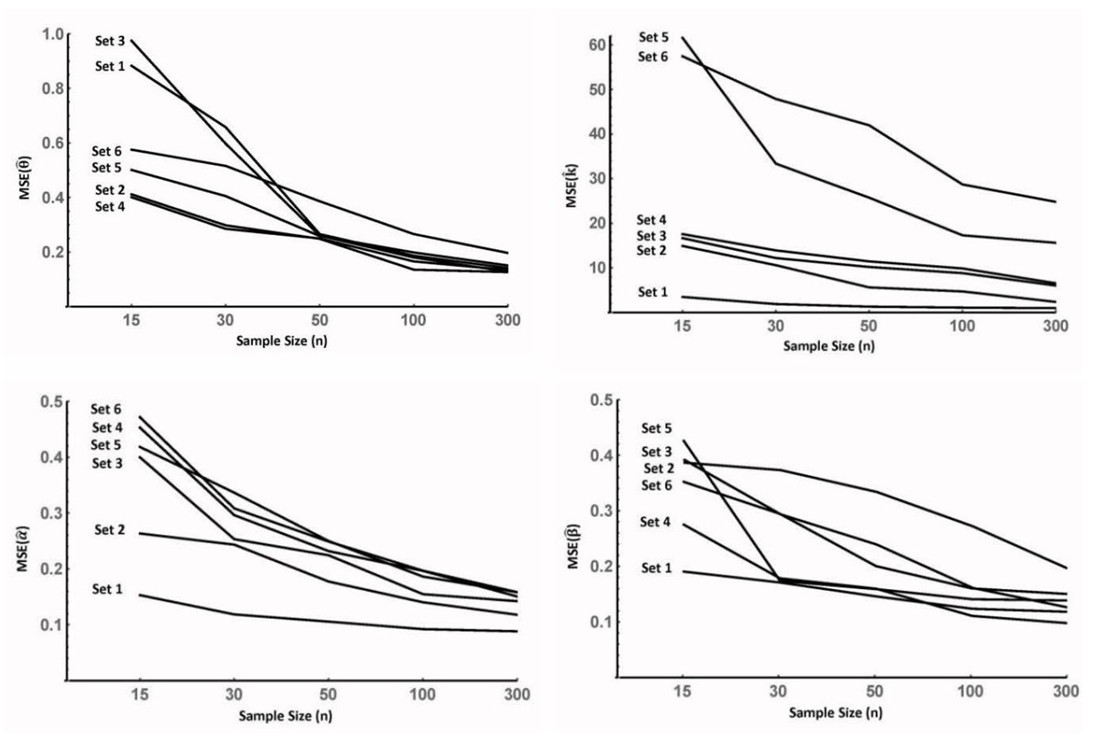 | Figure 1. Influence of the sample sizes on the estimated parameter’s MSE for the 6 simulated data Sets |
5. Fitting Zero-One Inflated Negative Binomial Distributions to Real Life Data
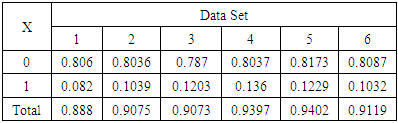
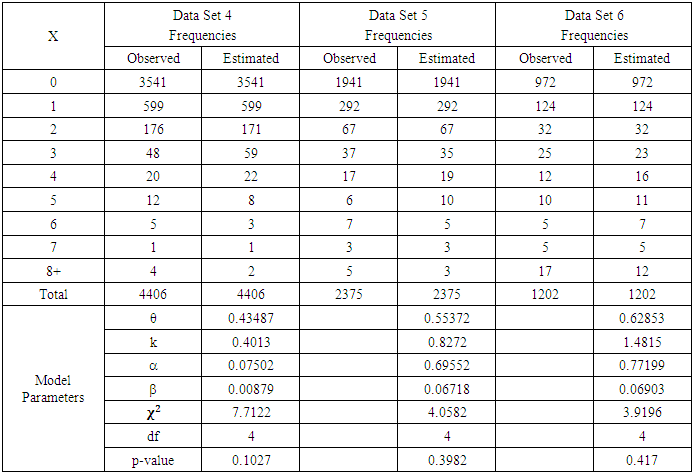
- We have taken six real life data set from different filed in order to show the usefulness of the proposed combined estimation procedure to estimate and fit ZOINBD to these real life data sets. The data sets are;Data Set 1: Represents the number of units of consumers good purchased by households over 26 weeks, see Lindsey (1995). This data was studied by Aryuyuen et al. (2014) using the zero inflated negative binomial-generalized exponential distribution.Data Set 2: Represents the number of major derogatory reports in the credit history of individual credit card applicants, Greene (1994). This data was studied by Saengthong et al. (2015) using the zero inflated negative binomial – crack distribution.Data Set 3: Represents the number of Stillbirths in 402 litters of New Zealand white rabbits, Morgan et al. (2007). This data was studied by Morgan et al. (2007) using the zero-inflated Poisson distribution.Data Set 4: Represents the number of hospital stays by United States residents aged 66 and over, Flynn (2009). This data was studied by Aryuyuen et al. (2014) using the zero inflated negative binomial-generalized exponential distribution.Data Set 5: Represents the number of households according to the total number of migrants in household cohort excluding international migrants of the rural areas of Comilla district of Bangladesh, Pandey and Tiwari (2011). This data was studied by Pandey and Tiwari (2011) using a mixture of a geometric and log-series distributions.Data Set 6: Represents the number of migrants from a household in growth-center villages, Pandey and Tiwari (2011). This data was studied by Pandey and Tiwari (2011) using a mixture of a geometric and log-series distributions.We have chosen these data sets due to the fact that their observed relative frequencies at zeros and ones are noticeably large as can be seen from Table 5, for example, the relative frequency of zeros for Data Set 1 is 0.806, and the for the ones is 0.082, hence both sum to 0.888, which is a noticeable large, and similarly, the same note for the other Data Sets 2 to 6, inducting that the ZOINBD models may be an appropriate model to be considered for these data sets.
|
|
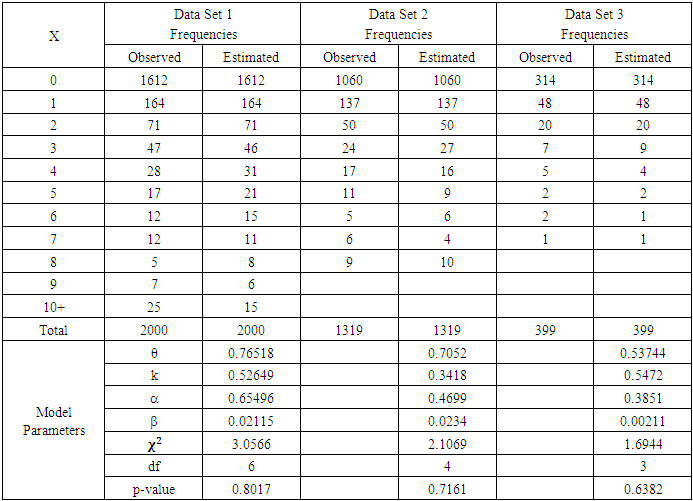
|
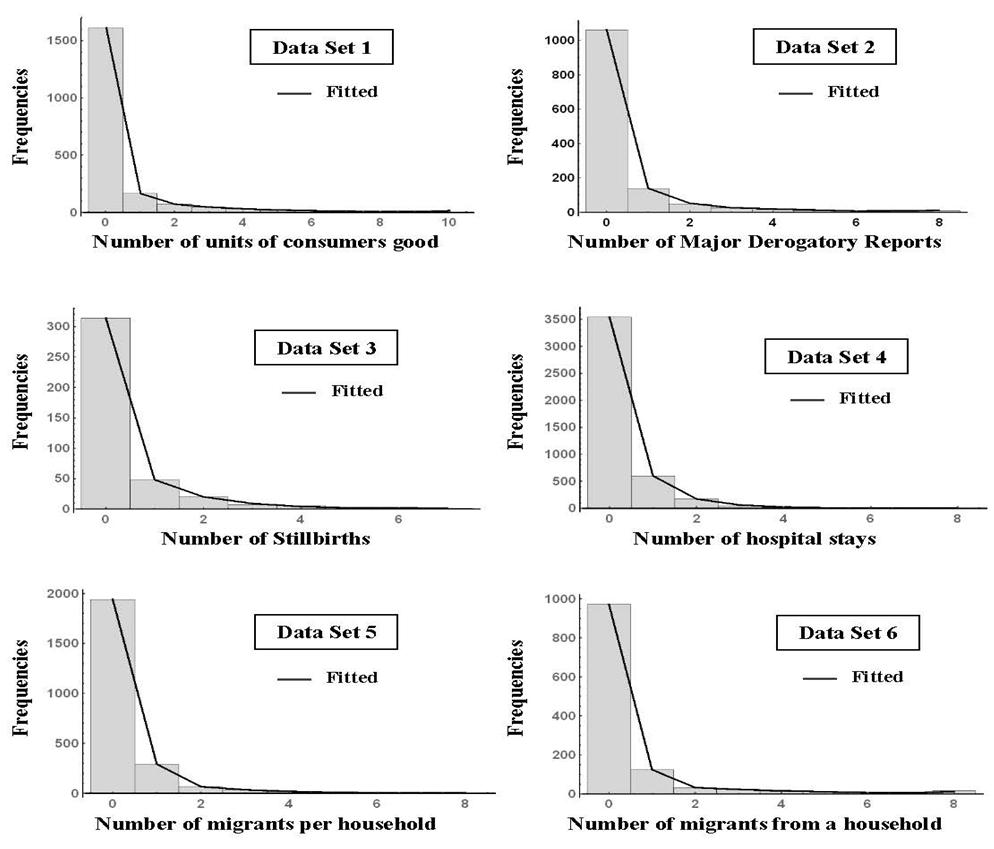 | Figure 2. Observed and Estimated Frequencies of All Data Sets |
6. Conclusions
- We considered estimation of the parameters of the zero-one inflated negative binomial distribution by a combined method of relative frequencies and maximum likelihood estimators. We simulated six different zero-one inflated negative binomial distribution models data sets, in order to check the performance of the proposed estimation method, and the mean squares errors of each of the estimated parameter was computed using different sample sizes. The mean squares error of each of the estimated parameter for each of the six simulated data shows that the it is decreasing as the sample size increases. We used the proposed estimation procedures to estimate the parameters of the zero-one inflated negative binomial distribution model of six different real life data sets, and it gave a good results visually, supported by the results of the chi-squares goodness of fit test for each of the data sets.