-
Paper Information
- Paper Submission
-
Journal Information
- About This Journal
- Editorial Board
- Current Issue
- Archive
- Author Guidelines
- Contact Us
International Journal of Statistics and Applications
p-ISSN: 2168-5193 e-ISSN: 2168-5215
2019; 9(4): 117-121
doi:10.5923/j.statistics.20190904.03

Estimating and Predicting Value at Risk in Selected Banks of Nigeria Stock Market
 Abstract
 Reference
 Full-Text PDF
 Full-text HTML
Iniabasi Emmanuel Etuk, Yakubu Musa, Shehu Usman Gulumbe
Statistics Unit, Department of Mathematics, Usmanu Danfodiyo University, Sokoto, Nigeria
Correspondence to: Yakubu Musa, Statistics Unit, Department of Mathematics, Usmanu Danfodiyo University, Sokoto, Nigeria.
| Email: |  |
Copyright © 2019 The Author(s). Published by Scientific & Academic Publishing.
This work is licensed under the Creative Commons Attribution International License (CC BY).
http://creativecommons.org/licenses/by/4.0/

Value at Risk is one of the risk measure used in the financial markets to estimate market risk. This study examines and estimates the performance of Gaussian Density, Weighted estimator and Extreme Value Theory models in measuring Value at Risk (VaR) using data of some selected banks in Nigeria. The results of the weighted estimator of VaR estimate for in-sample predictions, shows that the p-value of 0.07141 of Guaranty Trust Bank was able to estimate VaR correctly. The out-of-sample predictions indicate the extreme value estimates with the p-values greater than  have specifies VaR correctly. Hence VaR prediction shows extreme value theory method outperforms other methods in forecasting VaR.
Keywords: Value-at-Risk, Extreme Value Theorem, Weighted Estimator, Gaussian Estimator
Cite this paper: Iniabasi Emmanuel Etuk, Yakubu Musa, Shehu Usman Gulumbe, Estimating and Predicting Value at Risk in Selected Banks of Nigeria Stock Market, International Journal of Statistics and Applications, Vol. 9 No. 4, 2019, pp. 117-121. doi: 10.5923/j.statistics.20190904.03.
Article Outline
1. Introduction
- Risk is the chance of exposure to danger, harm or loss. Bank and other financial institutions most embark on concrete risk measure to be able to meet with their financial obligations. There are two fundamental measures of risk, namely; the volatility measures and Value-at-Risk (VaR). Volatility measures consider the variation in risk factors. Volatility is usually measured as the standard deviation of return distribution. A large volatility suggests that the corresponding asset is subjected to large risk. The increased volatility of financial markets during the last decade has induced researchers, practitioners and regulators to design and develop more sophisticated risk management tools [1]. According to the Basel Accord Committee [2], the bank and other financial institutions must satisfy the minimum capital requirements of the Basel Accord. Value at risk (VaR) serves as a commonly used methodology for managing market risk. It is defined as the lowest quartile of the potential loss over a specified time period. Banks are now required to hold a certain amount of capital as a cushion against adverse market movements. According to the capital adequacy directive which incorporates a report by the Basel Committee on Banking Supervision (BCBS) [3], the risk capital of a bank must be sufficient to cover losses on the bank’s trading portfolio over a 10-day holding period on 99% of occasions.The aim of this work is to estimate the value at risk of investing in the five major Nigerian banks (First bank, UBA, GTB, Zenith bank, Access Bank) listed in the Nigerian stock market based on their share price from 2006 to 2015. The methods of Gaussian, extreme value theory and weighted estimator were employed. The accuracy of the risk measures will be address with Kupiec likelihood ratio test.
2. Literature Review and Theoretical Framework
- Estimating VaR is equivalent to estimating a quantile or percentile of a distribution. An overview of some approaches of calculating VaR has been studied [4,5]. Researchers, such as Harrell and Davis estimate value at Risk using order statistic on single historic observation data, the result exhibit high variability and provides little information about the distribution of losses around the tail [6]. The performance of several quantile estimators was compared in order to find out which performs the best against another [7,8]. Jadhav and Ramanathan [9] review some of the existing parametric and non-parametric methods of estimating Value at Risk, they found that one of the suggested nonparametric estimators works well compared with others, specifically for return data with high variability. Ringqvist [10] compare Value at Risk models with Historical Simulation, age Weighted Historical Simulation and Volatility Weighted Historical Simulation on GARCH (1,1) model, Normal VaR and t-distributed VaR. The result shows that Volatility Weighted Historical Simulation outperformed other models. Additionally [11-15] gave a brief review of some of the existing methods of estimating VaR. VaR is the most accepted risk measure worldwide and the leading reference in any risk management assessment [16].Using Taylor's expansion, Barrieu and Ravanelli [17] derive the upper bound of the VaR adjustments, only taking specification error into account. Confidence intervals were derived for VaR and Median Shortfall and propose a test for model validation based on extreme losses [18]. Similarly, correction for VaR model risk have been suggested, which ensures various VaR back tests are passed, and propose the future application for expected shortfall (ES) model risk [19]. Other sources of model risk that may give wrong risk estimates are, for example, granularity error, measurement error and liquidity risk [19].Accurate estimation of the VaR and ES is very important for the proper management of financial risks. Kabaila and Mainzer [20] found the linear regression models in which the response variable is the approximate VaR and the explanatory variable is the exact VaR. They use these linear regression models to determine the properties of the approximate VaR, conditional on the corresponding exact value. For a given value of the exact VaR, the approximate VaR is close to being an unbiased estimator of the corresponding exact value, but it may differ from this exact value by more than 10% of the exact value with substantial probability.
3. Methodology
- Value at RiskSuppose X is a random variable denoting the loss of a given portfolio. The VaR of a distribution function over a given time horizon and probability p, while p is one minus the VaR confidence level, is defined as:
 | (1) |
 is the inverse of F. Value at Risk (VaR) estimate the maximum loss with the given probability an investor may suffer over a given time period. As mentioned by Jorion [4], a general definition of VaR is that it is the smallest loss, in absolute value, such that
  For example, a 99% confidence level (i.e., a = 0.99). Value-at-Risk then is the cut-off loss such that the probability of experiencing a greater loss is less than 1 per cent.
3.1. The Normal Density Estimator
- When the returns follow a Gaussian distribution with mean and unknown variance σ2, an estimator of VaR at (1 − α) confidence level is given by:
 | (2) |
 | (3) |
3.2. Extreme Value Theory Approach
- The extreme value theory (EVT) deals with these extreme events, providing a classification of continuous distributions according to the behavior of the tail region. The theory distinguishes three limiting stable distributions for the maximum values of a random variable, called Generalized Extreme Value Distributions (GEV), and the three associated Generalized Pareto Distributions (GPD), which are the limiting distributions for the tail region of the pertinent distribution.The generalized Pareto distribution is considered to be a natural choice for modeling the excess losses above a sufficiently high threshold u. The distribution function of generalized Pareto distribution is;
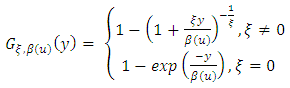 | (4) |
 and
and  when
when  , and
, and 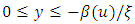 when
when  Estimates of the parameters
  and
and  can be obtained from
  by the method of maximum likelihood.Given
  i = 1, 2,..., n, the estimate of VaR is given by:
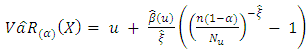 | (5) |
 is the number of observations above the threshold level
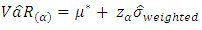
3.3. New Estimator Based on Weighted Mean
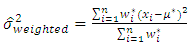
- The study proposed a new VaR model known as the weighted estimator.Let
 be a set of random variables with the weighted mean given by
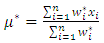 | (6) |
 | (7) |
 | (8) |
 | (9) |
 | (10) |
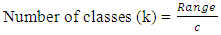
 while the weight for each class is given as
  the weight for each class is given by
 | (11) |
3.4. Kupiec Likelihood Ratio Test
- For the purpose of testing VaR models more precisely, the Kupiec Likelihood Ratio test is adopted to test the effectiveness of our VaR models. A likelihood ratio test developed by Kupiec [21] will be used to find out whether a VaR model is to be rejected or not. The number n of VaR violations in a sample of size T has a binomial distribution, n ∼ B(T, p). The failure rate is n/T and, ideally, it should be equal to the left tail probability, p.The null H0 and alternative H1 hypotheses are:

 where
where  for all t.Then, the appropriate likelihood ratio statistic is
 | (11) |
 or if the p-value =
  is less than
  This likelihood ratio is asymptotically
  distributed under the null that p is the true probability the VaR is exceeded.
4. Results
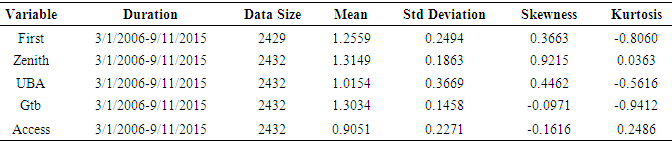
- The data of the study comprises of the share price of five listed banks in the Nigerian Stock Exchange. The descriptive statistics are tabulated in Table 1.
|
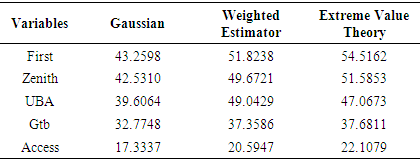
4.1. Estimation of VaR with Various Estimators
- The estimates of value at risk for various banks.
|
4.2. Kupiec Likelihood Ratio Test of the Various Estimator of VaR (in Sample)
- The likelihood ratio test to check whether the VaR estimates represent the chosen quantile.The in-sample comparison of the various estimators of VaR estimates shows that the p-values for all 5 banks are less than the value of
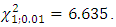 Also, it is expected that if the estimator is well specified that the failure rate should be the same or at worse very close to the value
  If p-value is more than
  then the performance of the estimator is better. Table 3 indicates failure rates from the Gaussian estimator are not very close to
  In the case of Extreme value estimator, the p-values for only First bank (0.0415), is greater than
  Also, the failure rates for all 5 banks are smaller than that of Extreme value estimator, and hence closer to
|
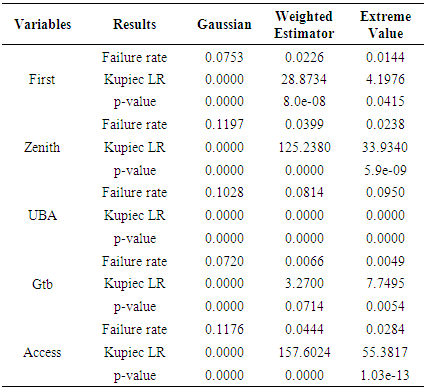
4.3. Prediction of VaR with the Various Estimator
- The prediction of value at risk was done using the out of sample data with the various estimators of VaR.Table 4 shows that Weighted Estimator had the highest value in almost all the variables.
|
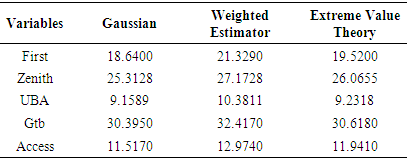
4.4. Kupiec Likelihood Ratio of the Various Estimations of VaR (out of Sample)
- The Kupiec Likelihood Ratio test using the predicted values of VaR with the various estimators.The out-sample comparison of the various estimators of VaR shows that the p–values for all 5 banks are less than the value of
 . Also, it is expected that if the estimator is well specified that the failure rate should be the same or at worse very close to the value
  . If p-value is more than
  then the performance of the estimator is better. Table 5 indicates failure rates from the Gaussian estimator are not very close to
  in most of the banks. Consequently, the null hypothesis that states that the Gaussian model specifies the VaR correctly is rejected in gtb bank and access bank. In the case of Extreme value estimator, the p-values for zenith bank (0.01027), uba bank (0.3717) and gtb bank (0.1484) are greater than
|
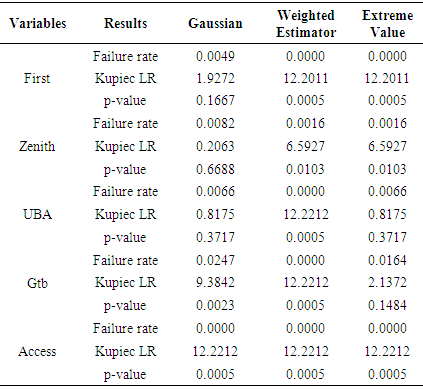
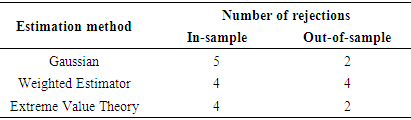
 . The extreme value estimators outperformed the other methods because it had the least number of rejections.
|
5. Discussion
- The results of VaR estimation with the different methods at a 99% confidence level, revealed the order of the sequence will be extreme value theory, Gaussian and weighted estimator. The Kupiec Likelihood Ratio test of the various estimates of VaR with in sample data conducted. If the daily VaR estimates are computed at 99% confidence for 2432 trading days for all the banks, we would expect on average 243 VaR exceptions or violations, to occur during this period. In Kupiec test we would then examine whether the observed amount of exceptions is reasonable compared to the expected amount. In Table 4, failure rates from the Gaussian estimator are not very close to, the null hypothesis that states that the Gaussian model specifies the VaR correctly is rejected. In the case of Extreme value estimator, the p-values for only First bank (0.0415) is greater than
 The extreme value theory can be a good estimator of first bank. It was shown that the weighted estimator at p-value of 0.0714 of GTB was able to estimate VaR correctly.The predicted Value at Risk of banks with various estimators using out-sample, with
  = 0.01, revealed that extreme value theory outperformed other estimators in predicting VaR. If the daily VaR estimates are computed at 99% confidence for 608 trading days for all the banks, we would expect on average 61 VaR exceptions or violations to occur during this period. The extreme value theory shows that the p-values for Zenith (0.0103), UBA (0.3717) and Gtb (0.1484) were more than alpha level of 0.01. Out-of- sample testing results confirm the good performance of extreme value theory.
6. Conclusions
- The in-sample prediction failure rates for Gaussian estimator and weighted estimator are not very close to
 compared to extreme value estimator, consequently, the null hypothesis that states that the models specifies the VaR correctly is rejected, although the failure rates for all the banks with extreme value estimator are more closer to
  compared to other estimators. The weighted estimator at p-value of 0.07141 of GTB suggests the estimation method was able to estimate VaR correctly. If the daily VaR estimates are computed at 99% confidence for 608 trading days for all the banks, we would expect on average 61 VaR exceptions or violations to occur during this period. The out-of –sample prediction indicates the extreme value theory with the p-values: 0.0103 (Zenith), 0.3717 (UBA) and 0.1484 (Gtb) have specifies VaR correctly (P-values greater than alpha level of 0.01). Out-of-sample predictions results confirm the good performance of extreme value theory.