-
Paper Information
- Paper Submission
-
Journal Information
- About This Journal
- Editorial Board
- Current Issue
- Archive
- Author Guidelines
- Contact Us
International Journal of Statistics and Applications
p-ISSN: 2168-5193 e-ISSN: 2168-5215
2019; 9(4): 111-116
doi:10.5923/j.statistics.20190904.02

An Adaptive Test for Exponentiality Based on Empirical Quantile Function
 Abstract
 Reference
 Full-Text PDF
 Full-text HTML
Mbanefo S. Madukaife
Department of Statistics, University of Nigeria, Nsukka, Nigeria
Correspondence to: Mbanefo S. Madukaife, Department of Statistics, University of Nigeria, Nsukka, Nigeria.
| Email: |  |
Copyright © 2019 The Author(s). Published by Scientific & Academic Publishing.
This work is licensed under the Creative Commons Attribution International License (CC BY).
http://creativecommons.org/licenses/by/4.0/

A new technique for testing whether or not a set of data is drawn from an exponential distribution is proposed in this paper. It is based on the equivalence property between kth order statistic and the pth quantile of a distribution. The critical values of the test were evaluated for different sample sizes through extensive simulations. The empirical type-I-error rates and powers of the proposed test were compared with those of some other well known tests for exponentiality and the result showed that the proposed technique can be recommended as a good test for exponentiality.
Keywords: Exponentiality, kth order statistic, Sample quantile function, Empirical critical value, Empirical power
Cite this paper: Mbanefo S. Madukaife, An Adaptive Test for Exponentiality Based on Empirical Quantile Function, International Journal of Statistics and Applications, Vol. 9 No. 4, 2019, pp. 111-116. doi: 10.5923/j.statistics.20190904.02.
Article Outline
1. Introduction
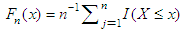
- One of the most important distributions that are mostly used in statistical analysis is the exponential distribution. Its importance is often seen in lifetime modelling, reliability theory, failure mechanism of systems, queuing theory and renewal processes. As a result of this wide application, several characterizations of the exponential distribution have been discovered in the literature. Some of them include the memory-less property, constant hazard rate property and closed form distribution function.In statistical data analysis, the problem of testing the goodness of fit of the data set to a known statistical distribution has always been an important challenge. The importance of goodness of fit cannot be overemphasized. Most parametric statistical methods are not robust to distributional assumptions, hence the goodness of fit test in order to ensure appropriateness of methods and acceptability of results. Suppose that X is a non-negative random variable with cumulative distribution function (cdf) given by
 and probability density function (pdf)
  . Let a random sample
  be drawn from an unknown distribution with cdf
  and pdf
  . The problem of goodness of fit test for exponentiality is that of testing the hypotheses:
 | (1) |
2. The Proposed Statistic
- Suppose X is a non-negative random variable which is exponentially distributed with pdf
 and cdf
  . The quantile function
  is given by:
 | (2) |
 such that the parameter
  in the resulting variable Y is equal to 1, then the pdf and the cdf will respectively be
  and
and  , and the quantile function associated with
  is given by:
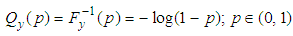 | (3) |
 obtained from an unknown non-negative continuous distribution, the order statistics obtained from the random sample are
 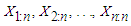 where
where  is the jth smallest observation in the sample of n observations. That is,
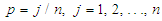
 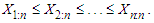 Xu and Miao [19] have stated that the pth quantile of a distribution can be estimated by either the sample pth quantile of the distribution or the appropriate kth order statistic of a sample drawn from the distribution. The sample pth quantile of a distribution, denoted by
  is obtained as the inverse of the sample distribution function, also known as the empirical distribution function, which is denoted by
  . For
. For  ,
, | (4) |
 which is the number of observations in the random sample that are less than or equal to
  divided by n. Let the number of observations in the sample that are less than or equal to
  be j. Then
  . Hence,
  can be approximated by
  . Madukaife [20] has shown that the approximation holds, provided
 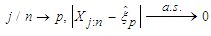 , see also Xu and Miao [19] and Serfling [21].From the foregoing, the sample pth quantile of a distribution can be given as
 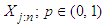 where
where  . The problem now is to obtain a distance function
 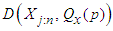 ;
;  which for each j measures the distance apart between the sample and population quantiles. This function is adapted from Madukaife [22] and Madukaife and Okafor [23,24] as the sum of squared deviations of the sample quantiles from the population quantiles. For the exponentiality test, this is given by:
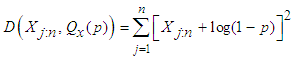 | (5) |
 , the parameter of the exponential distribution, the sample observations are first rescaled (standardized) by
  where
where  . Then the order statistics of the rescaled observations are obtained as
  such that
  is the jth order statistic of the rescaled observations. Also, estimating p by
  will obviously give inappropriate results especially at the extreme order statistics. van der Vaart [25] has shown that
  for
for 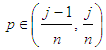 . Taking the average of the limits in the interval of p for which the sample quantile of a distribution equals the jth order statistic gives
  . Therefore, an appropriate statistic for testing the goodness of fit for exponentiality of a data set is given by:
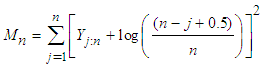 | (6) |
 . Also, its consistency against any fixed alternative is guaranteed since the quantile function of the null distribution is unique. The test rejects null hypothesis of exponentiality for large values of the statistic
  .
.3. Empirical Critical Values of the Test
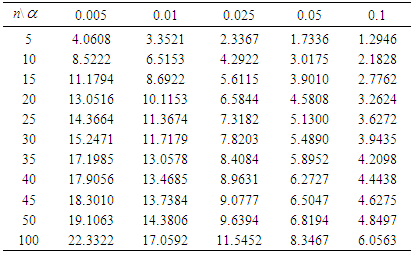
- In classical test of hypothesis, a critical value that is appropriate for a test is always needed in order for correct judgment on the rejection or otherwise of the null hypothesis to be passed. It is usually obtained from the exact or asymptotic distribution of the test statistic. When this is done, the test is regarded as exact or asymptotic test respectively. The exact or asymptotic distribution of the statistic that is proposed in this paper is however not known. The critical values of this test therefore shall be obtained empirically through extensive simulation studies. It is important to note here that the applicability of the statistic in real life situations will be hampered by lack of critical values for all possible sample sizes at all levels of significance. This is because in empirical evaluation of critical values especially as embodied in a paper like this, only a few sample size situations and levels of significance are considered. Although beyond the scope of this paper, this set back can be well taken care of by obtaining a function for the empirical p – values of the test through extensive bootstrapping. This means that for any sample size situation, the empirical p – value is obtained which will be compared with the appropriate level of significance for the test in order for judgment to be passed on the rejection or otherwise of the null hypothesis of exponentiality. With this, applicability of this statistic is always guaranteed.In this paper, the empirical critical values of the proposed statistic are evaluated at five different levels of significance and 11 different sample sizes. The levels of significance are
 = 0.005, 0.01, 0.025, 0.05 and 0.1 while the sample sizes are n = 5 (5) 50 (50) 100. In each of the sample size situations, 100,000 samples are generated from the standard exponential distribution. In each of the generated samples, the value of the statistic is evaluated, resulting in 100,000 values of the statistic. The
  - level critical value of the test is obtained as the
  percentile of the values. The percentiles are presented in Table 1.
|
4. Empirical Power Studies
- Assessing the relative power of the statistic proposed in this paper involves comparing its power performance with the powers of some other good tests for exponentiality in the literature. These good tests in the literature (also regarded as competing tests) which are considered in this work are presented in what follows.The Kolmogorov – Smirnov
 TestLet
  be the jth observation of a random sample of size n and let
  , where
 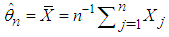 , be the scaled form of the observation
  . Also, let
 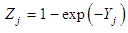 be the transformed form of
 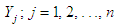 and
and  be the jth order statistic of the transformed data. The Kolmogorov – Smirnov (K-S) test rejects the null hypothesis of exponentiality for large values of the statistic given by:
 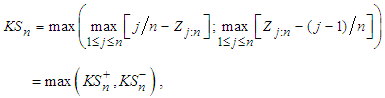 where
where 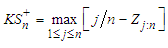 and
and 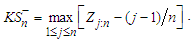 The Anderson – Darling
  TestLike the Kolmogorov – Smirnov
  test, this goodness of fit procedure rejects the null hypothesis of exponentiality for large values of the statistic which is given by:
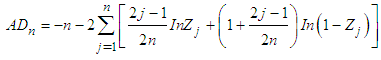 where
where  has its usual meaning.The
  Test of Cox and Oakes [6]Cox and Oakes [6] developed a two-sided test of exponentiality whose statistic:
 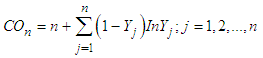 where
where  remains the scaled form of
  . The statistic rejects the null hypothesis of exponentiality for both small and large values of
  .The
.The  Test of Baringhaus and Henze [9]With an appropriate choice of a smoothing parameter “a”, Baringhaus and Henze [9] proposed a test of exponentiality which rejects the null hypothesis for a large value of the statistic:
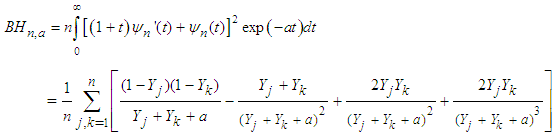 The test is said to be consistent against any distribution with positive finite mean
  .The
.The  Test of Baratpour and Habibirad [15]Baratpour and Habibirad [15] obtained an estimator of the cumulative residual entropy
  of a distribution
  and by using the cumulative Kullback – Leibler (CKL) divergence between two distributions, proposed the statistic
  for testing exponentiality of data sets.
 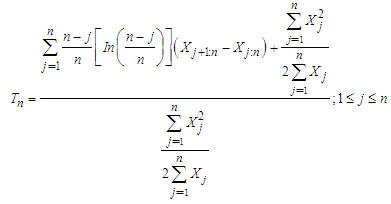 The null hypothesis of exponentiality is rejected for large values of
  and the statistic is said to be consistent against any fixed alternative.The
  Test of Sadeghpour, Baratpour and Habibirad [17]Sadeghpour, Baratpour and Habibirad [17] improved on the work of Baratpour and Habibirad [15] by introducing a statistic that is based on the equilibrium distance using the Renyi divergence. The statistic is given as:
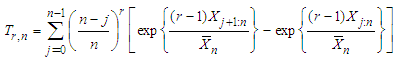 The test is affine invariant and rejects the null hypothesis for large values of the statistic.A total of 10,000 samples in each case of sample size, n = 10, 25, 50 and 100 are generated from six different distributions with different parameter values. The distributions include:• The standard exponential distribution with pdf
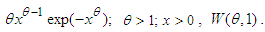
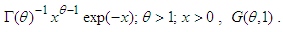
 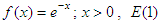 .• Weibull distribution with probability function,
 • Gamma distribution with probability function,
 • Uniform distribution in the interval (0, 1),
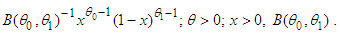
  .• Beta distribution with probability function,
 • The standard lognormal distribution with pdf,
 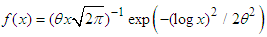 ;
; 
 The values of the seven statistics being compared are evaluated in each of the 10,000 simulated samples and the power of each test obtained as the percentage of the 10,000 samples that is rejected by the statistic at 5 percent level of significance. The power performance of each of the tests is presented in Table 2.
|

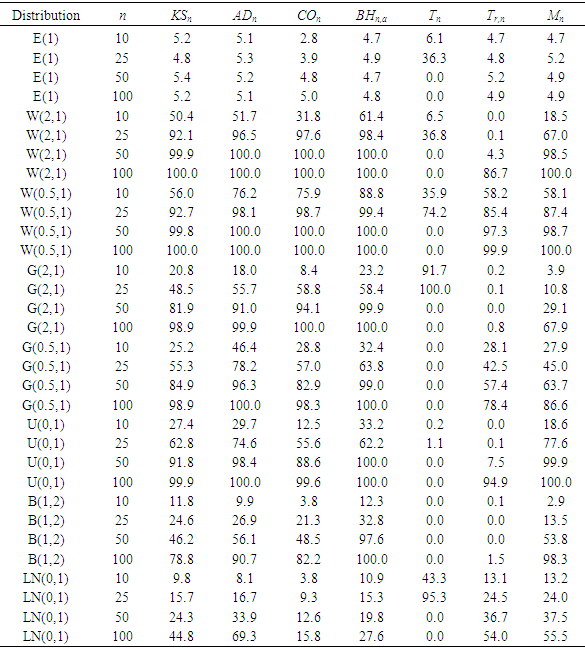
 . This is because none of the tests except the
  gave the power under the null distribution of exponentiality greater than 5.4% and since the power in this case supports the null hypothesis, it is also known as the empirical type-1-error rate. Lack of control over the type-1-error is a serious deficiency of a goodness of fit statistic. In addition, the proposed test equally does not conserve the type-1-error as all its values range from 4.5% to 5.4% as against the
  and the
  .Distributions alternative but contiguous to the exponential distribution may be classified according to their hazard functions as those with increasing hazard rate, those with decreasing hazard rate and those with non-monotone hazard rate. This study considers all these classes of distributions and the proposed statistic maintained an appreciable power in all the classes. In each of the alternative distributions, the power performance of the statistic continued to increase as the sample size increased. These show that the proposed statistic is both omnibus and consistent.Compared to the power performances of the other statistics in this paper, the proposed statistic is no doubt not the best as no test can be adjudged to be the best. However, the power performances show that it is very competitive especially at large samples.
5. Conclusions
- It has been observed from the foregoing that there is no shortage of tests for exponentiality in the literature. Some of these tests however have been observed to be more effective in some classes of distributions alternative to the exponential than some other classes. Also, some are found to be deficient with respect to some properties of a good goodness of fit procedure. The basic properties of a good statistic for a goodness of fit test are affine invariance, consistency, good control over type-1-error and generally good power performance. The test statistic proposed in this paper satisfies all these qualities. Hence, the statistic Mn can be recommended as a good test for assessing exponentiality of a data set.