-
Paper Information
- Paper Submission
-
Journal Information
- About This Journal
- Editorial Board
- Current Issue
- Archive
- Author Guidelines
- Contact Us
International Journal of Statistics and Applications
p-ISSN: 2168-5193 e-ISSN: 2168-5215
2019; 9(3): 79-91
doi:10.5923/j.statistics.20190903.03

Expected Life Time at Birth in Kerala
 Abstract
 Reference
 Full-Text PDF
 Full-text HTML
Saheeda C. O.
Statistical Investigator, Taluk Statistical Office Tirur, Department of Economics and Statistics, Malappuram, Kerala, India
Correspondence to: Saheeda C. O., Statistical Investigator, Taluk Statistical Office Tirur, Department of Economics and Statistics, Malappuram, Kerala, India.
| Email: |  |
Copyright © 2019 The Author(s). Published by Scientific & Academic Publishing.
This work is licensed under the Creative Commons Attribution International License (CC BY).
http://creativecommons.org/licenses/by/4.0/

Life expectancy at birth is the average number of years a new born is expected to live given current conditions. Life Expectancy is one of the major indicators in human development that shows how long a person can expect to live on average given prevailing mortality rates. Technically it is the average number of years of life remaining to a person at a specified age, assuming current age–specific mortality rates continue during the person’s lifetime. Life-expectancy is the standard measure of the length of people’s life. Life expectancy can be computed at birth and at various ages. This study covers the period from 2006 to 2015. The life expectancy will be determined in this period. For this I took it 10 years death rate in Kerala for calculating probability of dying. That means through this I have been able to do 10 years time series. I am including in this paper Expected life time at birth in Kerala 2006-2015. Here life expectancy viewed with a life table for 10 years. Using this we can distinguish differences. Mainly life expectancy was found using the death rate.
Keywords: Life expectancy, Life Table, Mortality rate
Cite this paper: Saheeda C. O., Expected Life Time at Birth in Kerala, International Journal of Statistics and Applications, Vol. 9 No. 3, 2019, pp. 79-91. doi: 10.5923/j.statistics.20190903.03.
Article Outline
1. Introduction
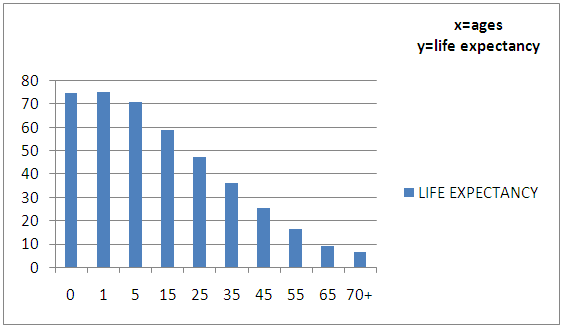
- Life expectancy is defined as the average number of years that a person could expect to live, if he or she experienced the age-specific mortality rates prevalent in a given country in a particular year. The maximum life span—the longest number of years a human being has lived has increased spectacularly as well. There is little disagreement over these facts. Scholarly opinion diverges, however, as to whether these increases will continue or whether human longevity is approaching its limit. A life table presents a set of tabulations that describe the probability of dying, the death rate and the number of survivors for each age or age group. Accordingly, life expectancy at birth is an output of a life table. Data sources are vital registration, census and surveys: Age-specific mortality rates required to compute life expectancy at birth. Life expectancy at birth is an indicator of mortality conditions and, by proxy, of health conditions. Life expectancy depends not only on a person's age and sex, but also on race, education, lifestyle characteristics (smoking, obesity, etc.), and medical risk factors such as diabetes and hypertension. Life expectancy is a statistical measure of the average time an organism is expected to live, based on the year of their birth, their current age and other demographic factors including gender. The most commonly used measure of life expectancy is at birth (LEB), which can be defined in two ways. Cohort LEB is the mean length of life of an actual birth cohort (all individuals born given year) and can be computed only for cohorts born many decades ago, so that all their members have died. Period LEB is the mean length of life of a hypothetical cohort assumed to be exposed, from birth through death, to the mortality rates observed at a given year. WHO introduced healthy, life expectancy as a measure of the level of health attained by population in the WHO report (2000). The pace of increasing life expectancy in recent decades came as a surprise to demographers, as mortality rates unexpectedly improved at the oldest ages in developed countries. Available evidence suggests individuals tend to under estimate how long they may live. Population mortality forecasts are generally conservative and poorly explain longevity uncertainties. This thesis examines how can incorporate Statistics in social survey. The method emphasizes the life course or cohort approach. In Mathematical term, life expectancy refers to the expected number of years remaining for an individual at any given age. In formulaic terms, life expectancy is denoted by ex where e represents the expected number of years remaining and x represents the person’s percentage. The life expectancy for a particular person or population group depends on several variables such as their life style, access to health case, diet, economical status and the relevant. This number is determined based on the statistical average, considering many factors, including year and place of birth, race, education level, income, and medical history. Nationality is one of the most significant factors in determining one’s life expectancy in his place of birth. In Kerala life expectancy would be higher due to the decrease of infant mortality rate. Life expectancy most often is referenced as at birth and derived through life table calculations, although such calculations allow for estimation of life expectancy at a series of age intervals. Life expectancy at birth is a standardized summary measure, sometimes used as an overall gauge of health, based on a population’s age structure and mortality experience. As such, it is an index of the level of mortality within a population, and it represents a hypothetical number of years a newborn would live, on average, if he or she experienced the prevailing or some other set levels of mortality within each age group as he or she aged. Population health is becoming better all over the world and therefore people everywhere are living longer. Life expectancy is the most commonly used measure to describe population health; others are for instance mortality and morbidity. I will consider life expectancy, maternal mortality and infant mortality as indicators of global health and analyze their intercountry and time changes. “Health life expectancy estimates the years in full health that a person can expect to live on the basis of the current mortality and morbidity rates “Life expectancy at birth varied and increased over time. There is an important difference in life duration, especially between low-income countries and high-income ones, although an important improvement took place in the last 2/3 decades in low-income countries. Everywhere females live longer than males. Over population has become a huge problem in the world today. There has been a decline in the death rate and a rise in the birth rate. This is because of all the accomplishments the world has made technologically. Nowadays were able to stop a disease before it affects you. From 1950 to the present time there have been many causes for overpopulation such as, decline in death rates, technological advancement and fertility treatment, better medical facilities, baby boomers and immigration issues. On the other hand there have been several impacts including, depletion of natural resources, diseases, and jobs and unemployment. The decline in the death rates has been more of a problem in some places than others. From 1950 to present time the life expectancy has been creeping up higher and higher. This is a good thing since its allowing people to live a more fulfilled and longer life. Although this does bring some problems to fruition, especially in place that have more people being born than dying. China is one of these places. China is one of the few places that have put a law on the amount of kids each family is allowed to have due to this issue. If a family were to have an extra kid they would be heavily taxed due to their misdemeanor. Some of the reasons that are causing higher death rates is a rise in food surplus allowing more people to have food and more of it. In the List of Indian states by life expectancy at birth, Kerala still has the highest overall life expectancy at birth, at 74.9 years -- 72 for men and 77.8 for women -- according to the Sample Registration System (SRS). Delhi is second, with an overall life expectancy at birth of 73.2 years, 72 for men and 74.7 for women. Thus, according to the number crunchers at the Social Security Administration, a 65-year-old woman today has an average life expectancy of 20 years and a 65-year-old man an average life expectancy of 17.6 years. That means that 50% of today’s 65-year-old women will live past age 85 and 50% of today’s 65-year-old men will live past age 82. This numerical estimate is an important starting point for grappling with the greater unknown, which is how long you’ll actually live. If you’ve just recalibrated your life expectancy, the next step is to make sure your retirement plan is, in fact, built to last as long as you need. While nailing the proper asset allocation strategy for your portfolio is obviously important hint: you’ll want to keep owning some stocks in your 70s and 80s to help protect against inflation there are other pieces of the puzzle to consider. Optimize your Social Security claiming strategy, as well as your pension (if you have one), to provide the maximum benefit to the surviving spouse. Explore whether long-term care insurance makes sense for your situation. Through many scientists’ hard work and research they have reason to believe that it could actually be possible for the average life expectancy to reach 112 years of age. However, with these scientists’ getting closer to figuring out the secrets of aging come many social, legal, and ethical issues. In this paper I will talk about two forms of life extending technology that are currently available, the social, legal, and ethical issues involving life extending technology, why I believe life extending technology is a negative right, and why I believe that medical scientists’ should continue researching life extending technology. Currently medical scientists’ do not know the secrets of aging. However, there are a few ways that they have discovered could help you maintain a longer life. Through my research I discovered that there have been many studies done in which rodents have been fed 40 percent fewer calories as a result have lived 40 percent longer than normal. This process is known as caloric restriction. The disparities between different socioeconomic classes and race play a critical role in why we are currently ranked 51st in the world in life expectancy according to the United States Central intelligence agency. Differences between life expectancy in the United States based on socioeconomic class and race are caused from several factors ranging from nutritional diet, to homicide rates that cause the imbalances of life expectancy; and cause the total life expectancy in our country to fall far from what it has the potential to be. There are solutions to this problem however; solutions that can be made that can shift these disparities between the high and low socioeconomic classes to a more even playing field. Before we can increase our country’s average life-span, we must identify the factors that cause the most significant contribution to our decline in life expectancy to make the greatest impact. Life expectancy and life span. But life expectancy has increased tremendously over the past few decades thanks to advances in medicine and improvements in lifestyle. The countries with a high average life expectancy will have a high population. The extremely rich countries will have a slightly smaller population as most people will be very career minded, some of the very poor third world countries will have a very high population but low life expectancy The rising life expectancy, declining birth rates and fertility control are some major factors related to the aging population and causing the rising of dependency ratio, increasing government spending on health care and pension, increasing the tax pay by current tax payers, shortage of working population and reducing capital flow in the money market. Among the problems, shortage of labor in the market is a serious concern to the government as labor is a key factor for the economic growth of a country. In order to solve the problems of the aging population, many government and scholars suggest some solutions to it. They propose to alter the immigration policy, raising the retirement age, encourage participation rate for older person and female workers and increase the birth rate. Life expectancy depends not only on a person's age and sex, but also on race, education, lifestyle characteristics (smoking, obesity, etc.), and medical risk factors such as diabetes and hypertension. As an individual gets older there are physical and mental changes that will occur. It might start with grey hair, skin that appears dull looking, a line across the forehead that intensifies into a wrinkle or difficulty remembering even the smallest of things. With this shifting world around us; everyone has different thoughts and feelings about getting older. Some people are afraid to get older because of the numerous disadvantages while others anticipate it because of the plentiful advantages. There are a number of advantages of being old. I have not experienced living with an individual over the age of 65; however, I managed to interview my grandmother 72-year old woman and I asked her to list some of the advantages she feels she has at her age as compared to when she was young. She admits that life slows down and there’s more time to enjoy herself and her family. She said that she has more knowledge of just about everything than she ever did before, lots of respect from others, a large extended family of her descent and an old age pension. One gains a deeper meaning of life and learns to enjoy the things that are really important - spouse, children, grandchildren, extended family and friends. The positive features of aging can be viewed as time of increased knowledge of life, wisdom and great achievements that can be passed onto the younger generations. The last thing old individuals want is for someone to have to take care of them, and lose their independence. When we have loved ones that depend on us for nurturing and financial support it can be difficult contemplating leaving them behind. Life tables are created based on an actual population from the present, as well as an educated prediction of the experience of a population in the near future. Other life tables in historical demography may be based on historical records, although these often undercount infants and understate infant mortality, on comparison with other regions with better records, and on mathematical adjustments for varying mortality levels and life expectancies at birth. From this starting point, a number of inferences can be derived. The probability of surviving any particular year of age remaining life expectancy for people at different ages.Time series are very frequently plotted via line charts. Time series are used in statistics, signal processing, pattern recognition, econometrics, mathematica finance, weather forecasting, earthquake prediction, electroencephalography, control engineering, astronomy, communications engineering, and largely in any domain of applied science and engineering which involves temporal measurements. The benefit of knowing life expectancy is mostly for planning.Ÿ For society to make plans to anticipate retirement ages, health care, and housing.Ÿ For governments, to anticipate the number of people who might need services as they age and plan for those services and to set ages that people become eligible for services.Ÿ For businesses, to help anticipate market conditions and make plans to maximize profits.Ÿ For individuals to make financial, employment, and lifestyle plans as they go through life.
2. Literature Review
- 1. Life expectancy in Developed Countries is higher than conventionally estimated. (Dalkhat M. Edieve) 2. Evidence at the micro level points to a robust positive causal relationship between life expectancy and human capital, see Jayachandran and Lleras-Muney (2009).3. Recent empirical investigations on the macro level, however, come to different conclusions about the causal impact of life expectancy on economic performance.4. Lorentzen, McMillan and Wacziarg (2008) use cross-country (longitudinal) data and evidence for higher life expectancy leading to faster economic growth. 5. Acemoglu and Johnson (2007), on the other hand, that improvements in life expectancy lead to some growth in aggregate incomes, but mainly trigger faster population growth, and therefore have a negative causal effect on income per capita.6. According to the office for national statistics there will be more than 16 million pensioners in 2037, a 30 percent increase on 12.3 million last year. This is largely due to improved health care.7. In Kerala as per 2001 census, The Expectation of life in Kerala (rural) is 72.4, with 69.3 for males and 75.8 for females.8. The times of India concluded that the life expectancy at birth for men stood at 64.6 years in 2008, up 1.8 years when compared to 2002.9. According to the WHO’s health statistics 2011, the global average life expectancy at birth stood at 68 years in 2009-an increase by two years since 2000WHO said since 1990 LE has increased globally by 4 years. (both sexes). However during the 1990’s it stagnated in Europe and decrease in Africa.10. According to the Statistics and Economics department of kerala, A women living in rural Kerala had the highest life expectancy at birth across all categories at 77.2 years. In contrast LE at birth was lowest at below 60 years for a rural male in MP. Rural males also lived longest in Kerala at 71.2 years.11. Life expectancy at birth now exceeds 79 years on average across the word (Panel A, HE1.1).12. The 25 years between 1983 and 2008 saw an average rise in life expectancy of about six years.13. Equally, rising house hold income inequality was not related to changes in life expectancy over the last generation at a country level (HE1.3).14. In Kerala as per 2001 census, the advancement in medical sciences has increased life expectancy of individual by providing quality healthcare and better nutrition. According to WHO, the world's population of people 60 years of age and older has doubled since 1980 and is forecast to reach 2 billion by 2050 (World Health Organization, 2012). Population ageing is occurring in parallel with rapid urbanization and globalization. The number of aged persons, as a proportion of the total population in Kerala, has increased at a rate double than the overall growth rate of population. This is a demographic pattern the state shares with other parts of the world. During the 1950’s, less than 6% of the population was aged 60 years or more, but it has now reached to 10 percent. In the 1950’s the number of aged persons constituted about 10% of the labour force, but this has grown to 15% in the year 2000. Kerala has set its trend in the growth profiles in a number of sectors, including demographic, economic and social. Besides the State Government, a number of NGOs and charitable and religious Institutions have initiated a number of programmes and schemes aimed at the welfare of the aged persons. But, they have not been full-fledged in their implementation. It has been felt that a comprehensive ground level study is required to formulate a comprehensive programme for the welfare of the senior citizens.
3. Methodology
- The methodology followed for preparing this work is mostly the primary and secondary data. The data for the study are collected for getting mortality rate and population of Kerala in the period 2006-2015.
4. Sample Design
- Several statistical tools have been used for the analysis of the data. The data are derived from Economics and Statistics department results, books, journals, reports, newspapers and online media on the subject. This data are processed to come to a conclusion, general and particular for each and every sample data. This study covers the period from 2006 to 2015. The life expectancy will be determined in this period.
5. Calculations
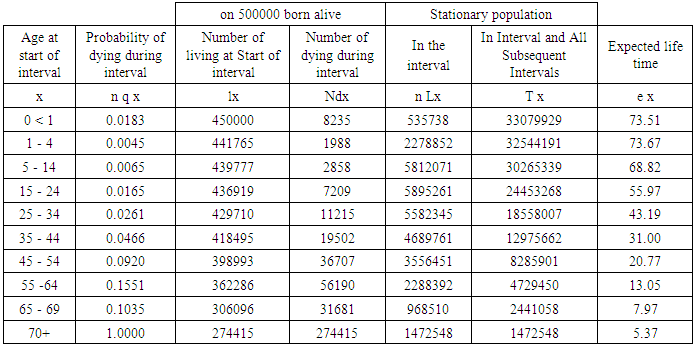
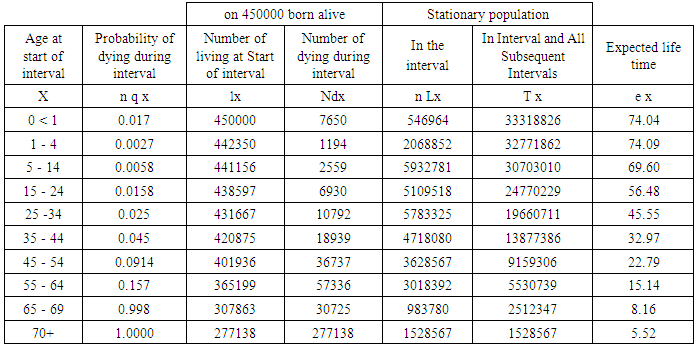
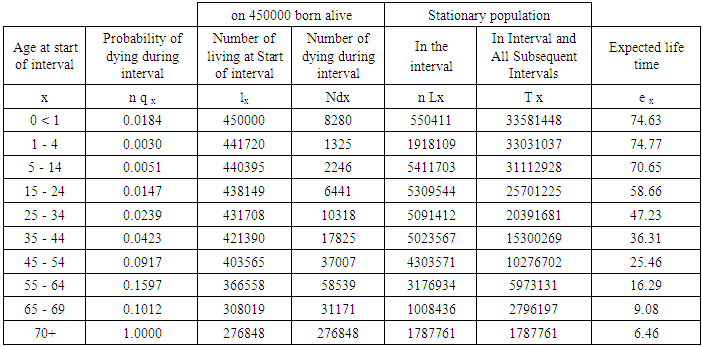
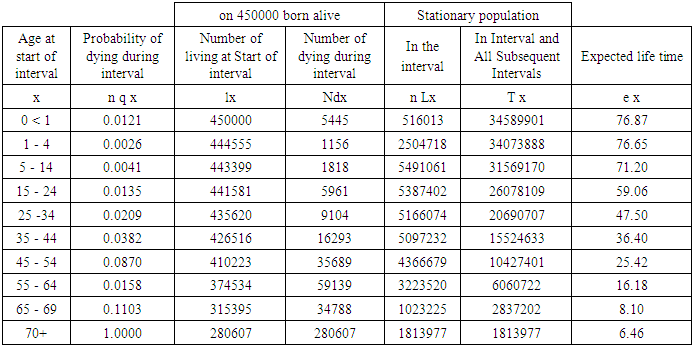
- There are several methods available, for calculating a life table and the resulting by product of life expectancy. The method described by Schoen is used (see reference below), which is relatively simple and accurate for producing abridged, period life tables (using ages 0<1, 1-4, 5-9, 10-14 . . . 70+). A bridged refers to life tables that contain data for age groups. Period means the current (or some other particular period’s) age-specific death rates are applied to the life table’s hypothetical cohort, instead of tracking a real cohort throughout their lives to see what levels of mortality the cohort actually experienced. Therefore, in the life table the lx column values and all those in the columns to the right are hypothetical, including life expectancy (Ex). x - The age in years at the start of the interval. The interval implied is the age at the start through to, but not including, the next stated age. nqx - the probability of dying during the interval. lx – the number alive at the start of the age interval of a hypothetical birth cohort of 4500,00 (or some other arbitrary starting number, called a radix). ndx – the number dying during the age interval of a hypothetical birth cohort of 450,000 experiencing the nqx values at each interval.nLx – the number of person-years lived during the age interval of a hypothetical birth cohort of 450,000 experiencing constant rates of mortality, number of births, age structure and size (called the stationary population).Tx - the total number of person-years lived in the age interval and all subsequent age intervals of the stationary population.
 - The expectation of life remaining at the start of the age interval.
  is calculated
  . The divisor is the number of years a person has left. The divisor plus your age equals your life expectancy. For example, for a 40 year old, the divisor is 42.5, thus your life expectancy according to the IRS table would be 82.5 years.
6. Life Tables
- LIFE TABLE FOR 2006
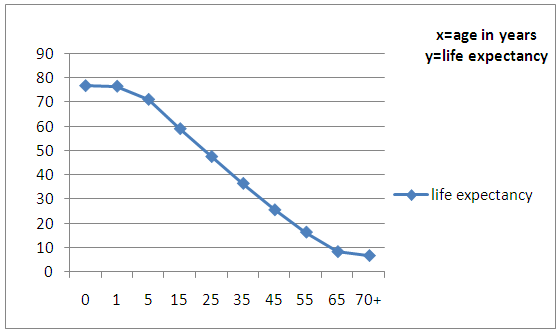
|
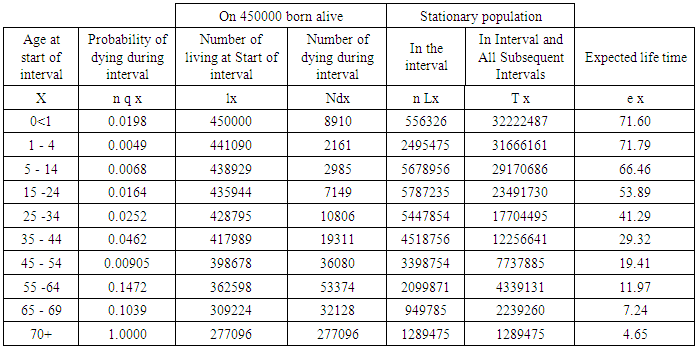
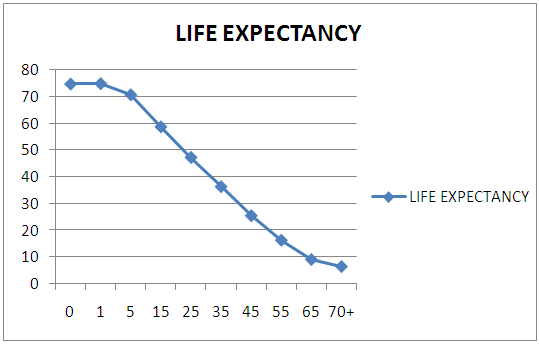
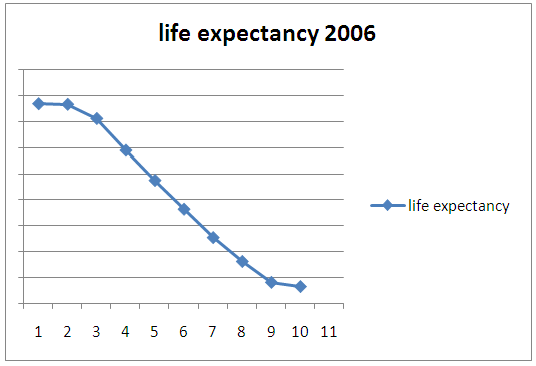 | Figure 1. Life expectancy for the year 2006 |
|
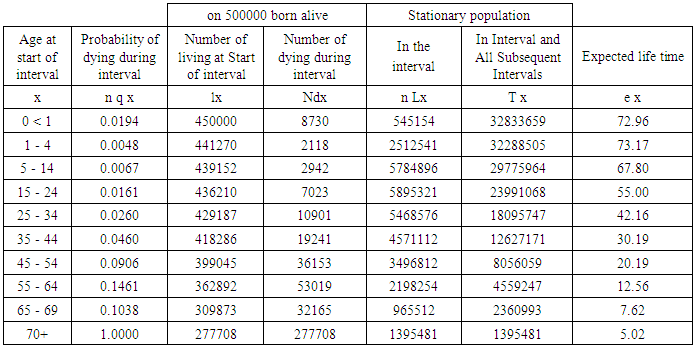
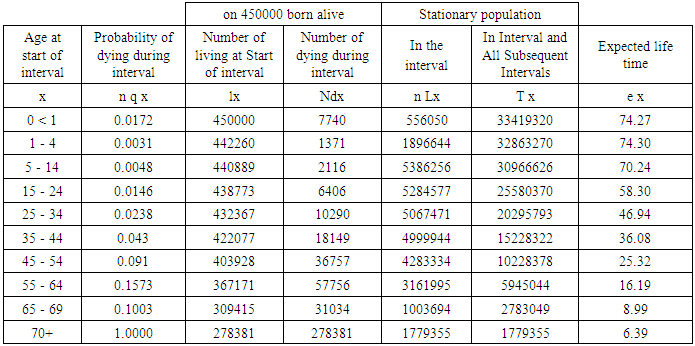
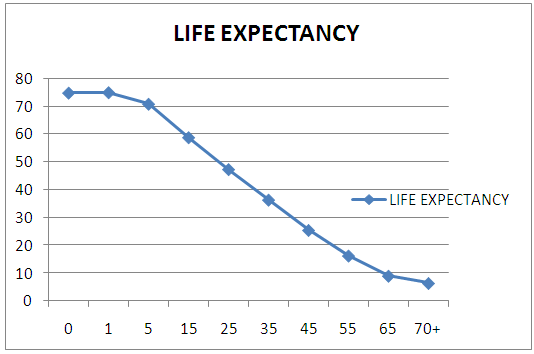
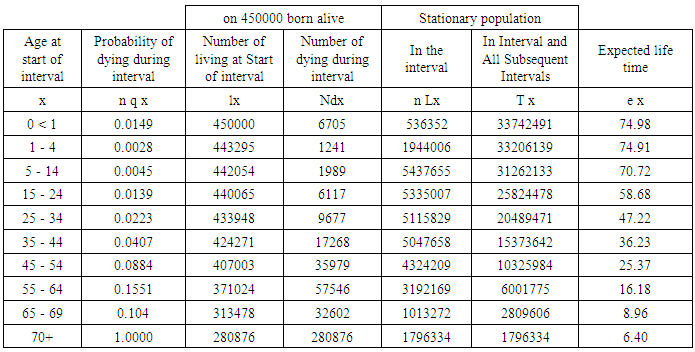
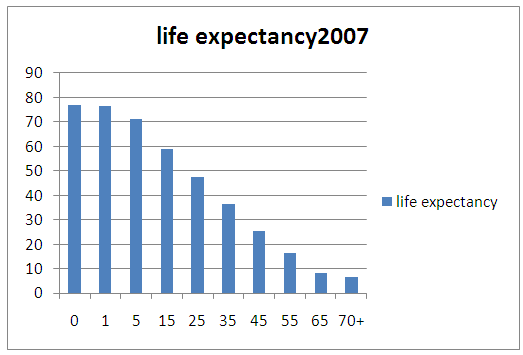 | Figure 2. Life expectancy for the year 2007 |
|
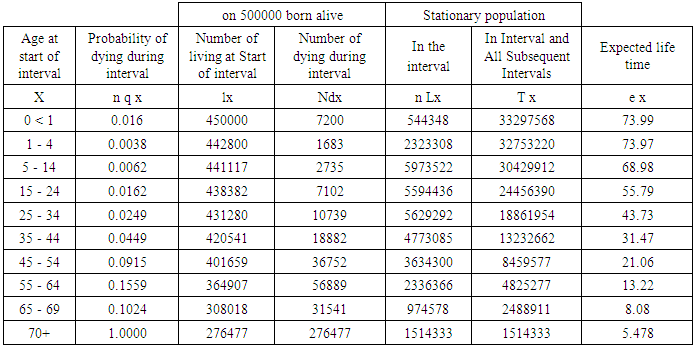
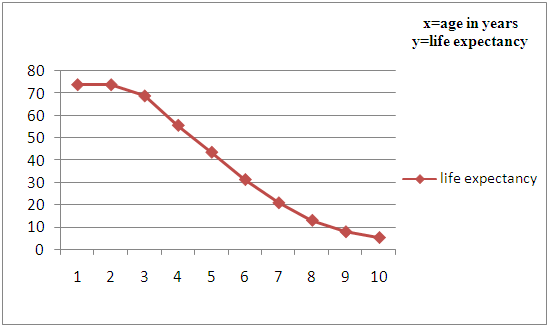
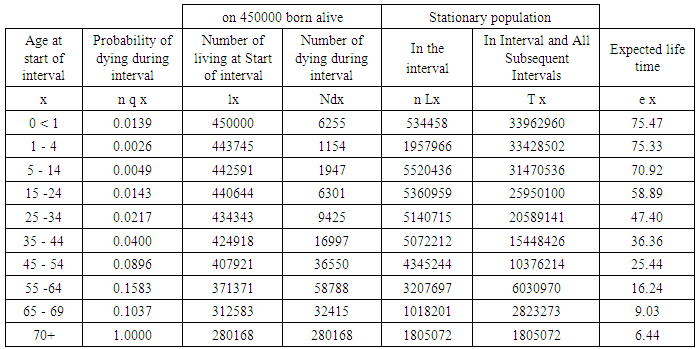
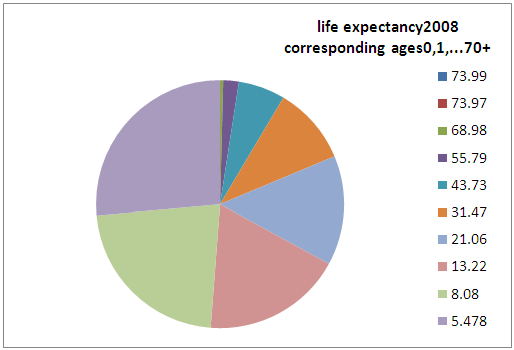 | Figure 3. Life expectancy for the year 2008 |
|
 | Figure 4. Life expectancy for the year 2009 |
|
 | Figure 5. Life expectancy for the year 2010 |
|
 | Figure 6. Life expectancy for the year 2011 |
|
 | Figure 7. Life expectancy for the year 2012 |
|
|
|
 | Figure 8. Life expectancy at birth for the year 2015 |
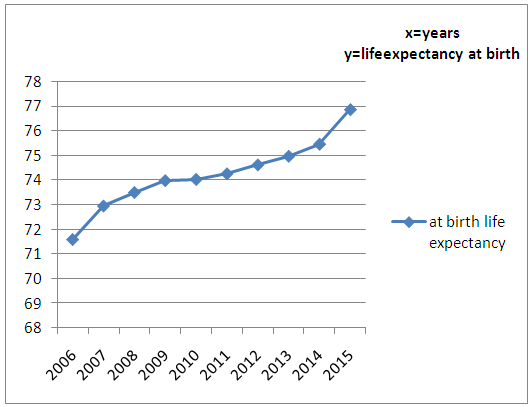
|
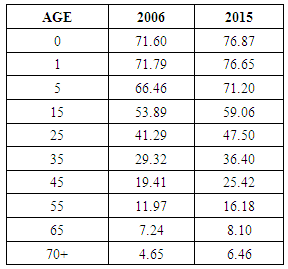
 | Figure 9. Life expectancy between 2006 and 2015 |
|
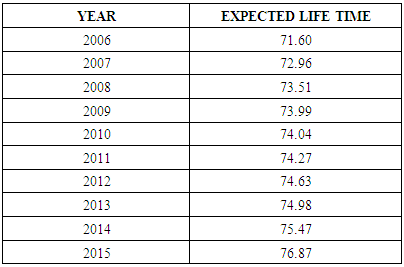
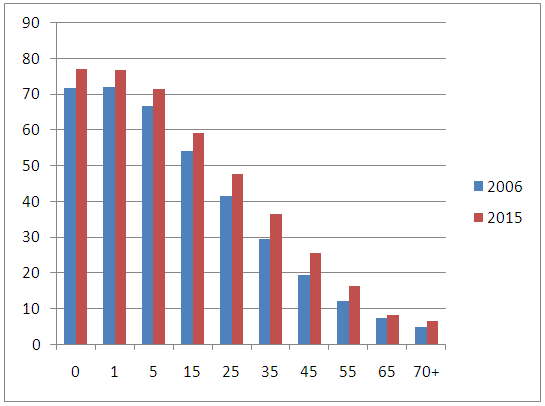
 | Figure 10. Life expectancy at birth for the years 2006 to 2015 |
7. Conclusions
- There is no conclusive way to say exactly how long a person will live, but life expectancy provides an effective measure to see how certain factors contribute to longevity. Life Expectancy is a summary measure used to describe over all health. Life expectancy at birth is the average number of years a new born is expected to live given current conditions. The life expectancy is the highest in recorded history thanks to public health interventions such as improvements in sanitation and food safety, development and use of vaccines, and health promotion efforts. Through this we can Ÿ To assess the present and past statistics of life expectancyŸ To understand the variation of life expectancy periodically.Ÿ To give future behavior of this dataŸ To understand the expected life time at present and share to all for molding life styleŸ To construct a one dimensional regression model for the life expectancy at birth and broadcast.Ÿ It helps in predicting, forecasting and planning, means On the basis of trend we can forecast the future behavior on the assumption that the past behavior will continue in the future also. Ÿ To help for evaluating current programmes.These numbers have been broken down further to take into account the differences across a wide range of demographics. In general, the most recent data was positive, with groups either staying where they are or seeing life expectancy gains, except for a few cases. However, even these modest gains still leave the Kerala behind many other developed states. The reasons for this shortcoming are manifold, ranging from high infant mortality rates to smoking tobacco. Regardless of the results, though, life expectancy can provide people with a good baseline for how long they might live and what factors contribute to longevity. Forecasting life expectancy and mortality forms an important subdivision of demography. Future trends in life expectancy have huge implications for old-age support programs like Social Security and pension since the cash flow in these systems depends on the number of recipients who are still living (along with the rate of return on the investments or the tax rate in pay-as-you-go systems). With longer life expectancies, the systems see increased cash outflow; if the systems underestimate increases in life-expectancies, they will be unprepared for the large payments that will occur, as humans live longer and longer.There are many causes which have permitted in the last years increase peoples life expectancy. I consider peoples are living longer thanks to government policies on publics health and due in most part to the great medical technological advances that have been made in the last decades. Causes and immunization against many diseases have been found. States with greater life expectancy definitely were that had the highest income. There are many factors that affect the rate of average life expectancy. Nutrition, water supplies and health services are all very influential to longevity. With many new innovation an advance in technology which continue to progress over time states are able to increase food and water resources. There for states have main access to an abundance of these sources have a greater rate of life expectancy than opposing states that lack such commodities. In the last century health care has improved greatly including managing diseases better and now they have an improvement in technology that can detect illness earlier and therefore become treatable.’ Today doctors have access to a greater number of equipment and tests to assist in diagnosing illnesses as little a common cold to a rare genetic disorder. When we are born and growing up we now have vaccines to protect us from diseases and this is another example how health care has improved. There is also better medicine nowadays. Long ago before the life expectancy was very low and the people were not living more than 70 years where as today it has risen up and people can live for more than 75 years which is a great difference than previous years. people who have wealth an live in the developed states are usually healthy compare to people who are destitute an live in the developing states. Life expectancy is not only affected by social level but also by other factor.