-
Paper Information
- Next Paper
- Paper Submission
-
Journal Information
- About This Journal
- Editorial Board
- Current Issue
- Archive
- Author Guidelines
- Contact Us
International Journal of Statistics and Applications
p-ISSN: 2168-5193 e-ISSN: 2168-5215
2019; 9(2): 53-58
doi:10.5923/j.statistics.20190902.02

Efficiency of the Reliability Function and Scheduling Method in Determining the Optimal Preventive Maintenance Time for Digital X-Ray Devices
 Abstract
 Reference
 Full-Text PDF
 Full-text HTML
Mohammed Mohammed Ahmed Al mazah1, 2
1Mathematics Department, College of Sciences and Arts (Muhyil), King Khalid University, KSA
2Mathematics and Computer Department, College of Sciences, Ibb University, Yemen
Correspondence to: Mohammed Mohammed Ahmed Al mazah, Mathematics Department, College of Sciences and Arts (Muhyil), King Khalid University, KSA.
| Email: |  |
Copyright © 2019 The Author(s). Published by Scientific & Academic Publishing.
This work is licensed under the Creative Commons Attribution International License (CC BY).
http://creativecommons.org/licenses/by/4.0/

This paper aims to determine the optimal time for preventive maintenance of digital x-ray devices in radiology department. It assumes that the time variable has the same distribution for all devices according to the Weibull distribution. The method of estimating distribution parameters is the maximum likelihood method. This research paper is of a great importance for both patients and hospital management. The management will benefit from reduced maintenance costs, and the patients will benefit from service continuity or non-stop service. The paper followed the analytical descriptive method using two different methods which are the scheduling method and the reliability function based on data on the cost of maintenance and the cost of stopping work for maintenance. The findings of the study revealed that both methods were efficient in determining the optimal time for preventive maintenance and in reducing the cost of maintenance to nearly 33% per year. The reliability function was more efficient in determining the optimal time for preventive maintenance in terms of continuity of devices in service without interruption.
Keywords: Reliability function, Scheduling techniques, Maximum likelihood, Weibull distribution, Preventive maintenance
Cite this paper: Mohammed Mohammed Ahmed Al mazah, Efficiency of the Reliability Function and Scheduling Method in Determining the Optimal Preventive Maintenance Time for Digital X-Ray Devices, International Journal of Statistics and Applications, Vol. 9 No. 2, 2019, pp. 53-58. doi: 10.5923/j.statistics.20190902.02.
Article Outline
1. Introduction
- Many companies are enjoying the benefits from applying statistical methods to production functions. However, statistical methods are equally beneficial when applied to maintenance functions. Machine breakdowns consume resources: manpower, spare parts, and last production [1]. Preventive maintenance is of great importance in the continuation of the work of machines and prevent the occurrence of sudden stop. One of the most important questions we face is when do we do preventive maintenance work? The answer to this question requires using scientific methods in determining the optimum maintenance time [2].Therefore, many researchers addressed the concept of preventive maintenance using scientific methods: Bryan Doson (1994) proposed a style to define the schedule of preventive and engineering maintenance [3]. Dijkhuizen, Heijden (1999) favored optimizing the distribution of periods rather than improving preventive maintenance [4]. Chiang, Yang (2001) proposed to solve optimal maintenance management problems with the aim of obtaining the available quantities of the system by Markov method so that the expected long-term cost is reduced [5]. Moussawi (2002) introduced the method of using preventive maintenance programming using databases by determining the optimal time between preventive maintenance and the optimal operational life for preventive maintenance [6]. Celso, Cla´udio, Ma´rcio (2006) introduced a methodology that is based on the preventive maintenance policy evaluation based on the cost of reliability model [7]. Rommert Dekker (2012) introduced a reliability study based on optimization of maintenance scheduling of mechanical components, and has used an advanced simulation model to analyze reliability and an effective algorithm to calculate the probabilities of failure [8]. Jun-peng, Chuang-xin, Qing-hua WU, Lu-liang, Hong-jun (2014) conducted a study on embryonic maintenance scheduling based on multi-objective programming and analysis of their relationship [9]. Nima Mirabedini, Hossein (2014) a research was made for the preventive maintenance model, assuming the quality of the maintenance, either the repair or the change. The embryonic algorithm and the bird swarm algorithm were used and compared, where these algorithms gave similar results [10]. Al-Nuaimi (2015) submitted a study to compare the estimation methods of the Fuzzy reliability function [11]. Mohammadreza Shahriari Naghi shoja, Amir, Ebrahimi Mani Sharifi, Sasan, Barak (2016) presented a paper in the periodic preventive maintenance schedule using the regular bird swarm and algorithm the multipurpose bird squadron, where the results showed that the multipurpose bird squadron algorithm was superior to the other algorithm [12]. Al-Suhail (2017) also presented a study entitled estimation of the reliability of systems using the Bayes estimators of non-parameter and semi-parameter [13]. Abubaker Shagluf, Simon Parkinson, Andrew Peter Longstaff, Simon Fletcher (2018) presented research paper its purpose to produce a decision support aid for machine tool owners to utilise while deciding upon a maintenance strategy [14]. Simon Fletcher (2018) in their research paper tried to produce a decision support aid for machine tool owners to utilize while deciding upon a maintenance strategy [15].This paper adopted two methods to calculate this period. The first method was based on scheduling maintenance with certain conditions and choosing the optimal time period which corresponds to the lowest cost. The second method was based on the reliability function. It was found that the failure times were according to the Weibull distribution. The maximum likelihood method of estimation was used in estimating the parameters of the model. The Statgraph program was used in determining the type of distribution as well as in calculating distribution parameters.This paper followed the descriptive analytical method by studying the scientific references and conducting the statistical analyses to determine the optimum time for maintenance. The paper was conducted on the Department of Radiology at Muhyil General Hospital. Digital X-Ray was chosen for this study because it underwent the maximum number of failure compared to other devices during the period from 1/1/2015 to 31/12/2017.
2. Materials and Methods
2.1. Weibull Distribution
- The probabilistic Weibull model was first introduced by Waloddi Weibull to represent the distribution of the breaking strength of materials and later to describe the behavior of systems or events that have some degree of variability. It is a flexible distribution that can encompass characteristics of several other distributions. This property has given rise to widespread applications. Today, it is commonly used to assess product reliability, analyze life data and model failure times [16]. The Weibull distribution is one of the continuing probability distributions and one of the most widely used in failure models in the field of reliability studies for its ability to describe all phases of machine failure [17] and in the past 40 years, Weibull's distribution has been used in the field of reliability and life testing. It is also an important probability distribution in the theory of reliability because it has a great effect in producing accurate results when used and has important applications in the study of failure models. [18].The most popular distribution for failure data analysis is the Weibull distribution. The process of modeling failure data is commonly known as Weibull analysis, even when the underlying failure distribution is not Weibull. Other application areas include tensile characteristics of examination of tyre rubber repair ment [19], estimation of wind power potential [20], food products drying technology [21], model for growth/decline in product sales [22], intercurrence times of earthquakes [23].It is known that the Weibull distribution may contain one, two or three parameters. These parameters are Shape Parameter
 Scale Parameter
  and there may be a third parameter the Location parameter
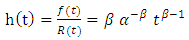
  [18].The Weibull probability density function is widely used to model failure phenomena and models an extensive number of situations by modifying the value of the shape parameter. Thus, the Weibull is the chosen density function for the solution to the problem of optimizing preventive maintenance schedules. The two-parameter Weibull probability density function is obtained by setting
  and is given by:
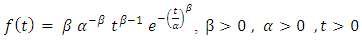 | (1) |
 is the scale parameter, also known as the Weibull slope, and has a positive value.•
  is the Shape parameter it determines the form of distribution and has a positive value•
  is location parameter
  The cumulative distribution function is written is in the formula:
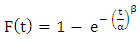 | (2) |
 | (3) |
 | (4) |
 The failure rate is increasing
 The failure rate is decreasing
 Fixed failure rateand that the arithmetic mean is given by the relationship
 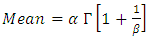 and variance
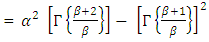
2.1.1. Using Reliability Function
- The algorithm used for this method is:1. Recording failure times2. Test the distribution of failure data, this method requires that the failure data be followed by a two-parameter Weibull distribution
 3. Estimation of Weibull distribution parameters by one of the following methods: maximum likelihood estimation, the least squares method, method of moments and Bayes.
2.1.2. Maximum Likelihood Estimation
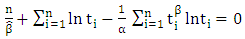
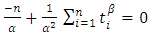
- This method is one of the most important methods of estimation. It aims to make the possible function at the end of the maximum, and defines the function of the maximum likelihood as a greatest possible result of the equation (1) by the following equation:
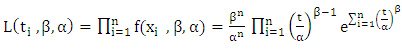 | (5) |
 | (6) |
 | (7) |
 | (8) |
 is the solution of
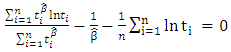 | (9) |
 | (10) |
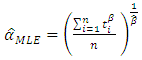
 then
then  which is often biased when sample sizes are small
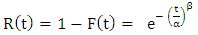
  in the case of large samples, the estimations are unbiased, which have the constancy Property. Since the MLE is characterized by the property of constancy, by using this property we get the maximum likelihood estimator of the reliability function of Weibull distribution with two parameters.
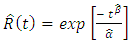 | (11) |
 and the cost of preventive maintenance
  5. Finding the quotient
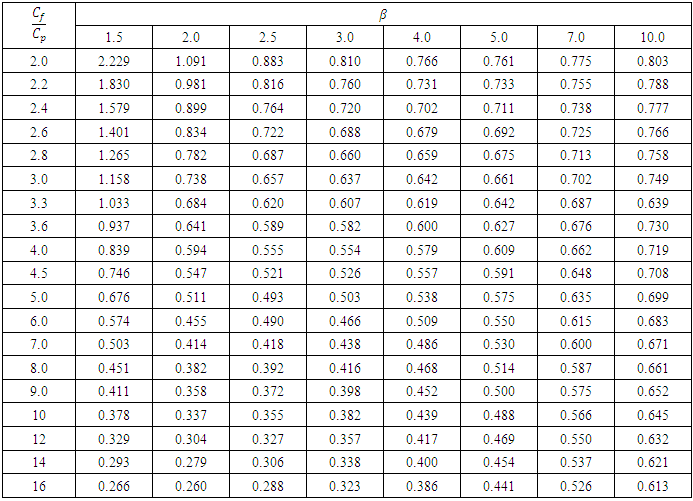
  6. Find the value of m by finding
  and specifying the location of this value through the table in appendix(1) prepared for this purpose, and depending on the shape parameter
  To distribute Weibull estimated by the maximum likelihood method using a program Statgraphics.7. Finding the optimal preventive maintenance time from the following equation:
 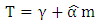 | (12) |
2.1.3. Using Scheduling Techniques [2]
- This is an important method in operations research in maintenance scheduling and optimal maintenance time, the algorithm used for this method consists of the following:1. Obtaining the total number of machines under study(N) from the Department of Radiology.2. Obtaining the cost of preventive maintenance
 from the Department of Radiology.3. Obtaining the cost of stoppage work for the purpose of preventive maintenance
  from the Department of Radiology.4. Calculating the mean duration of stops
  from the following equation:
 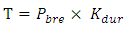 | (13) |
 = Probability of stopping
 = duration of preventive maintenance
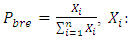 breakdown frequencyn: Number of downtime5. Calculating the total cost calculation is given by:
  | (14) |
 = Total cost, N=Number of machines
 = The cost of repairing the machine,T = mean duration of stops6. Calculating of stopping rate:
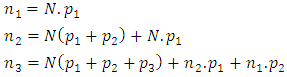 | (15) |
 Probability of stopping7. Calculating stopping cost
 8. Calculating the total cost
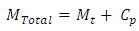 9. Finding the cost of monthly preventive maintenance
 10. Choose the optimal preventive maintenance time that meet the lowest possible cost.
3. Results and Discussion
- The paper adopted the descriptive analytical method by studying the scientific references and conducting the statistical analyses to determine the optimum time for maintenance using two different methods: 1) maintenance Scheduling with specific function and choosing the optimal time period with the minimum cost. 2) The reliability function.The study was conducted on the Department of Radiology at Muhyil General Hospital. Digital X-Ray was chosen for this study because it underwent the maximum number of failure compared to other devices during the period from 1/1/2015 to 31/12/2017, shown in Table (1).
|
3.1. Maintenance Scheduling Techniques
- Total number of devices (11) and the cost of preventive maintenance for each machine
 SR. and The cost of stopping work for preventive maintenance purposes
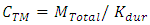
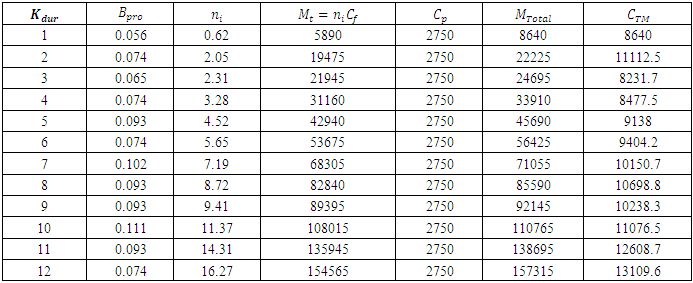
  This device recorded the biggest number of sudden failures during the period mentioned above.Calculating of the expected number of stops if regular maintenance is performed every month, every two months, every three months and up to 12 months using function (15).Table (2) shows that the cost of preventive maintenance, when implemented every three months, costs the hospital SR 8231.7, and then begins to increase to (13109.6) when implemented annually, i.e. every 12 months. Therefore, in light of these results, it is better to have a preventive maintenance time every three months because it meets the lowest cost i.e SR 7830, which helps to reduce the costs.
|
3.2. Reliability Function Techniques
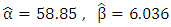
- Failure times were recorded for the machine under study, and then the failure times were analyzed using Statgraphics program. Then, Kolmogorov Smirnov test was used to determine the type of probability distribution, Since the smallest P-value=0.5575 amongst the tests performed is greater than or equal to 0.05, we can not reject the idea that the device failure times follows a Weibull distribution with 95% confidence interval, therefore, the value of the location parameter
 , and Figure (1), shows the distribution of failure data.
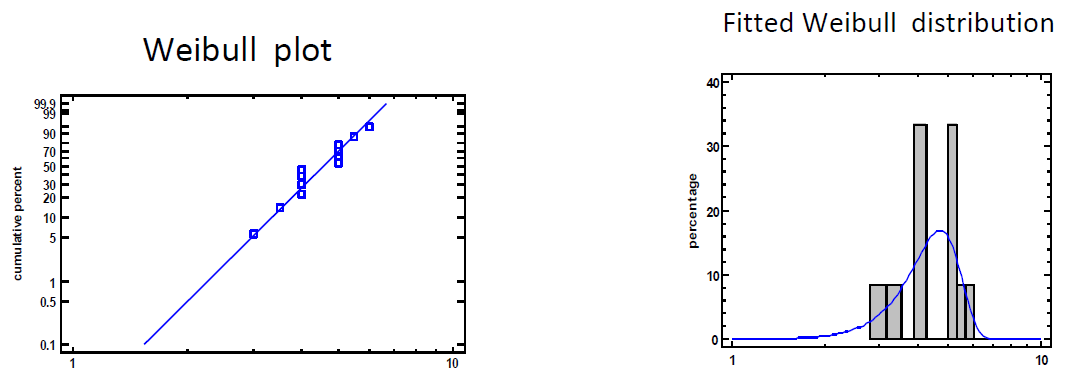 | Figure 1. Weibull plot and Fitted Weibull distribution |
 The cost of work stopping to do the preventive maintenance
  was divided by the cost of the preventive maintenance
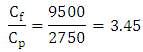 The value of " m " was found (table in appendix (1)), of m = 0.6557 and therefore the optimal duration of preventive maintenance was determined by equation (12)
 In other words, the optimum duration of preventive maintenance to be performed for the equipment (Digital X-RAY), is approximately 39 days according to the reliability function.
4. Conclusions
- The stoppages for the purpose of maintenance at unstudied time scientifically has negative effects such as high cost and service halt and hence the hospital will not be able to provide the needed services for patients at the right times.This paper tries to provide an easy way to determine the optimal time for preventive maintenance through using two different techniques (scheduling and reliability function) to determine the optimal time for preventive maintenance at the lowest possible cost based on data related to cost of maintenance and the work stoppage cost while doing maintenance.This paper was applied to digital x-ray devices at Muhyil General Hospital. The results revealed a decrease in the mean total cost of preventive maintenance specified in three months according to the scheduling method, and 39 days in according to the reliability function. Therefore, the reliability function is more efficient than the scheduling method in determining the optimal time for preventive maintenance in terms of the continuity of the devices in the service.The researcher recommends relying on the reliable function in estimating the optimal time for preventive maintenance, and implementing the specified time to ensure the continuation of operations efficiently and prevent the occurrence of sudden stops at the lowest possible cost.