International Journal of Statistics and Applications

p-ISSN: 2168-5193    e-ISSN: 2168-5215

2019;  9(1): 21-28

doi:10.5923/j.statistics.20190901.03


Wet Pavement Crash Analysis for Alabama Roadways

Mehrnaz Doustmohammadi1, Michael Anderson1, Sampson Gholston2

1Dpeartment of Civil and Environmental Engineering, University of Alabama in Huntsville, Huntsville, United States

2Dpeartment of Industrial and Systems Engineering and Engineering Management, University of Alabama in Huntsville, Huntsville, United States

Correspondence to: Mehrnaz Doustmohammadi, Dpeartment of Civil and Environmental Engineering, University of Alabama in Huntsville, Huntsville, United States.

Email:

Copyright © 2019 The Author(s). Published by Scientific & Academic Publishing.

This work is licensed under the Creative Commons Attribution International License (CC BY).
http://creativecommons.org/licenses/by/4.0/

Abstract

Wet pavement crashes tend to occur at a higher rate than crashes when the roadway surface is dry, when accounting for the number of hours of actual rainfall and amount of time the roadways would be wet. This study examines data from Alabama for non-intersection, or segment crashes, on the state system against a variety of potential variables hypothesized to contribute to wet pavement crashes. Models were developed relating the number of crashes (severe and non-severe) by pavement condition (wet pavement and dry pavement) at different traffic intensity levels (not congested, moderately congested and highly congested) to a collection of roadway, pavement and traffic variables. The results indicate that for severe crashes on congested roadways with dry pavement, the main variable that can be used to predict crashes is segment length, essentially an exposure variable, indicating that the pavement characteristics have no impact. In addition, the exposure variable is nearly one indicating that the length of the roadway has almost a direct relationship to crash number. However, for non-severe crashes in congested locations and all crashes in either moderate and no congestion there are a variety of factors that impact the number of crashes. The results show that there are certain roadway elements such as macrotexture, the level of friction between the roadway and the tires that allows for stopping, and International Roughness Index, a measure of the level of cracking in the pavement, which contribute to the number of crashes. These values are monitored by transportation agencies on a recurring interval and the impact of exceeding certain thresholds can be used to incorporate crash reductions into a safety maintenance strategy. Other variables that could not be improved through maintenance activities but have an influence on the number of crashes are presented.

Keywords: Wet pavement, Crashes, Statistical analysis, Roadway characteristics

Cite this paper: Mehrnaz Doustmohammadi, Michael Anderson, Sampson Gholston, Wet Pavement Crash Analysis for Alabama Roadways, International Journal of Statistics and Applications, Vol. 9 No. 1, 2019, pp. 21-28. doi: 10.5923/j.statistics.20190901.03.

1. Introduction

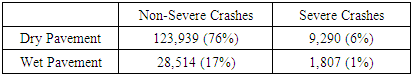
Roadway crashes are a significant problem that results in fatalities, injuries, property damage. Transportation engineers have worked diligently to decrease the likelihood of crashes by designing the safest possible roadways and performing maintenance to ensure that the roadway surfaces are at the best possible condition to minimize the likelihood of a crash. However, there are still a large number of crashes that occur every year. One contributing factor that can lead to a, has the potential to lead to conditions where the total number of crashes increases as well as the severity of the crash. There have been studies performed that examine the differences in the number of crashes and crash is the environment in which the driver operates the vehicle. The presence of rain, or simply driving on wet pavement severity of those crashes during rainfall and non-rainfall conditions [1, 2]. However, no study known has divided the crashes based on the operating condition of the roadway.
In Alabama, a review of the crash data show that the majority of crashes (81.5%) occurred during a dry pavement conditions while (18.5%) of crashes occurred when the pavement was wet. Although there are more crashes numerically during dry pavement conditions, on average the state of Alabama experiences rainfall only 5% of the total hours in a standard year [3]. Therefore, almost 1/5th of the crashes that occur in the state are happening during the 1/20th of the time when environmentally it is raining and when the pavement is wet.
The purpose of this study is to further examine the impact of rainfall and wet pavement on crash frequency and crash severity using a collection of roadway, pavement and traffic variables. The primary question being addressed asks “are there roadway, pavement and traffic conditions that generally lead to crashes during wet pavement conditions and are there engineering solutions to decrease the severity and number of crashes that occur during wet pavement conditions?”
This study includes a collection of roadway, pavement and traffic variables, some unique to this study, to analyze the relationship between these variables and crashes to determine if there is a common theme that can be addressed to assist engineers in determining the impact of these variables on the number of crashes. Unique to this study, a large population of crashes is used in an attempt to develop a series of statewide crash prediction equations that can be applied based on the operation characteristics of the roadway. This differentiates this study from prior efforts that used limited data sets, minimal variables and doesn’t account for different driving environments with respect to congestion and ability to freely operate a vehicle. The study concluded that there are several roadway factors that lead to crashes, but they were not necessarily the ones that were originally assumed to be most important when considering wet pavement driving conditions, and in certain driving environments simply being on the roadway is the best predictor of a crash.

2. Literature Review

Due to the high number of crashes occurring during wet pavement conditions, several studies have been performed in order to determine factors that affect the frequency and injury severity of these crashes or how wet pavement and rain influence crash frequency in crashes in general. One study assessed hydroplaning risk and skid resistance on wet pavement [4]. Some related studies focused on factors influencing injury severity of crashes, considering wet pavement or rain as a factor [5-11]. Effects of the wet pavement found through these studies vary. Duncan et al. found that wet roads on grades increase injury severity [7]. In 2011, Morgan and Mannering also found that females and older males experience an increase in crash severity when roads are wet or have snow/ice [9]. A 2008 study regarding crash patterns found that spatial patterns of weather-related crashes form clusters depending upon the weather conditions [12].
Aside from these studies, there have been various studies relating crash frequency to wet pavement or rain [13-19]. Several studies performed found that amount and intensity of rainfall were significant factors influencing crash frequency [11, 20-27]. On the contrary, Liu and Sharma found that rainfall showed no significant effects to crash frequency [28]. Eisenberg went into more detail in a 2004 study, determining that there is a negative relationship between monthly rainfall and fatal crashes, but a positive relationship between daily rainfall and fatal crashes [29]. A number of other studies regarding the effects of rainfall on crash risk had results ranging from 2.27% to 77% increases in crashes during rainfall events [9, 30-34]. Multiple studies have found that wet pavement significantly increases crash risk [35-37]. Another study seeking to identify significant factors in wet pavement crashes found that downgrade segment length, radius of curvature, longitudinal grade, and speed consistency were all significant factors [38]. A similar study found that more average daily rainfall and a wider left shoulder resulted in fewer crashes [39]. A 2003 study by Golob and Regan had interesting results, finding that truck-involved crash actually had a lower frequency on wet roads [40]. A particular factor that was of interest in various studies is skid number. Results of studies examining the effects of skid numbers on crash frequency found that the number of wet pavement crashes increases as skid number decreases [41, 42]. Another interesting result in the literature regarding the pavement was that the use of open-graded asphalt concrete resulted in a reduction of wet collisions, as well [43].

3. Study Data

The study data were collected from a variety of sources maintained by the Alabama Department of Transportation and University of Alabama. All data were brought into a geographic information system environment and spatial joins and summations were performed on the data to develop databases that contained the number of crashes and relevant variables to be used in the analysis.
The roadway data was collected from the Alabama Department of Transportation. The database spatial geography was divided into segments ranging from 0.001 miles to 10.489 miles. There were a total of 9,534 segments in the state roadway system. These segments were the basis of the analysis and all crashes, by type, were aggregated to the segments to produce a number of crashes per segment value that was used as the dependent variable in the study. Figure 1 shows the roadway system used for the analysis.
Figure 1. Roadway system in Alabama
As driver operating characteristics with respect to the level of congestion was considered a key element in this study, a database was obtained from the Alabama Department of Transportation. The independent variables from the traffic database included Average Daily Traffic (ADT), number of lanes, and percent trucks. For the analysis, the ADT and number of lanes were combined into a traffic intensity factor [Traffic Intensity = ADT / Number of Lanes] [44]. This measure was to indicate the level of congestion on the roadway segments and to allow for differentiation between segments that had 12,000 vehicles per day with one lane in each direction from a segment with 12,000 vehicles per day with two lanes in each direction. Obviously, the two lane roadway segments would have far different spacing between vehicles than the one lane roadway segments which would greatly impact the likelihood of crashing with another vehicle. The traffic intensity factor was further segmented to account for level of service associated with the driving task by dividing by a standard capacity per lanes using the state of Alabama’s travel modeling program. The traffic intensity factors for the roadways were divided into three categories, as shown in Table 1. The authors justification for the use of different levels of service (LOS) for the analysis is based on the notion that for LOS F, the highest traffic intensity will result in congested roadway operating lower speeds, thus the expectation is that the number of crashes will increase due to the number of potential vehicles which to have a crash, but the severity of the crashes will decrease due to the lower speed. Whereas LOS A-C, the lowest traffic intensity will result in non-congested high speed operation, thus the expectation is that the number of crashes will be less but the number of severe crashes will be greater. For LOS D-E, the medium traffic intensity will result in a mid-level number of crashes and number of severe crashes. Figure 2 shows the location for the roadway segments that were calculated for each roadway LOS.
Table 1. Categories for Traffic Analysis
     
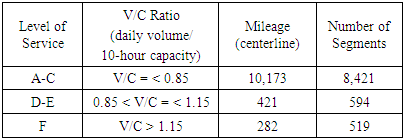
Figure 2. Locations of Roadways by LOS (LOS A-C, LOS D-E, LOS F)
The crash database used in this study is from Critical Analysis Reporting Environment (CARE) maintained at the University of Alabama. The CARE dataset contains all crashes between 2010 and 2014 with a considerable number of attributes for each crash, including the pavement condition and crash severity. For the analysis, only segment related crashes on the state roadway system were considered for inclusion. There were a total of 163,550 segment crashes on the state system considered in this study. The removal of intersection crashes was performed because driving characteristics at intersections are quite different from segment driving characteristics, with respect to driving speed, vehicle maneuver, and type and manner of crash. Using only the segment crashes allowed for consistency between crashes (mainly rear end and run off the road crashes) that would lend themselves to a greater prevalence of the impact of rain and wet pavement. Additionally, the speed limits are closer to the expected driving speed of the vehicles and therefore more reliable because vehicles are not slowing to a stop or accelerating from a stop, skewing the data.
The crash data were grouped into four categories using a 2 by 2 analysis, severe and non-severe by wet pavement and dry pavement. For the basis of severe and non-severe, the severe crashes resulted in a fatality or incapacitating injury, all others were classified as non-severe. The condition of the pavement, wet or dry, was collected by the officer who completed the crash survey. Table 2 shows the number of crashes in each category and the spatial distribution of the crashes for each type of crash are shown in Figure 3.
Table 2. Number of Crashes
     
Figure 3. Spatial Distributions of Crashes by Type
The categories for level of service increased the number of models in the analysis from 4 to 12. Essentially, each condition (wet vs. dry) and (severe vs. non-severe) was separated into three additional categories to account for the level of service and driver experience while on the roadway.
The percent trucks from the traffic database were considered as a potentially important variable, due to the difference in size and operation conditions associated with these vehicles [45]. The presence of large trucks on the roadway tends to reduce roadway capacity and have different stopping distance that can be impacted by the presence of wet pavement [46]. The pavement data was collected from the Alabama Department of Transportation. The database is based on point locations of pavement attributes collected on a 1/100th of a mile distance. The data collected and used in this study include the cross-slope (slope between the centerline of the roadway and edge of pavement), grade, International Roughness Index (level of cracking on the roadway), rutting depth (depth of the pavement in the driving lanes that would allow water to pool), and marcotexture level (friction or stopping capability of the roadway). These data elements were expected to contribute to the likelihood of crashing on a wet pavement surface based on the geometric condition of the pavement, quality of the pavement, amount of water that might pool in the wheel paths and the ability to stop a vehicle during wet pavement conditions. The data were joined to the segment using the average value for the variable as it appears on the segment.
As mentioned, there were a total of twelve datasets developed for statistical analysis. This essentially represented a 2 by 2 by 3 matrix with the variables being wet vs. dry, severe vs. non-severe, and LOS A-C vs. LOS D-E vs. LOS F.

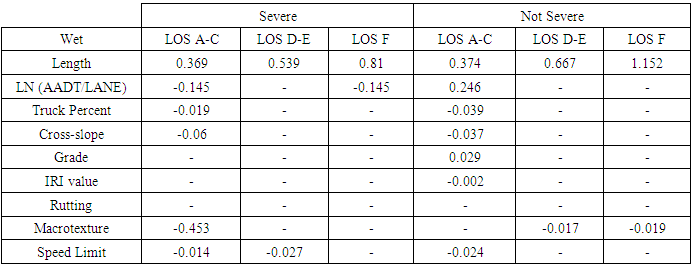
4. Statistical Analysis

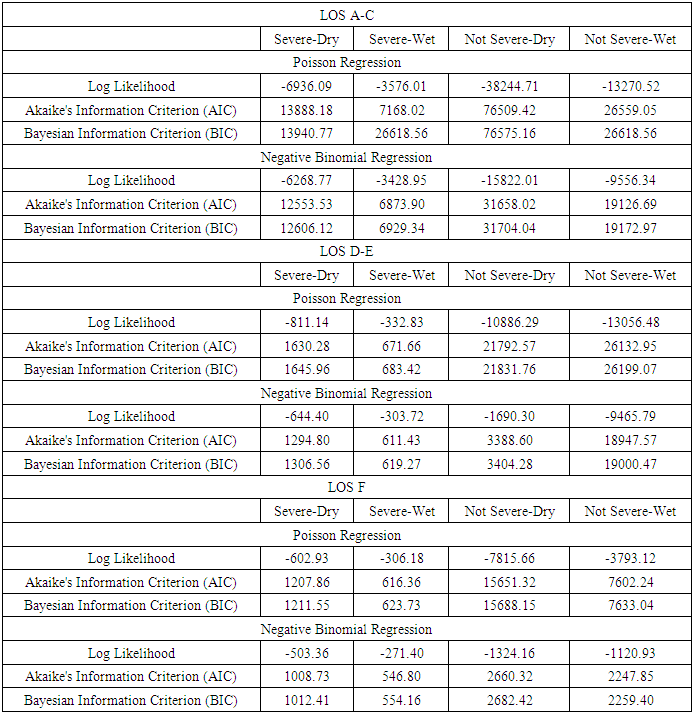
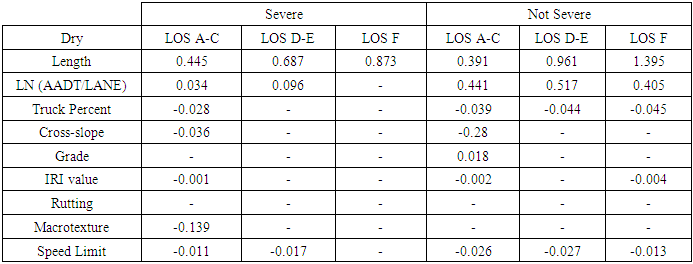
The data that were collected were analyzed using the IBM Statistical Package for the Social Sciences (SPSS). As mentioned, there were 12 scenarios developed based on a matrix of wet/dry pavement, severe/non-severe and three traffic intensity levels. Using SPSS, two regression models were selected to be used to model the number of crashes on the roadway segments using the variables identified previously. The regression models were Poisson [47] and Negative Binomial [48]. The models were run for all 12 scenarios from the matrix. The type of regression model and goodness of fit value are shown in Table 3. From Table 3, it can be seen that the Negative Binomial models were superior in all 12 scenarios.
Table 3. Model Types and Quality
     
The dependent variable used in all four models was the number of crashes per segment. Independent variables that were selected to be included in the final models were ADT/Lane, Length of Segment, Percent Trucks, Cross-Slope, Grade, IRI Value, Rutting, Macrotexture and Speed Limit. These variables were selected based on the literature review that indicated these are relevant variables for the analysis and are currently available for all roadway segments. The coefficients for the models using only the negative binomial regression option are shown in Table 4 and Table 5. The values in the table indicate the best models based on the goodness of fit statistic. The dashed lines indicate that the identified variable did not show a significant relationship with the specific prediction model.
Table 4. Coefficients for Models in Dry Pavement Condition
     
Table 5. Coefficients for Models in Wet Pavement Condition
     
When reviewing the coefficients and variables for the different models, some observations can be made. Rutting depth, which was considered to be the most important variable entering the study, was not found to be significant in any of the models. The result was extremely surprising as the ability of water to pool on the roadway surface, leading to potential hydroplaning of vehicles, was considered essential and a variable that could be accounted for through engineering/maintenance.
Macrotexture appeared in non-severe wet models and low volume severe models. The variable parameter was negative as an increase in macrotexture implied a reduction in friction. Similarly speed limit was also negative, as an increase in travel speed lead to a decrease in crashes for the segments.
For the high traffic intense roadways segments, the main variable was segment length (the only variable for the severe dry pavement crashes), which indicates that when traffic is densely packed the roadway variables are less important and the sheer number of vehicles and exposure to those vehicles while traveling on the segment are the key values that tend to predict crashes. The value represents an exposure variable and the longer a driver travels on the segment, the increased likelihood of having a crash. Essentially, the act of driving tends to lead to crashes – longer you drive the more likely you are to crash.
The other variables that appear in the models tend to follow the trend that more extreme conditions lead to a greater number of crashes. For example, the greater the number of vehicles per lane, the higher the likelihood to crash because there are more other vehicles for which to have a crash. Similarly, the greater the percent of large vehicles, grade, cross-slope and cracking tend to increase the likelihood of having a crash.

5. Conclusions

The impact of rain, and wet pavement, on accidents is significant. The weather data show that we have many more crashes during the few hours of rain every year than during the majority of time when it is not raining. The influence of very high traffic intensity on crashes, wet or dry, severe or non-severe, was a function mainly of the length of the roadway individuals had to drive along the segment, and tended not to vary with respect to the pavement condition. On lower traffic congested roadways, other design factors that can be evaluated were shown to contribute to the number of crashes, both for wet and dry pavement conditions. This indicates an important element of this study as these values can be monitored, tested and improved through regular maintenance and resurfacing programs to potentially reduce the number of crashes and the number of severe crashes. While rutting depth was not significant in any of the models developed; macrotexture was a significant variable and transportation agencies can work to develop a maintenance strategy to keep the level of friction for roadways as great as possible to prevent crashes during wet pavement conditions. Overall, this study represents another step in the process of better understanding those variables that contribute to wet pavement crashes. As shown in the data, rainy conditions and wet pavement driving tends to lead to more crashes than should be expected based on time the roadways are wet and the efforts to reduce the number of these crashes and the severity of these crashes are important to reducing crashes on our roadways and increasing safety.

References

[1]  Jung, Soyoung, Xiao Qin, and David A. Noyce. "Rainfall effect on single-vehicle crash severities using polychotomous response models." Accident Analysis & Prevention 42, no. 1 (2010): 213-224.
[2]  Abdel-Aty, Mohamed A., and Rajashekar Pemmanaboina. "Calibrating a real-time traffic crash-prediction model using archived weather and ITS traffic data." IEEE Transactions on Intelligent Transportation Systems 7, no. 2 (2006): 167-174.
[3]  Southeast Regional Climate Center. “Number of days with precipitation equal to or above 0.01 inches for selected cities in the southeast.” 2007.
[4]  Fwa, T. F., and G. P. Ong. "Wet-pavement hydroplaning risk and skid resistance: Analysis." Journal of Transportation Engineering 134, no. 5 (2008): 182-90. doi:10.1061/(asce)0733-947x(2008)134:5(182).
[5]  Christoforou, Zoi, Simon Cohen, and Matthew G. Karlaftis. "Integrating real-time traffic data in road safety analysis." Procedia - Social and Behavioral Sciences 48 (2012): 2454-463. doi:10.1016/j.sbspro.2012.06.1216.
[6]  Jung, Soyoung, Xiao Qin, and David A. Noyce. "Rainfall effect on single-vehicle crash severities using polychotomous response models." Accident Analysis & Prevention 42, no. 1 (2010): 213-24. doi:10.1016/j.aap.2009.07.020.
[7]  Duncan, Chandler, Asad Khattak, and Forrest Council. "Applying the ordered probit model to injury severity in truck-passenger car rear-end collisions." Transportation Research Record: Journal of the Transportation Research Board 1635 (1998): 63-71. doi:10.3141/1635-09.
[8]  Wang, Ling, Mohamed Abdel-Aty, Qi Shi, and Juneyoung Park. “Real-time crash prediction for expressway weaving segments." Transportation Research Part C: Emerging Technologies 61 (2015): 1-10. doi.org/10.1016/j.trc.2015.10.008.
[9]  Morgan, Abigail, and Fred L. Mannering. "The effects of road-surface conditions, age, and gender on driver-injury severities." Accident Analysis & Prevention 43, no. 5 (2011): 1852-863. doi:10.1016/j.aap.2011.04.024.
[10]  Li, Yingfeng, Chunxiao Liu, and Liang Ding. “Impact of pavement conditions on crash severity.” Accident Analysis & Prevention 59 (2013): 399-406. doi.org/10.1016/j.aap.2013.06.028.
[11]  Pei, Xin, N.n. Sze, S.c. Wong, and Danya Yao. "Bootstrap resampling approach to disaggregate analysis of road crashes in Hong Kong." Accident Analysis & Prevention 95 (2016): 512-20. doi:10.1016/j.aap.2015.06.007.
[12]  Khan, Ghazan, Xiao Qin, and David A. Noyce. "Spatial analysis of weather crash patterns." Journal of Transportation Engineering 134, no. 5 (2008): 191-202. doi:10.1061/(asce)0733-947x(2008)134:5(191).
[13]  Mayora, José M. Pardillo, and Rafael Jurado Piña. "An assessment of the skid resistance effect on traffic safety under wet-pavement conditions." Accident Analysis & Prevention 41, no. 4 (2009): 881-86. doi:10.1016/j.aap.2009.05.004.
[14]  Retting, Richard A., Helen B. Weinstein, and Mark G. Solomon. "Analysis of motor-vehicle crashes at stop signs in four U.S. cities." Journal of Safety Research 34, no. 5 (2003): 485-89. doi:10.1016/j.jsr.2003.05.001.
[15]  De Luca, Mario, Raffaele Mauro, Renato Lamberti, and Gianluca Dell’Acqua. "Road safety management using Bayesian and cluster analysis." Procedia - Social and Behavioral Sciences 54 (2012): 1260-269. doi:10.1016/j.sbspro.2012.09.840.
[16]  Kou, Kuang-Yang. "The modeling of wet-pavement related crashes by using fuzzy logic." 2005 IEEE International Conference on Systems, Man and Cybernetics. doi:10.1109/icsmc.2005.1571405.
[17]  Xiao, Jie, Bohdan Kulakowski, and Moustafa Ei-Gindy. "Prediction of risk of wet-pavement accidents: Fuzzy logic model." Transportation Research Record: Journal of the Transportation Research Board 1717 (2000): 28-36. doi:10.3141/1717-05.
[18]  Kulakowski, B. T., C. E. Antle, D. J. Jacobs, C. Lin, J. M. Mason, J. C. Wambold. “Development of a wet pavement index to assess the risk of skidding accidents.” Proceedings, Second International Symposium on Road Surface Characteristics, Berlin, Germany (June 1992).
[19]  Buddhavarapu, Prasad, Andre F. Smit, and Jorge A. Prozzi. "A fully Bayesian before–after analysis of permeable friction course (PFC) pavement wet weather safety." Accident Analysis & Prevention 80 (2015): 89-96. doi:10.1016/j.aap.2015.04.003.
[20]  Najafi, Shahriar, Gerardo W. Flintsch, and Seyedmeysam Khaleghian. "Fuzzy logic inference-based pavement friction management and real-time slippery warning systems: A proof of concept study." Accident Analysis & Prevention 90 (2016): 41-49. doi:10.1016/j.aap.2016.02.007.
[21]  Dell’Acqua, Gianluca, Mario De Luca, Raffaele Mauro, and Francesca Russo. "Freeway crashes in wet weather: The comparative influence of porous and conventional asphalt surfacing." Procedia - Social and Behavioral Sciences 54 (2012): 618-27. doi:10.1016/j.sbspro.2012.09.779.
[22]  Brijs, Tom, Dimitris Karlis, and Geert Wets. "Studying the effect of weather conditions on daily crash counts using a discrete time-series model." Accident Analysis & Prevention 40, no. 3 (2008): 1180-190. doi:10.1016/j.aap.2008.01.001.
[23]  Yaacob, Wan Fairos Wan, Mohamad Alias Lazim, and Yap Bee Wah. "Evaluating spatial and temporal effects of accidents likelihood using random effects panel count model." 2010 International Conference on Science and Social Research (CSSR 2010), 2010. doi:10.1109/cssr.2010.5773927.
[24]  Aguero-Valverde, Jonathan, and Paul P. Jovanis. "Spatial analysis of fatal and injury crashes in Pennsylvania." Accident Analysis & Prevention 38, no. 3 (2006): 618-25. doi:10.1016/j.aap.2005.12.006.
[25]  Eustace, Deogratias, Aline Aylo, and Worku Y. Mergia. "Crash frequency analysis of left-side merging and diverging areas on urban freeway segments – A case study of I-75 through downtown Dayton, Ohio." Transportation Research Part C: Emerging Technologies 50 (2015): 78-85. doi:10.1016/j.trc.2014.07.007.
[26]  Rusli, Rusdi, Md. Mazharul Haque, Amir Pooyan Afghari, and Mark King. "Applying a random parameters negative binomial Lindley model to examine multi-vehicle crashes along rural mountainous highways in Malaysia." Accident Analysis & Prevention 119 (2018): 80-90. doi:10.1016/j.aap.2018.07.006.
[27]  Zhang, Jiangman, Xiaohong Chen, and Yingfei Tu. "Environmental and traffic effects on incident frequency occurred on urban expressways." Procedia - Social and Behavioral Sciences 96 (2013): 1366-377. doi:10.1016/j.sbspro.2013.08.155.
[28]  Liu, Chenhui, and Anuj Sharma. "Using the multivariate spatio-temporal Bayesian model to analyze traffic crashes by severity." Analytic Methods in Accident Research 17 (2018): 14-31. doi:10.1016/j.amar.2018.02.001.
[29]  Eisenberg, Daniel. "The mixed effects of precipitation on traffic crashes." Accident Analysis & Prevention 36, no. 4 (2004): 637-47. doi:10.1016/s0001-4575(03)00085-x.
[30]  Chakrabarty, Neelima, and Kamini Gupta. "Analysis of driver behaviour and crash characteristics during adverse weather conditions." Procedia - Social and Behavioral Sciences 104 (2013): 1048-057. doi:10.1016/j.sbspro.2013.11.200.
[31]  Omranian, Ehsan, Hatim Sharif, Samer Dessouky, and Jose Weissmann. "Exploring rainfall impacts on the crash risk on Texas roadways: A crash-based matched-pairs analysis approach." Accident Analysis & Prevention 117 (2018): 10-20. doi:10.1016/j.aap.2018.03.030.
[32]  Andrey, Jean, and Sam Yagar. "A temporal analysis of rain-related crash risk." Accident Analysis & Prevention 25, no. 4 (1993): 465-72. doi:10.1016/0001-4575(93)90076-9.
[33]  Black, Alan W., Gabriele Villarini, and Thomas L. Mote. "Effects of rainfall on vehicle crashes in six U.S. states." Weather, Climate, and Society 9, no. 1 (2017): 53-70. doi:10.1175/wcas-d-16-0035.1.
[34]  Jaroszweski, David, and Tom Mcnamara. "The influence of rainfall on road accidents in urban areas: A weather radar approach." Travel Behaviour and Society 1, no. 1 (2014): 15-21. doi:10.1016/j.tbs.2013.10.005.
[35]  Caliendo, Ciro, Maurizio Guida, and Alessandra Parisi. "A crash-prediction model for multilane roads." Accident Analysis & Prevention 39, no. 4 (2007): 657-70. doi:10.1016/j.aap.2006.10.012.
[36]  Wang, Ling, Qi Shi, and Mohamed Abdel-Aty. "Predicting crashes on expressway ramps with real-time traffic and weather data." Transportation Research Record: Journal of the Transportation Research Board 2514, no. 1 (2015): 32-38. doi:10.3141/2514-04.
[37]  Chen, Feng, Xiaoxiang Ma, Suren Chen, and Lin Yang. "Crash frequency analysis using hurdle models with random effects considering short-term panel data." International Journal of Environmental Research and Public Health 13, no. 11 (2016): 1043. doi:10.3390/ijerph13111043.
[38]  Montella, Alfonso, and Lella Liana Imbriani. "Safety performance functions incorporating design consistency variables." Accident Analysis & Prevention 74 (2015): 133-44. doi:10.1016/j.aap.2014.10.019.
[39]  Jung, Soyoung, Kitae Jang, Yoonjin Yoon, and Sanghyeok Kang. "Contributing factors to vehicle to vehicle crash frequency and severity under rainfall." Journal of Safety Research 50 (2014): 1-10. doi:10.1016/j.jsr.2014.01.001.
[40]  Golob, Thomas, and Regan, Amelia. “Truck-involved crashes and traffic levels on urban freeways.” IDEAS Working Paper Series from RePEc (n.d.). http://search.proquest.com/docview/1698154601/.
[41]  Musey, K., and S. Park. "Pavement skid number and horizontal curve safety." Procedia Engineering 145 (2016): 828-35. doi:10.1016/j.proeng.2016.04.108.
[42]  Kuttesch, Jeffrey S. “Quantifying the relationship between skid resistance and wet weather accidents for Virginia data.” Master’s Thesis, Virginia Polytechnic Institute and State University, 2004, http://hdl.handle.net/10919/35551.
[43]  Chan, Ching-Yao, Eui-Jae Jin, Soon Mi Oh, and David R. Ragland. “A methodology of quantifying precipitation exposure for wet-weather collisions and evaluating effectiveness of open-grade asphalt concrete as a countermeasure.” IDEAS Working Paper Series from RePEc (n.d.). http://search.proquest.com/docview/1698173749/.
[44]  Fridstrøm, Lasse, Jan Ifver, Siv Ingebrigtsen, Risto Kulmala, and Lars Krogsgård Thomsen. "Measuring the contribution of randomness, exposure, weather, and daylight to the variation in road accident counts." Accident Analysis & Prevention 27, no. 1 (1995): 1-20.
[45]  Khorashadi, A., Niemeier, D., Shankar, V., & Mannering, F. (2005). Differences in rural and urban driver-injury severities in accidents involving large-trucks: an exploratory analysis. Accident Analysis & Prevention, 37(5), 910-921.
[46]  "Highway capacity manual." Washington, DC (2000).
[47]  Hadi, Mohammed A., Jacob Aruldhas, Lee-Fang Chow, and Joseph A. Wattleworth. "Estimating safety effects of cross-section design for various highway types using negative binomial regression." Transportation Research Record 1500 (1995): 169.
[48]  Young, Kristie, Michael Regan, and M. Hammer. "Driver distraction: A review of the literature." Distracted driving (2007): 379-405.