-
Paper Information
- Next Paper
- Paper Submission
-
Journal Information
- About This Journal
- Editorial Board
- Current Issue
- Archive
- Author Guidelines
- Contact Us
International Journal of Statistics and Applications
p-ISSN: 2168-5193 e-ISSN: 2168-5215
2018; 8(6): 309-315
doi:10.5923/j.statistics.20180806.04

Alternative Measures of Standard Deviation Coefficient of Variation and Standard Error
 Abstract
 Reference
 Full-Text PDF
 Full-text HTML
Md. Siraj-Ud-Doulah
Department of Statistics, Begum Rokeya University, Rangpur, Bangladesh
Correspondence to: Md. Siraj-Ud-Doulah, Department of Statistics, Begum Rokeya University, Rangpur, Bangladesh.
| Email: |  |
Copyright © 2018 The Author(s). Published by Scientific & Academic Publishing.
This work is licensed under the Creative Commons Attribution International License (CC BY).
http://creativecommons.org/licenses/by/4.0/

The Paper examines the performances of some popular and frequently used measures of dispersion such as standard deviation, coefficient of variation and standard error and survey that they may not perform as good as anticipating in the presence of non-normality or outliers. The usefulness of the proposed measures is scrutinized with the frequently used measures of dispersion by bootstrap and jackknife computer based techniques as well as Monte Carlo simulation approach. In this paper, I propose new alternative measures of dispersion, namely DM-standard deviation, coefficient of deviation and DM-standard error. These measures should be fairly robust. The results demonstrate that DM-standard deviation, coefficient of deviation and DM-standard error outperforms than the standard deviation, coefficient of variation and standard error in a broad range of frequently occurring situations.
Keywords: Bootstrap, Coefficient of Variation, Coefficient of Deviation, DM-standard Deviation, DM-standard Error, Jackknife, Monte Carlo Simulation
Cite this paper: Md. Siraj-Ud-Doulah, Alternative Measures of Standard Deviation Coefficient of Variation and Standard Error, International Journal of Statistics and Applications, Vol. 8 No. 6, 2018, pp. 309-315. doi: 10.5923/j.statistics.20180806.04.
Article Outline
1. Introduction
- Various statistical methods, when we are interested in describing the entire distribution of some observations and characteristics of individuals, there are two measures: central tendency and dispersion. Former measures locate the center of a distribution but they do not reveal how the observations are spread out on each side of a center. On the other hand, the latter measures are numbers that attempt to answer questions like: how do the observations spread out around the typical value? Both are used to describe the distribution of observations or characteristics of the individual under study for any accurate descriptive summary of the data. But there is evidence that the existing measures of dispersion may perform poorly in the presence of non-normality or when outliers arise in data. There are frequently used different measures of dispersion. The theoretical and practical application of these measures have been documented in several books [1-3, 5, 7, 8, 10-15, 18, 20, 21, 23, 24] and journal articles. Yet, most researchers continue to search and develop advance measures of dispersion for making correct inferences. I briefly review some of the more fundamental problems with conventional measures. Range depends solely on the highest and lowest values, it would be misleading if any of the two extreme values has very high or low magnitude. Quantile deviation (QD) is a better measure than range, but both fail to provide measurement of scatter of the observations, relative to the typical value. In addition, it does not enter into any of the higher mathematical relationships that are basic to inferential statistics. Mean deviation (MD) is highly sensitive to unusual observations in a series. The most popular and frequently used scale measure is standard deviation (SD), but it is very much sensitive to outlying observations. Therefore, I propose an alternative measure of scale is DM-standard deviation ( ) namely, which I discuss in section 2. But when the means of data sets vary considerably, we do not get an accurate picture of the relative variability in two sets just by comparing the SD. In that situation, we use another measures of dispersion tends to the overcome this difficulty. The coefficient of range is rarely used on a measure of dispersion because of its inherent difficulties in interpretation. Coefficient of QD fails to identify discrepancy of the observations. Coefficient of MD is sensitive to outliers. The most popular and commonly used measure is coefficient of variation (CV), which based on mean and standard deviation (SD), so, it’s sensitive to contamination of data. Consequently, I develop a sound measure of CV is coefficient of deviation (CD) explicitly, which discuss in section 2. The concept of standard error (SE) is the one and only best understood with reference to a sampling distribution. Since, SE is calculated by sample variance, which is however known to be extremely sensitive to outliers. Hence, to overcome the sensitivity, I propose a new measure of SE is DM-standard error ( ) namely, which I discuss in section 2. The performance comparisons of classical popular and frequently used measures as well as my newly proposed measures are discussed by utilizing real life data sets in section 3. Bootstrap and jackknife properties of classical and proposed estimators are illustrated in section 4 and 5 respectively. The performances of the classical and proposed estimators are investigated in section 6 through a Monte Carlo simulation studies in section 4.
2. Propose SDDM, CD & SEDM Estimators
- The sample average and sample standard deviation are the classical estimators of the location and scale parameter of a statistical distribution. They are however unreliable in presence of outliers. For that reason, I propose sound measure of scale, so that it can give right outcome any typical data situation. I now define some well-known and simple robust estimator of location. The most popular robust estimator of location is decile mean (DM). A survey on DM is given by [19]. Here, I formulate DM as-
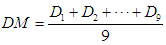 Where
Where  are 9 deciles from grouped or ungrouped data.Now I define an alternative scale estimator is
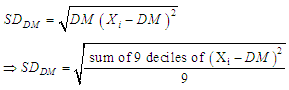 Next, I define a coefficient of deviation (CD) is computed as a ratio of
  of the distribution to the DM of the same distribution.Symbolically,
  The CD is usually expressed in percentage, in which case
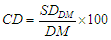 And then I define, the term, ‘standard error’ applies to DM, denoted by
  , is computed as
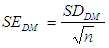
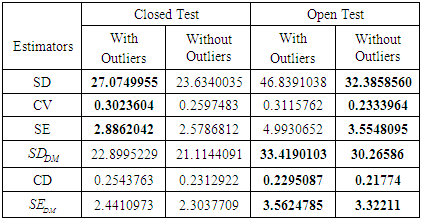
3. Real Data Example
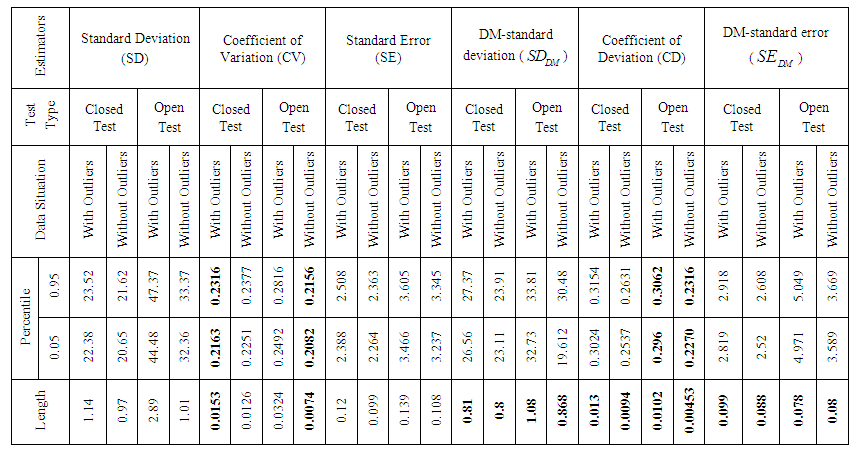
- The score data has taken from Mardia, Kent and Bibby (1979), which contains 88 students’ examination marks, each gave five tests in two different categories: one is closed book examination, which included the subjects, in mechanics and vectors and another is open book examination, which included the subjects, in algebra, analysis and statistics. Now I find out which type of examination is sound for students. At first, I check the outliers independently for closed and open book tests by the robust Med-MAD method [4, 22], it detects 4 outliers (case 1, 81, 85 and 87) for closed book test as well as 5 outliers (case 1, 2, 3, 87 and 88) for open book test. Actual data set and deleting these outliers I revisit the data set which result has shown below-
|
4. Bootstrap
- The bootstrap is a recently developed technique for making certain kinds of statistical inferences. It is only recently developed because it requires modern computer power to simplify the often intricate calculations of traditional statistical theory [6]. Here, I consider a real data set for getting the right finding that is the score test data set has taken from [16]. This data set contains 88 observations of student’s test. Now, I perform a bootstrap study in order to evaluate the performance of the classical measures that are standard deviation (SD), coefficient of variation (CV), standard error (SE) and our newly proposed estimators of dispersion that is DM-standard deviation (), coefficient of deviation (CD), DM-standard error (). I investigate the standard error, bias and percentile length of those six estimators of dispersion when the data set holds outlying observations or free from outlying observations. I utilize those formulae for getting output of the bootstrap program, for some convenient value of 10,000 replications. The results of bootstrap are shown in Table 2 and Table 3.
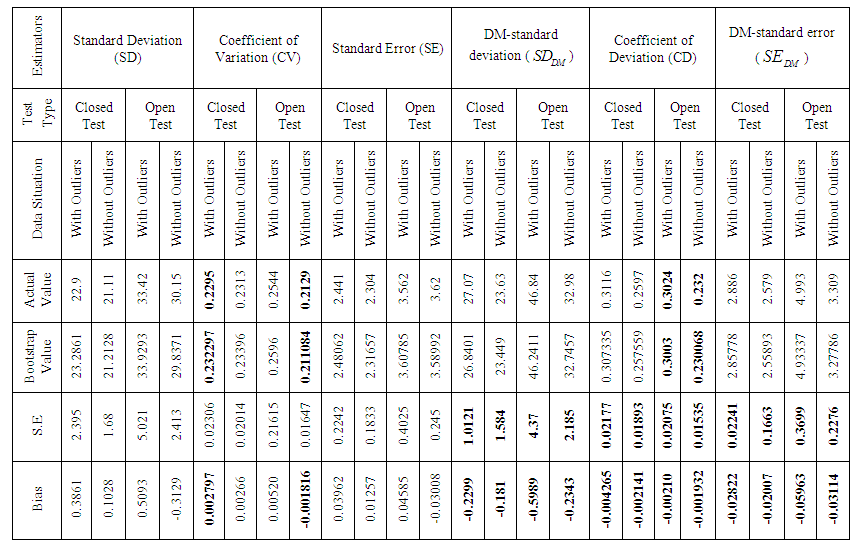 | Table 2. Bootstrap Results Comparison of Six Different Measures of Dispersion for Score Data set With Outliers and Without Outliers |
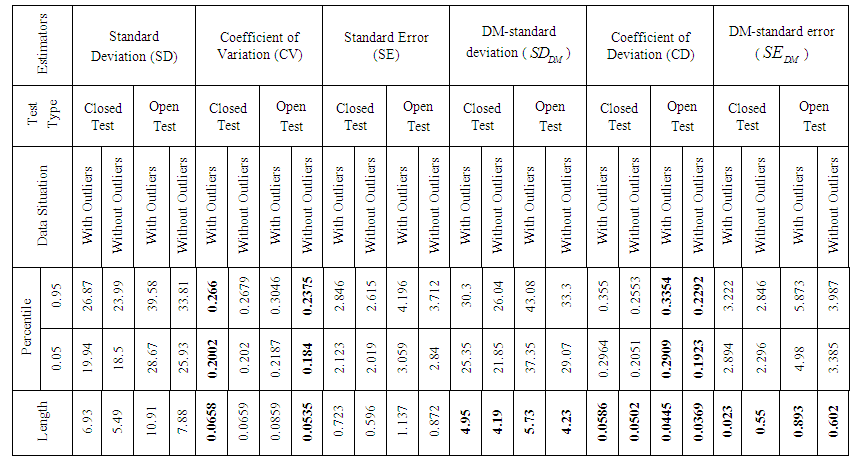 | Table 3. Comparison of Percentile Length of Six Different Estimators of Dispersion for Score Data with Outliers and without Outliers by Bootstrap |
5. Jackknife
- Jackknife a technique for estimating the bias and standard error of an estimate. The jackknife predates the bootstrap and bears close similarities to bootstrap [6]. Here, I apply the jackknife technique to the data set on the test scores for 88 students given in [16]. I divided the data set into two categories: one is original data that is consists with outliers and another is free from outliers. Now, I compute a jackknife report in order to examine the performance of the classical measures i.e., standard deviation (SD), coefficient of variation (CV), standard error (SE) and our newly proposed estimators of dispersion i.e., DM-standard deviation ( ), coefficient of deviation (CD), DM-standard error ( ). I investigate those six estimators to find out appropriate inference tools in compare to standard error, bias and percentile length of jackknife. The jackknife focuses on the samples that leave out one observation at a time. Now the outcome of jackknife are given above-As it can be seen, in the presence or absence of outlying observations, the standard error (SE), bias and percentile length of the classical estimators of dispersion have given high values than my newly proposed estimators of dispersion. Mention that popular and commonly used classical estimators certify that closed test is much better than open test book performance when outliers occur in the data set. Although, it is well known that jackknife is very much sensitive to outliers, in the meantime, my proposed measures announce that open test is very much effective than closed test book performance for student when the data set holds outliers or free from outliers, my newly proposed estimators which provide the best results in this cases; such results are given in Table 4 & 5.
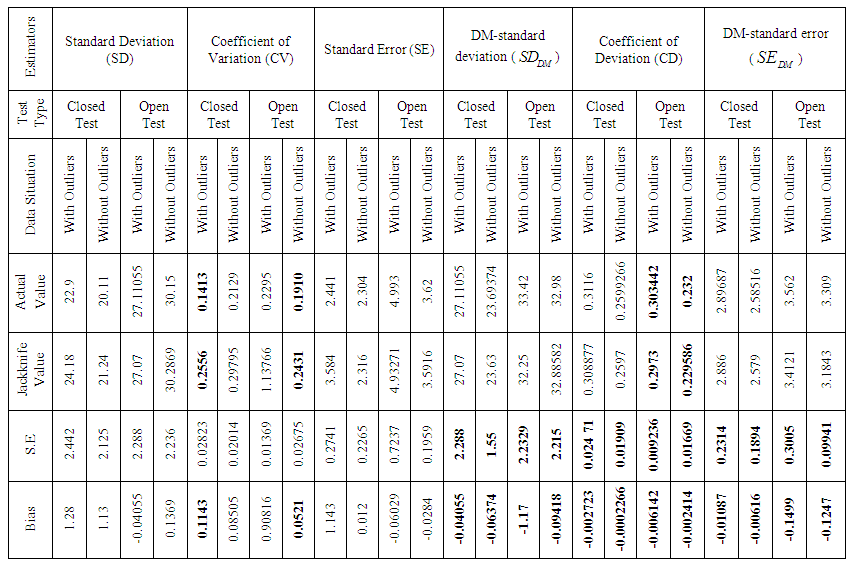 | Table 4. Jackknife Results Comparison of Six Different Measures of Dispersion for Score Data set With Outliers and Without Outliers |
 | Table 5. Comparison of Percentile Length of Six Different Estimators of Dispersion for Score Data with and without Outliers by Jackknife |
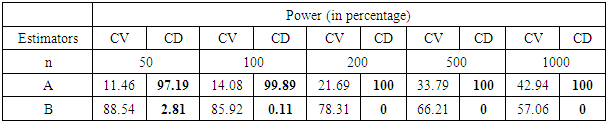
6. Monte Carlo Simulation Study Report
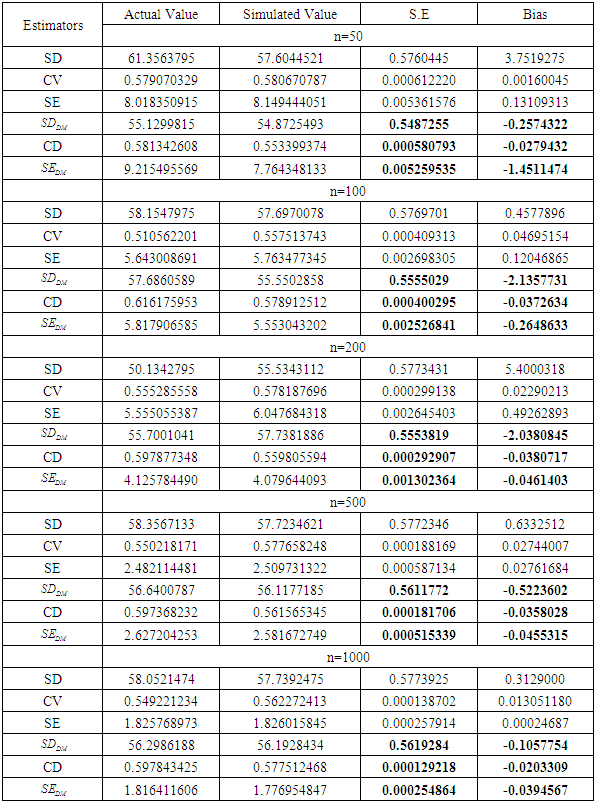
- In the previous section, I consider real life data to see how the outliers affect the right conclusion. I also analyze this data set by bootstrap and jackknife computer based method to find out the robust measure for right inferences. But these are not enough to get a final answer to a problem. In this section, I study a Monte Carlo simulation that is planned to compare the power performance of the classical estimators for appropriate solution in any situation of data. I simulate artificial two sets data, A and B, namely from uniform distribution. Firstly I make sure that the data set A is much better than the data set B. In general, I also simulate to compare the performance of my newly proposed estimators with classical popular and frequently used estimators of dispersion and compute the simulated mean, bias and standard error (SE). I now consider five different sample sizes, n=50, 100, 200, 500 and 1000. Then I generate sample from uniform distribution based on A and B and in general. Each experiment is run 10,000 times and the results are shown below-
|
|
7. Conclusions
- In this paper, I have considered six estimators of dispersion to find out the right decision. In section 3 I have taken real data set for correct judgment. I demonstrated that the classical estimators of dispersion have given opposite results when the data set contains outliers. Alternatively, my proposed estimators have provided appropriate choice in both cases. In section 4 and 5 I observed that the standard error (SE), bias and percentile length of my proposed estimators presented very low than the classical estimators of dispersion by bootstrap and jackknife computer based methods. In section 6, Monte Carlo simulation confirmed that the newly proposed estimators perform better than any other classical estimators of dispersion for different sample sizes. Therefore, from the survey of aforesaid discussion I observe that my newly proposed three estimators perform very sound in every situation. So, I recommend utilizing these.
ACKNOWLEDGEMENTS
- The author would like to thank the obscure reviewers for their helpful comments to enrich the quality of this paper.