-
Paper Information
- Paper Submission
-
Journal Information
- About This Journal
- Editorial Board
- Current Issue
- Archive
- Author Guidelines
- Contact Us
International Journal of Statistics and Applications
p-ISSN: 2168-5193 e-ISSN: 2168-5215
2018; 8(6): 305-308
doi:10.5923/j.statistics.20180806.03

Comparison of Shrinkage–Based Estimators in the Presence of Missing Data: A Multiple Imputation Analysis
 Abstract
 Reference
 Full-Text PDF
 Full-text HTML
M. T. Nwakuya1, J. C. Nwabueze2
1Department of Mathematics/Statistics, University of Port Harcourt, Port Harcourt Rivers, Nigeria
2Department of Statistics, Michael Okpara University of Agriculture Umudike, Abia State, Nigeria
Correspondence to: M. T. Nwakuya, Department of Mathematics/Statistics, University of Port Harcourt, Port Harcourt Rivers, Nigeria.
| Email: |  |
Copyright © 2018 The Author(s). Published by Scientific & Academic Publishing.
This work is licensed under the Creative Commons Attribution International License (CC BY).
http://creativecommons.org/licenses/by/4.0/

In this paper we examined the performance of the mean square error of the Ordinary Least Square (OLS) estimator, Minimum Mean Square Error (MMSE) estimator, N/N shrinkage Estimator (N/NSE) and a proposed Adjusted Minimum Mean Square Error (PAMMSE) estimator in a multiple imputation analysis when data points are missing in different data sets. The program for the proposed adjusted minimum mean square error was written and implemented in R. It is shown by numerical computations that the PAMMSE Estimator seem to be the best choice among OLS, MMSE, N/NSE and PAMMSE estimators in terms of their mean square errors when applied in multiple imputation analysis.
Keywords: Mean square error, Shrinkage estimator, Imputation numbers, Multiple Imputation, Missingness
Cite this paper: M. T. Nwakuya, J. C. Nwabueze, Comparison of Shrinkage–Based Estimators in the Presence of Missing Data: A Multiple Imputation Analysis, International Journal of Statistics and Applications, Vol. 8 No. 6, 2018, pp. 305-308. doi: 10.5923/j.statistics.20180806.03.
1. Introduction
- Missing data is always a major concern in most data analysis. Awareness has grown of the need to go beyond complete case analysis of datasets with missing data points, following the work of Rubin [5] and [4]. Complete case analysis basically means deleting every missing points. This method leads to reduction of sample sizes which invariably reduces the degree of freedom. In other to avoid the short falls of complete case analysis and other missing data methods, the multiple imputation method was introduced by [5]. The basic idea of data analysis with multiple imputations is to create ‘m’ different copies of a data each of which has its missing value suitably imputed. These complete data sets are each analysed independently. The estimates of interest are averaged across the ‘m’ copies to give a single estimate. In most analysis the number of multiple imputations is not usually considered during parameter estimation. [2] Observed the need to incorporate the number of imputations in parameter estimation and investigated Ohtani’s shrinkage estimator. Ohtani [3] proposed a shrinkage estimator for regression estimates, hinging on [7] stein’s shrinkage estimator. This [7] Stein’s shrinkage estimator was found to dominate Ordinary Least square estimator in terms of mean square error. [2] Proposed anextension of Ohtani’s shrinkage estimator to multiple imputation analysis, their Shrinkage estimator also showed to have a lower mean square error than the Ordinary Least Square method. As one of the shrinkage estimators for regression coefficients, [8] Proposed the minimum mean square error (MMSE). [3] Derived the exact formula of the mean square error of the minimum mean square error (MMSE) estimator and showed that minimum mean square error (MMSE) dominates the Ordinary Least Square estimator in terms of mean square error. Further [3] proposed an adjusted minimum mean square error (AMMSE) estimator and showed that it has a lower mean square error than minimum mean square error (MMSE) estimators. In this work our focus is on the adjusted minimum mean square error estimator and how it can be extended to incorporate the number of multiple imputations.Mean square error is arguably the most important criterion used to evaluate the performance of an estimator. It is calculated as t sum of the variance of the estimator and the squared bias of the estimator; this relationship is given by
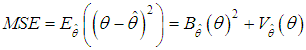 | (1) |
2. Estimators
- Given a regression model;
 | (2) |
 Vector of observations
 Matrix of observations
 Vector of Coefficients
 Vector of Error termsThe Ordinary Least Square estimator is given by:
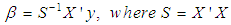 | (3) |
 | (4) |
 , where
 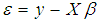 , n is the sample size and m is the number of imputations. This estimator can be seen in [2] as an extension of Ohtani’s shrinkage estimator, which he proposed based on Stein’s estimator [7].The minimum mean square error (MMSE) estimator is given by;
 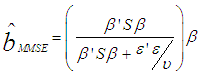 | (5) |
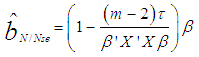
 , k is defined as the number of parameters, while n is the sample size. This estimator is a biased estimator but was proved to be the best in terms of mean square error among the class of linear homogenous estimators [9].The Adjusted Minimum Mean Square Error estimator is given by;
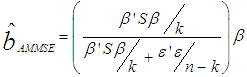 | (6) |
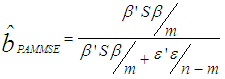 Where m is the number of imputations and the other parameter as defined in equations 3 and 4.
3. Analysis
- Three different normally distributed regression data sets of sample sizes 20000, 8000 and 30each with 10% missing values were simulated in R. The missing points on the data sets were suitably imputed using 6 different imputation numbers; m= 5, 15, 20, 30, 40 and 50. Each data set was imputed using each of the imputation numbers and analyzed independently using each of the four methods. The mean square errors were calculated for each of the methods. A comparison test among the methods was also done at 0.05 level of significance. Below are the tabulated results (table 1.1).• OLS
 Ordinary Least Square • MMSE
  Minimum Mean Square Error Estimator • N/NSE
  Nwakuya/Nwabueze Shrinkage Estimator• PAMMSE
  Proposed Adjusted Minimum Mean Square Error Estimator
 4. Observations
- From table 1.1, visually we can see that the value of the mean square error was highest with the OLS followed by the MMSE then the N/N Shrinkage Estimator and then the proposed adjusted minimum mean square error. Going further a paired comparison test was carried out to determine if the mean square errors from the four methods were significantly different from each other. Results shown in table 1.2 for the comparison test, shows that the mean square errors are significantly different from each other this shows that the visual differences seen among the estimators are statistically significant.
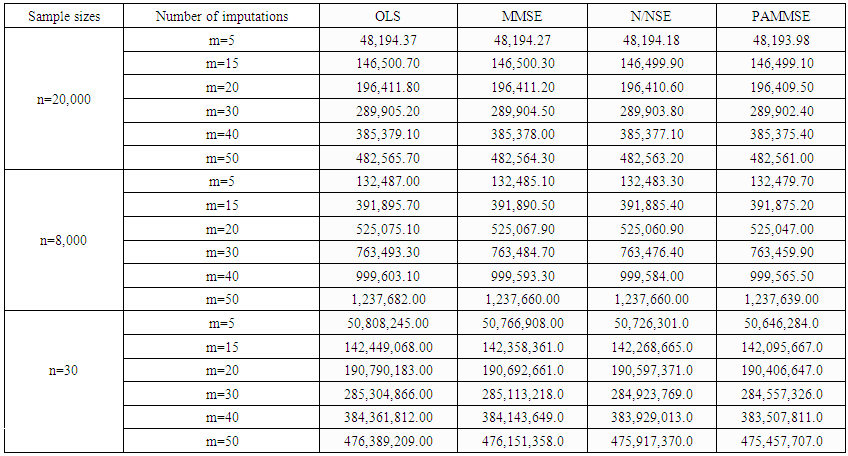 | Table 1.1. Mean Square Error from Four Different Estimators with Different Sample Sizes and Different Imputation Numbers |
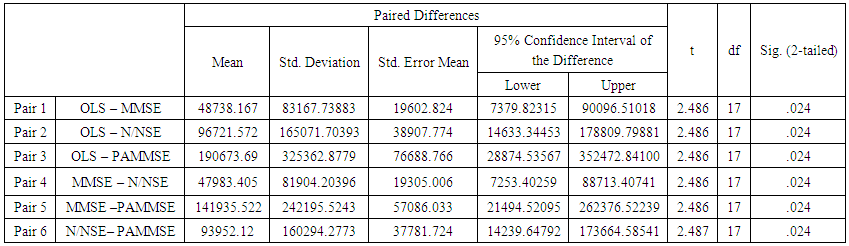 | Table 1.2. Paired Comparison Test for the Four Estimators |
5. Conclusions
- The results have shown that indeed the proposed adjusted minimum mean square error has the least mean square error and at such dominates the other estimators. We can conclude that amongst the four estimators presented in this work the proposed minimum mean square error estimator seemed to do better than the other estimators considered in this research work.