-
Paper Information
- Paper Submission
-
Journal Information
- About This Journal
- Editorial Board
- Current Issue
- Archive
- Author Guidelines
- Contact Us
International Journal of Statistics and Applications
p-ISSN: 2168-5193 e-ISSN: 2168-5215
2018; 8(6): 297-304
doi:10.5923/j.statistics.20180806.02

Forecast Incidence of Dengue Fever Cases in Fiji Utilizing Autoregressive Integrated Moving Average (ARIMA) Model
Nirma Narayan
Research Unit, College of Medicine, Nursing and Health Sciences, Fiji National University, Suva, Fiji
Correspondence to: Nirma Narayan , Research Unit, College of Medicine, Nursing and Health Sciences, Fiji National University, Suva, Fiji.
| Email: |  |
Copyright © 2018 The Author(s). Published by Scientific & Academic Publishing.
This work is licensed under the Creative Commons Attribution International License (CC BY).
http://creativecommons.org/licenses/by/4.0/

This paper examined the trend of dengue fever cases obtained from January 1995 to July 2017 from National Notifiable Disease Surveillance System (NNDSS) records, Fiji Ministry of Health and Medical Services. Box-Jenkins technique and model is applied to forecast incidence of dengue cases from August 2017 until December 2018. ARIMA model is proposed to forecast incidence of dengue fever in Fiji through Box-Jenkins approach. The Augmented Dickey Fullers test revealed that the time series data had unit root indicating non-stationary. The Autocorrelation and Partial Auto-correlation plots of the first order difference of the dengue fever data suggested parameters ARIMA(3,0,4) and ARIMA(3,1,4). The model ARIMA(3,0,4) was determined as the best fitted model which made a good forecasting performance in estimating the expected incidence dengue cases with lower Mean Absolute Percentage Error (MAPE) of 1148.319 and lower Bayesian Information Criterion (BIC) of 11.389. Finally, a forecast for dengue cases was obtained indicating the highest number of cases for December 2018 with estimated cases of 265. The ARIMA model method utilized in this paper forecasted the incidence trend of dengue fever cases effectively. Such results would be beneficial to health professionals and policy makers in planning of public health interventions and improvement to such disease epidemics. The efficacy of expected cases of dengue fever accomplish not only in detecting outbreaks, but also in delivering decision makers with a reasonable trend of the variability of future observations encompassing both historical, recent information and for evidence based decision making purposes.
Keywords: Dengue Fever, Forecast, Model, Autoregressive Integrated Moving Average, Box-Jenkins, Mean Absolute Percentage Error, Bayesian Information Criterion
Cite this paper: Nirma Narayan , Forecast Incidence of Dengue Fever Cases in Fiji Utilizing Autoregressive Integrated Moving Average (ARIMA) Model, International Journal of Statistics and Applications, Vol. 8 No. 6, 2018, pp. 297-304. doi: 10.5923/j.statistics.20180806.02.
Article Outline
1. Introduction
- Dengue fever is an immensely infectious disease that has become a significant public health issue locally and primarily in tropical and subtropical zones globally. Such disease contributes to economic, social and health encumbrance. Dengue is transmitted between human host through the bite of a species of day-feeding mosquito; Aedes aegypti with one of the four dengue virus stereotype of flavivirus classified on biological and immunological criteria. Globally, the World Health Organization records indicated an estimated figure of 50-100 million dengue infections per year. Dengue fever initially emerged in Fiji in 1975 with subsequent outbreak in 1979 up till 1980 [1]. The 1997-1998 outbreak of dengue fever was immersive with 24,000 cases and three deaths with such disease gradually spreading to rural areas [1]. Recent local cases reported in 2017 included age group of 10 years to 39 years and 85% of such cases from laboratory tests indicated records in the Central and Western division [2] Considering records from Fiji Ministry of Health and Medical Services, the highest number of cases were reported in 2014 and incidence ratio was as high as 1077 cases per 100,000 population. This was the latest epidemic with 9942 cases within that year [3]. Further, dengue fever was classified as the top ten causes of morbidity by disease in 2014 with case fatality rate of 0.8% [3]. Health forecasting of dengue fever outbreak is an innovative area of forecasting and a valuable means for predicting future health situations such as demands for health services and healthcare needs. Predicting dengue fever outbreak can assist health authorities to take effective measures to handle any unexpected situation, determine figures for future would prepare for medication and health care intervention strategies, by pre-informing health service providers to take appropriate mitigating actions to minimize risk and administer demands.Various literatures have indicated on many popular dengue fever forecasting methods and techniques that have been utilized by numerous researchers to deduce the incidence of dengue fever cases. Such methods and techniques included Support Vector machines (SVM), K-H Model, Multivariate Poisson Regression and Artificial Neural Networks (ANN). Most recent studies have utilized the time series analysis techniques predominantly ARIMA modelling. A research on three dengue target predictions for two locations specifically, peak height, peak week and total number of cases was reported during a transmission season. Ensemble models were used and created by combining three disparate types of component models that were two-dimensional Methods of Analogues models, additive seasonal Holt-Winters models and historical models [4]. Findings of such study indicated higher score for peak height by the ensemble models. In contrast, a research study in Singapore developed a set of statistical models utilizing least absolute shrinkage and selection operator (LASSO) technique to predict the incidence of dengue notifications by weekly considering three-month time. Convenient forecasts were acquired using the LASSO method and based on the mean average percentage error, accurate forecasts were provided [5]. A study conducted to determine the trend and forecasting the occurrence of dengue haemorrhagic fever in Asahan district, North Sumatera province utilized Autoregressive Integrated Moving Average Model. Minitab version 16.0 software was used for the model with parameter SARIMA (1,0,0) (0,1,1) considered as the best fitting model and satisfactory for the dengue haemorrhagic fever [6]. A study conducted on modelling and forecasting the monthly number of dengue fever cases in Southern Thailand developed Autoregressive Integrated Moving Average Model on data acquired from 1994-2005. The models were validated using the data collected from January to August 2006. The ARIMA model with parameters (1,0,1) was adequate for the data and the prediction indicated that the number of dengue cases in the area would increase with a range of 403-1169 cases from January to December 2006 [7]. Another study utilized ARIMA model to model the monthly figure of dengue fever cases in the north eastern Thailand. ARIMA models were developed on the monthly data collected from January 1981 to December 2006 and was validated using the data from January 2007 to April 2010. The most suitable model was ARIMA(3,1,4) with least Akaike Information Criterion and Mean Absolute Percentage Error [7]. Based on global perspective, a research on factors associated with dengue mortality from a national registry in Malaysia indicated overall dengue case fatality rate of 0.2% [8]. [2] According to a recent study in Southern Oshida, India, dengue epidemics has been becoming more frequent, contributing to case fatality rate of 1.03% whereas World Health Organization records indicated case fatality rate for dengue fever roughly as 5% in 2008 [9, 10]. During the period of 1995-2015, Fiji Ministry of Health and Medical Services recorded most number of dengue cases in years 2015, 2014, 2008, 2003 and 1998 with the lowest number of cases as 1677 [11]. The desirability of an early warning system for dengue fever epidemic is considered necessary to reduce the risk and the intensity of dengue fever in Fiji. The study was conducted in Fiji which is a South Pacific Island nation that comprises of an archipelago of approximately 330 islands with a total population of 884,887 in 2017 [12]. It covers around 1.3 million square kilometres of the South Pacific Ocean, lies between 15o and 22o south of the equator. The two larger islands on which most of the population resides are Viti Levu and Vanua Levu. The main capital city is Suva. The average male and female life expectancy at birth was 66.3 and 70.4 in 2013 respectively [12]. The objectives of the study was to examine the trend of dengue fever cases from January 1995 till July 2017. In addition, to forecast incidence of dengue fever cases from August 2017 to December 2018 using ARIMA Model through Box-Jenkins approach.
2. Methods
2.1. Data Source and Data Compilation
- This study utilized computerized datasets of monthly notifications of dengue fever cases from health facilities of four divisions (Central, Eastern, Western and Northern) of Fiji from the period of 1 January, 1995 through to 31 July, 2017. These datasets were obtained from the Health Information Unit, Ministry of Health and Medical Services, Fiji. The statistical packages utilised were Econometric Views (EViews) and Statistical Package for Social Science (SPSS). EViews software to determine the stationarity of the dengue data for 271 months. Statistical Package for Social Science (SPSS) version 25.0 was utilized for developing the Autoregressive Integrated Moving Average (ARIMA) models with the Box-Jenkins approach. Since data is indicated in time, time series analysis becomes an appropriate statistical method to implore.
2.2. Augmented Dickey-Fuller Test
- The preliminary test for stationarity of the dengue fever cases was conducted in which differences as well as transformation were taken in aid of a sequence chart as indicated in Figure 1. Stationarity means when a joint probability of a series does not change over time in which case the mean and variance remains constant over time [13]. The theory of Augmented Dickey Fuller’s test was utilized to check the dengue fever dataset for stationarity. In theory, a procedure was developed by David Dickey and Wayne Fuller for testing whether a variable has a unit root or equivalently, that the variable follows a random walk [14, 15]. The testing procedure for the ADF test is the same as for the Dickey-Fuller test but is applied to the model:
 | (1) |
 is a constant,
  the coefficient on a time trend and
  the lag order of the autoregressive process. Imposing the constraints
  and
and  corresponds to modelling a random walk and using the constraint
  corresponds to modelling a random walk with a drift. Consequently, there are three main versions of the test as discussed by Hamilton, analogous to the ones discussed on Dickey-Fuller test [16]. By including lags of the order
  the ADF formulation allows for higher-order autoregressive processes. This means that the lag length
  has to be determined when applying the test and one possible approach is to test down from high orders and examine the t-values on coefficients. The unit root test is then carried out under null hypothesis
  against the alternative hypothesis of
  . Once a value for the test statistic:
  | (2) |
 is rejected and no unit root is present [16].
 2.3. Box-Jenkins Methodology
- The objective of Box-Jenkins approach is to find a parsimonious ARIMA model that depicts inherent generating process of the observed time series. The Box-Jenkins method consist of three specific stages namely identification, fitting and diagnostic checking and using ARIMA time series models that is a time series forecasting method proposed by Box and Jenkins in the early 1970s [17]. ARIMA is a generalization of Autoregressive Moving Average (ARMA) Model and these models are fitted to time series data either to better understand the data or to predict future points in the series [18]. The “AR” component of the ARIMA model denotes that the evolving variable of interest is regressed on its own lagged values. The “MA” component indicates that the regression error is actually the linear combination of error terms whose values occurred simultaneously and at various times in the past. The “I” denotes that the data values have been replaced with the difference between their values and the previous values [19]. Stationary assumption allows to make simple statements about the correlation between two successive values,
 and
and  [20] Such correlation is called the autocorrelation of lag of the series. The partial autocorrelation function (PACF) gives the partial correlation of a time series with its own lagged values, controlling for the values of the time series at all shorter lags. It contrasts with the autocorrelation function, which does not control for other lags [20].
2.3.1. Definition
- Given a stationary time series of data
 an ARMA model denoted by ARMA
  consist of two parts, an Autoregressive (AR) part of order
  and a Moving Average (MA) part of order
  [20]. Thus, the ARMA model of order
  and
and  , denoted by ARMA
  , is given by:
  | (3) |
 is a constant,
  is a vector of autoregressive coefficients,
  is a vector of moving average coefficients, and
  are error terms assumed to be independent, identically distributed random variables sampled from a distribution with mean equal to zero and variance
  [21]. If the time series data show evidence of non-stationarity, the data can be stationarized by introducing difference operators in the model. The first difference operator is given by
  | (4) |
 difference operator is given by
  | (5) |
 is the lag operator given by
  | (6) |
 where
where  is the number of differencing passes is obtained. The mathematical form of the ARIMA
  model is
  | (7) |
 | (8) |
 | (9) |
3. Results
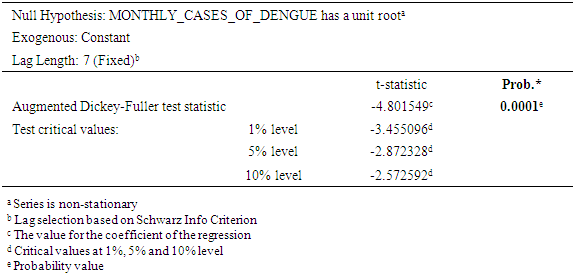
- The trend for retrospective data on dengue fever cases (Figure 1) was created using EViews software and graph was obtained. Such grahical illustration of the indicated peak for the years 1998, 2003, 2008, 2014. ADF test was then accomplished in the EViews software to test for stationarity. The series was taken at level in the Test equation to test for unit root on dengue fever cases. At this stage, the maximum number of lags was selected by finding the cube root of 271 months;
 indicating 6.471273627 and a rounded off value of 7 (user specified) was used for Schwarz Info Criterion [22]. The results of ADF test is indicated in Table 1. Table 1 shows that the null hypothesis indicates that the figure has a unit root connoting that the series is non-stationary. The null hypothesis of ADF test indicates that series is non-stationary.The t-statistic of the regression model is -4.801549 and the test critical values are indicated -3.455096 for 1%, -2.872328 for 5% and -2.572592 for 10% level. The probability value; 0.0001. Since the probability value is <0.05, the null hypothesis is rejected. Therefore, the series is stationary at 95% Confidence Interval.
|
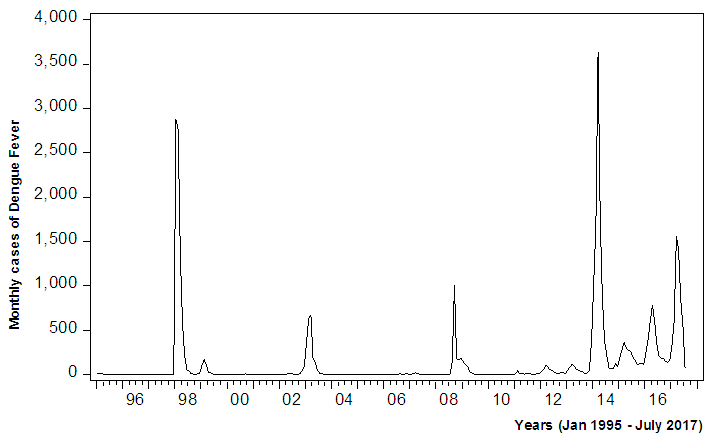 | Figure 1. Number of Notified cases of Dengue Fever between January 1995 and July 2017 in Fiji |
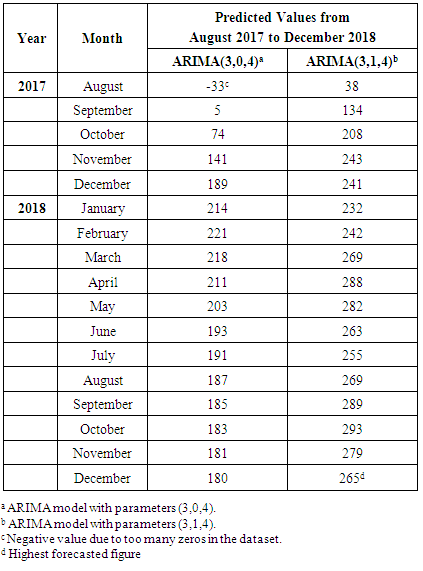
 for 22 years and 7 months or 271 months were used for constructing the Univariate Box-Jenkins method. The forecasting feature in SPSS was used and assignment of respective ARIMA parameters, specifically ARIMA(3,0,4) and ARIMA(3,1,4). The predicted values for August 2017 up to December 2018 was executed with forecasted graphical illustrations indicated in Figures 4 and 5. The Mean Absolute Percentage Error (MAPE) and Bayesian Information Criterion (BIC) was also calculated. Graphs of autocorrelation function (ACF) and partial autocorrelation function (Figures 2 and 3) indicates transformed series respectively. The ACF and PACF were analysed from dengue fever cases in Fiji (Figure 1). Based on 95% Confidence Interval width, (Figures 2 and 3) imply that q=4 and p=3 because the ACF in Figure 2 is cut off at lag number 4 and the PACF in Figure 3 is cut off lag number 3. Among the models, ARIMA (3,0,4) had lowest Mean Absolute Percentage Error (MAPE) of 1148.319 and lower Bayesian Information Criterion (BIC) of 11.389 and appeared to be the best model (Table 2).
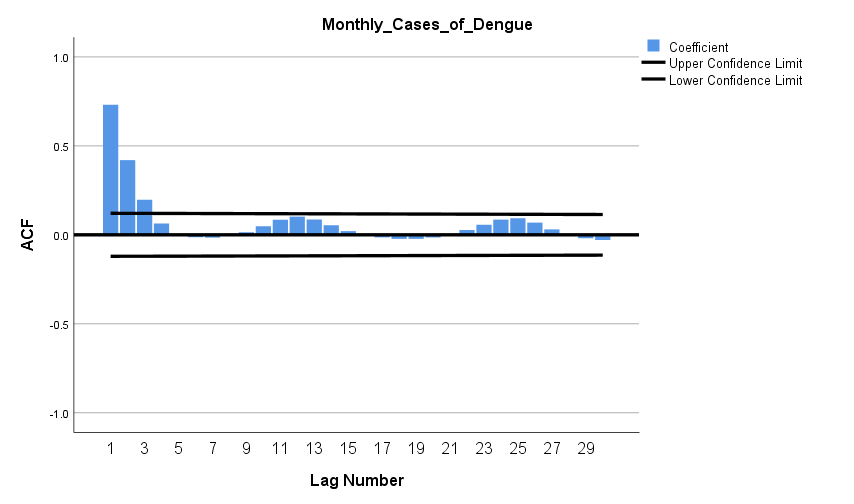 | Figure 2. Autocorrelation function (ACF) plotted against time lag |
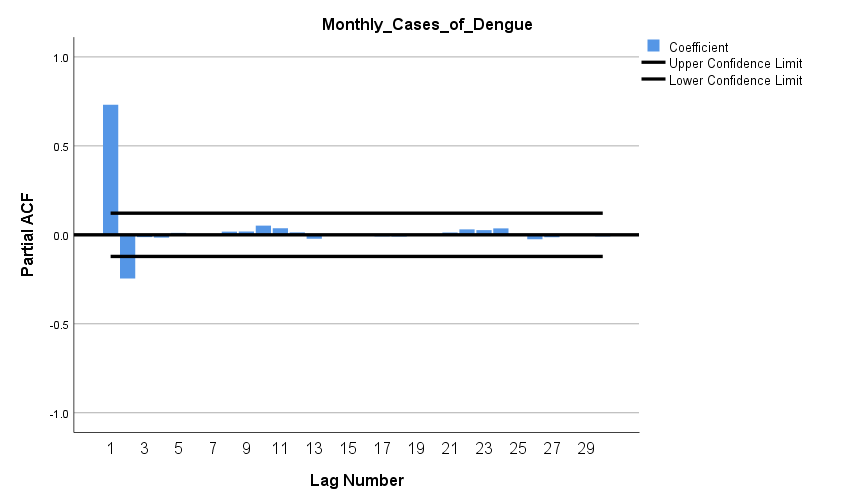 | Figure 3. Partial autocorrelation function (PACF) plotted against time lag |
|
4. Discussion
- Attempts to model dengue fever cases in numerous studies have used statistical data analysis approach for time series analysis. Seasonal ARIMA model was developed by Choudhury on monthly data collected between September 2006 to October 2007 in Dhaka, Bangladesh, to predict the dengue incidence using time series analysis and found that seasonal ARIMA (1,0,0) (1,1,1) model to be the most suitable to predict future cases for November 2007 to December 2008 [23]. A study carried out utilized hybrid model combined with seasonal ARIMA and made the good forecasting performance and estimates of the expected incidence cases from December 2012 to May 2013 [24]. Alternatively, a study in Southern Thailand forecasted the monthly number of dengue haemorrhagic fever cases by an ARIMA (1,0,1) model [25]. The results of the study confirm the existence of dengue fever cases in Fiji in the upcoming months of 2018. According to the predicted values, it is indicated that the highest number of dengue fever cases in Fiji should occur in December 2018 with 95% confidence interval (CI) of -8 to 325 cases. The observed series in Figure 1 shows that the series is non-stationary and fluctuations are indicated in the dataset. ARIMA (3,0,4) has the lowest MAPE (1148.319) and BIC (11.389) (Table 2). The results from this study show that the ARIMA model is a very effective and reliable predictive model for determining the number of dengue cases in a population, and is a useful tool for disease control and prevention. A study by Allard claims that ARIMA models are a useful tool for interpreting surveillance data and that the usefulness of forecasting expected number of infectious disease reports consists not so much in detecting outbreaks or providing probability statements, but in giving decision makers a vibrant idea of the variability to be expected among future observations [26]. A dengue virus outbreak is known to have started in Fiji in 1997, thus the other peaks in the time series shown is in Figure 1 for the years 1998 and 2014. ARIMA with the parameters that was utilized were ARIMA(3,0,4) and ARIMA(3,1,4) inclusive of level and first difference for the parameter d. Utilizing the forecasting analysis method in SPSS, the predicted values from August 2017 till December 2018 was obtained as tabulated in Table 3 also illustrated in Figures 4 and 5) respectively. ARIMA(3,0,4) model produced good estimates for each month, even though the time series contains periods with reasonably large numbers of dengue fever cases. It appeared that the predicted values could follow the upturn and downturn of the observed series reasonably well. A predicted value has shown a negative value, which is a common case with a series with too many zeros as observed values in the series.
|
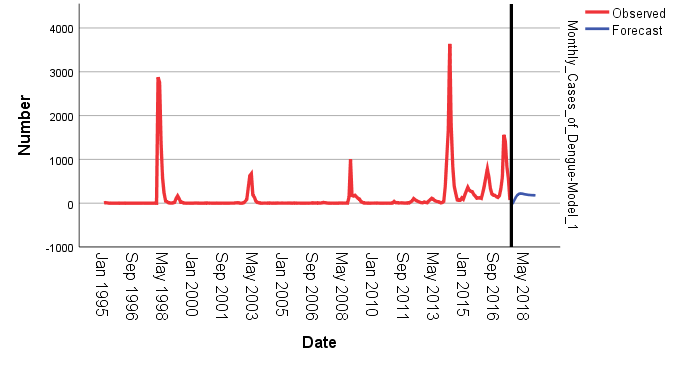 | Figure 4. Model for ARIMA(3,0,4) |
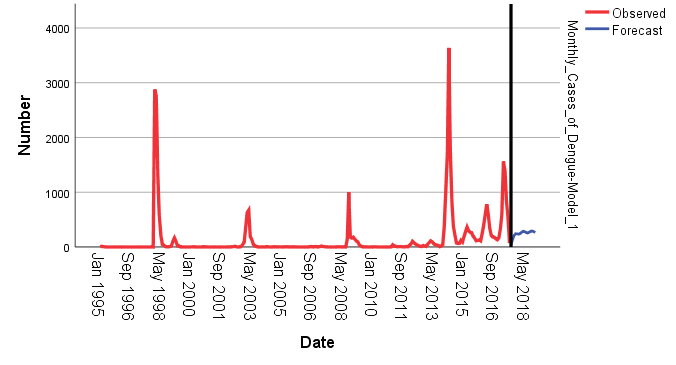 | Figure 5. Model for ARIMA(3,1,4) |
5. Conclusions
- ARIMA models are expedient tool for analysing time series data containing ordinary trend. As more routinely collected data become available, forecasting offers the potential for improved contingency planning of public health interventions, improve epidemic prevention and control capabilities and more broadly based forecasting. A comprehension population health forecasting model has the potential to interpolate new and significant information about the future health status of the population based on current conditions, socioeconomic and demographic trend and potential changes in policies and program.
ACKNOWLEDGEMENTS
- The researcher wishes to express appreciation to Ms. Sharon Biribo for sharing her pearls of wisdom during the course of this research.
 Abstract
 Reference
 Full-Text PDF
 Full-text HTML